NANOCLUSTERS OF AMORPHOUS SILICON
R. Khatri*
The electronic structure of amorphous silicon nanoclusters is calculated within the empirical tight binding approximation. The electronic states are classified into three groups: extended and weakly and strongly localized. The last category practically disappears in hydrogenated amorphous silicon clusters for which the blueshift is comparable to what is predicted for crystallites. The radiative recombination rates are comparable for small clusters (1 nm) but 2 orders of magnitude higher for larger clusters (2 nm) of the amorphous phase due to disorder induced breaking of selection rules.
Although indirect gap bulk semiconductors like silicon have a low photoluminescence efficiency the situation improves in nanocrystallites where the corresponding selection rules are broken as in the case of crystalline porous silicon (pc-Si) [1–4]. Despite this the radiative recombination rate of the electron-hole pair in pc-Si remains too low to reach a high electroluminescence efficiency. A higher efficiency has been obtained in bulk amorphous silicon sa-Sid due to structural disorder [5]. One might thus hope that both effects (breakdown of the selection rules due to confinement and structural disorder) when combined could lead to a substantial improvement. Photoluminescence has indeed been observed in porous amorphous silicon spa-Sid [6–9].
%
The experimental results show some similarity with those obtained for the photoluminescence of pc-Si but seem to depend on the method of preparation. Interesting optical properties have been also observed for a-Si pillar structures [10], a-Si cluster films [11], and for superlattices made of silicon oxide and noncrystalline silicon [12]. From the theoretical side pa-Si raises extremely interesting problems. The first one is related to the confinement induced blueshift of the energy gap: (i) Does it exist in clusters of a-Si and is it comparable to what is obtained for c-Si and (ii) what is the behavior of disorder induced localized states in this regard? Another central point concerns the possible enhancement of the radiative recombination rate. The aim of this paper is to provide answers to these fundamental questions which are also relevant for nanoclusters of other semiconductors. A generally accept picture of the electronic structure of a-Si is that it is still composed of valence and conduction bands separated by an energy gap but with bandtails of defect or disorder induced localized states extending into the gap. Applying this picture to nanosized clusters one expects the boundary conditions to have similar effects on the extended states in both c-Si and a-Si clusters: quantization of the energy and resulting blueshift. This will not be the case for the localized states belonging to the bandtails. For what follows we find it useful to classify these states into three categories:
(1) Delocalized states, experiencing the full confinement effect as for c-Si.
(2) Strongly localized states with extension in space much smaller than the cluster diameter and energies deep in the gap, insensitive to the confinement effect and showing no blueshift.
(3) Weakly localized states with extension in space of the order of the cluster diameter and energies near the gap limits, subject to an intermediate blueshift.
&
of this material by a method detailed in the following. The new structure we obtain will be referred to as the a-Si:H model. The hydrogen concentration that we consider is 8.3%, which is in the range of experimental values.
To determine the electronic structure of the clusters we use the sp3sp empirical tight-binding (ETB) method [15]. This is a nearest neighbors description which allows one to treat cluster sizes in the 1–3 nm range. Associated with a R2n dependence of the ETB parameters upon interatomic distance it also produces reasonable deformation potentials. This is important for our a-Si clusters in order to simulate correctly the influence of local atomic distortions on the electronic structure. A limitation of the sp3sp parametrization scheme is that it underestimates the blueshift for silicon crystallites [16]. This is unimportant here since our main goal is a relative comparison of the confinement effect for c-Si and a-Si clusters of the same size. Finally, for small clusters (up to 60 Si) we have verified the consistency of our results with those of ab initio local density calculations for the same structure performed with the code of Ref. [17].
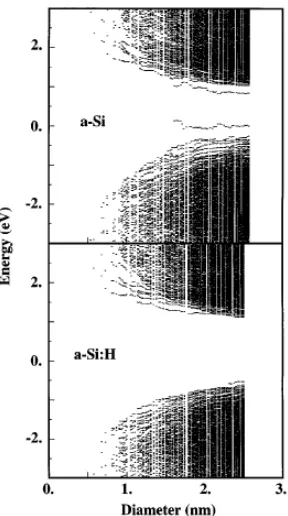
FIG. 1. Confinement energy for an amorphous cluster as a function of its diameter for a-Si and a-Si:H. The center of the clusters is kept constant. Each column of points represents the energy levels of a cluster.
the end it must produce a situation close to an optimized a-Si:H structure. Once this is done the atomic positions are again relaxed by use of a Keating model. Figure 1describes the net results of this procedure and strikingly shows that the most localized states have disappeared. The remaining states (close to the gap or not) now all exhibit a substantial blueshift corresponding either to weakly localized or fully delocalized states.
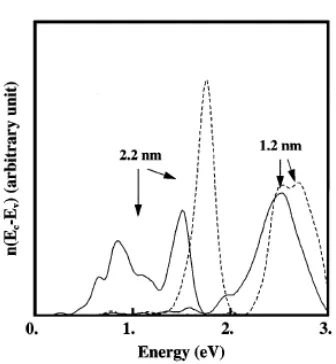
substantial blueshift in both cases, more important for a-Si than for a-Si:H. Furthermore, our larger a-Si clusters give rise to a two-peak distribution. We have checked that the lower and upper peaks are, respectively, due to strongly and weakly localized or delocalized states. The relative intensity of the upper peak thus corresponds to the proportion of clusters which do not contain strongly localized states. If p is the probability that such states are localized on a give
atom then, for a cluster of N atoms, this proportion is of order (1 – p)N = exp(-pN) for small p.
For 2.2 nm clusters (N = 250 atoms), Fig. 2 shows that pN = 1, i.e. p = 4 x 10⁻³ closely
corresponding to a direct counting of the tail states for our a-Si model. This is no more the case for the small 1.2 nm a-Si clusters for which pN is much smaller and exp(-pN) =1 i.e., the upper peak dominates. The apparent blueshift in a-Si clusters has thus two origins: (i) the varying proportion of clusters with strongly localized states as already emphasized in Ref. [19], and (ii) the normal confinement
FIG. 2. Density of states n(E) for E = ELUMO - EHOMO
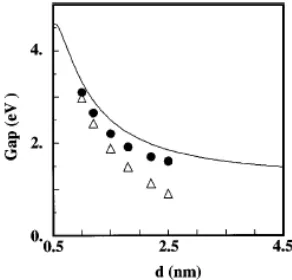
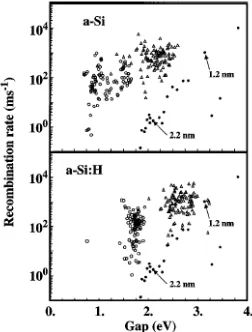
effect on the other states. This is confirmed on the same figure by the a-Si:H clusters (dashed lines), which show only the second type of behavior. Figure 3 shows the average HOMO-LUMO gap versus size for clusters with randomly chosen center in the 4096 unit cell compared to the same quantity for c-Si clusters. As expected from the discussion of Fig. 2, the lowest values correspond to a-Si while the blueshift for a-Si:H is surprisingly close to c-Si clusters. The second quantity of experimental interest is the radiative lifetime. This has been calculated along the lines of Ref. [20]. Figure 4 shows that for small clusters (1.2 nm) the results for a-Si and a-Si:H are comparable to c-Si, i.e., the lifetime is dominated by the breaking of selection rules. This is no more true for the larger (2.2 nm) clusters for which the radiative lifetime of a-Si clusters (hydrogenated or not) is two orders of magnitude larger than for c-Si clusters due to disorder induced effects.
FIG. 3. Average HOMO-LUMO gap of amorphous clusters with randomized centers compared to crystallites: a-Si (∆), a-Si:H and c-Si (full line).
FIG. 4. Recombination rates amorphous silicon clusters with randomized centers and diameters equal to 1.2 nm snd and 2.2 nm ssd. For comparison the black dots give the corresponding values for crystallites vs energy as obtained in
Ref. [20]. The arrows point to the results obtained for nanocrystallite with diameters equal to 1.2 and 2.2 nm.
existence of local strains which are likely to be present in a-Si but should also strongly depend upon the method of preparation of the materials.
In conclusion, we have calculated the confinement effect and radiative lifetime for amorphous silicon clusters and compared it to the corresponding quantities in crystallites. We find that the blueshift of a-Si:H and c-Si clusters is comparable. The radiative lifetimes are also comparable for small clusters s,1 nmd but become two orders of magnitude larger for the larger s,2.2 nmd a-Si:H clusters than for their crystalline counterparts.
$
References
[1] L T. Canham, Appl. Phys. Lett. 57, 1046 (1990).
[2] A. Halimaoui, C. Oules, G. Bomchil, A. Bsiesy, F. Gaspard, R. Herino, M. Ligeon, and F. Muller, Appl. Phys. Lett. 59, 304 (1991).
[3] A. Bsiesy, J. C. Vial, F. Gaspard, R. Hérino, M. Ligeon, F. Muller, R. Romestain, A.Wasiela, A. Maimaoui, and G. Bomchil, Surf. Sci. 254, 195 (1991).
[4] V. Lehmann and U. Gosele, Appl. Phys. Lett. 58, 856 (1991). [5] R. A. Street, Adv. Phys. 30, 593 (1981).
[6] E. Bustarret, M. Ligeon, and L. Ortega, Solid State Commun. 83, 461 (1991).
[7] E. Bustarret, E. Sauvain, M. Ligeon, and M. Rosenbauer, Thin Solid Films E-MRS 95. [8] R. B. Wehrspohn, J.-N. Chazalviel, F. Ozanam, and I. Solomon, Phys. Rev. Lett. 77, 1885 (1996).
[9] M. J. Estes, L. R. Hirsch, S. Wichart, and G. Moddel (to be published).
[10] S. Lazarouk, S. Katsuba, N. Kazuchits, G. De Cesare, S. La Monica, G. Maiello, E.
Poverbio, and A. Ferrari, in Microcrystalline and Nanocrystalline Semiconductors, edited by L. Brus, M. Hirose, R. W. Collins, F. Koch, and C. C. Tsai, MRS Symposia Proceedings No. 358 (Materials Research Society, Pittsburgh, 1995).
[11] H. V. Nguyen, Y. Lu, S. Kim, M. Wakagi, and R. W. Collins, Phys. Rev. Lett. 74, 3880 (1995).
[12] Z. H. Lu, D. J. Lockwood, and J.-M. Baribeau, Nature (London) 378, 258 (1995); D. J. Lockwood, Z. H. Lu, and J.-M. Baribeau, Phys. Rev. Lett. 76, 539 (1996).
[13] F. Wooten, K. Winer, and D. Weaire, Phys. Rev. Lett. 54, 1392 (1985); F. Wooten and D. Weaire, Solid State Phys.40, 1 (1987).
[14] B. R. Djordjevic, M. F. Thorpe, and F. Wooten, Phys. Rev.B 52, 5685 (1995). [15] P. Vogl, H. P. Hjalmarson, and J. D. Dow, J. Phys. Chem.Solids 44, 365 (1983). [16] C. Delerue, M. Lannoo, and G. Allan, Phys. Rev. Lett. 76, 3038 (1996).
[17] DMol User Guide (Biosym Technologies, San Diego, 1993), version 2.3.5. [18] P. N. Keating, Phys. Rev. 145, 637 (1966).
[19] M. J. Estes and G. Moddel, Appl. Phys. Lett. 68, 1814 (1996).
[20] J.-P. Proot, C. Delerue, and G. Allan, Appl. Phys. Lett.61, 1948 (1992).