P R O C E E D I N G S
Open Access
Genome-wide association study for
multiple phenotype analysis
Xuan Deng
*, Biqi Wang, Virginia Fisher, Gina Peloso, Adrienne Cupples and Ching-Ti Liu
FromGenetic Analysis Workshop 20 San Diego, CA, USA. 4 - 8 March 2017
Abstract
Genome-wide association studies often collect multiple phenotypes for complex diseases. Multivariate joint analyses have higher power to detect genetic variants compared with the marginal analysis of each phenotype and are also able to identify loci with pleiotropic effects. We extend the unified score-based association test to incorporate family structure, apply different approaches to analyze multiple traits in GAW20 real samples, and compare the results. Through simulation studies, we confirm that the Type I error rate of the pedigree-based unified score association test is appropriately controlled. In marginalanalysis of triglyceride levels, we found 1 subgenome-wide significant variant on chromosome 6. Joint analyses identified several suggestive genome-wide significant signals, with the pedigree-based unified score association test yielding the greatest number of significant results.
Background
The increasing availability of high-density genomic data with thousands of samples enables the identification of single-nucleotide polymorphisms (SNPs) contributing to complex traits on a genome-wide scale. Research studies often collect data on multiple related phenotypes to bet-ter understand disease structure; however, genome-wide association studies (GWAS) commonly analyze each trait independently. For example, body mass index (BMI) and waist-to-hip ratio (WHR) are both proxy traits for obesity and commonly collected in an obesity-related study. The standard approach usually an-alyzes each phenotype separately and reports the corre-sponding findings of each analysis, ignoring the dependency among traits. Approaches considering joint analyses have been proposed to tackle multiple pheno-types. Yang and Wang [1] and Ott and Wang [2] de-scribed a number of approaches elaborately, including multivariate regression models, variable reduction methods such as principal component analysis, and ca-nonical correlation analysis. However, there is no single approach that is uniformly the most powerful across all situations. The sum of squared score (SSU) test does not
explicitly incorporate trait correlation, and multivariate analysis of variance (MANOVA) could fail to detect plei-otropy when a strong trait correlation exists and the traits have thesame direction of association [3]. Consid-ered to be an optimally weighted combination of MAN-OVA and SSU, the unified score-based association test (USAT) by Ray et al. [3] may provide higher power, es-pecially for detecting pleiotropy.
We aimed to study the performance of various ap-proaches for jointly analyzing multiple phenotypes. We first reviewed existing methods. We then expanded USAT to related samples as a pedigree-based USAT (pUSAT). We found that the Type I error rate of pUSATwas well preserved through simulations. Finally, we analyzed GAW20real data using multiple phenotype methods and compared the results.
Methods
AssumeKcorrelated phenotypes Y1,…,YK inN
individ-uals. LetYk be the N× 1 vector of kth phenotype and Y
be the N×Kmatrix for all individuals. The test of inter-est is the association of a single variant with theK phe-notypes. Suppose Gi is the genotype score (ie, count of
the minor allele as 0, 1, or 2) for a SNP of interesti, and
G is the N× 1 vector of genotypes for all individuals.
* Correspondence:[email protected]
Department of Biostatistics, School of Public Health, Boston University, 801 Massachusetts Avenue 3rd Floor, Boston, MA 02118, USA
Moreover, define C= (c1,…,cq) as the N×q matrix of a
set ofq-adjusted covariates for all samples.
Marginal linear mixed model
The linear mixed model (LMM) is frequently used to ac-count for the sample relatedness or the cryptic related-ness due to population structure. For a given SNP, the standard LMM is:
Yk¼αþGβkþCγkþQkþϵk; ð1Þ
where α refers to the overall mean ofkth phenotype, βk is the regression coefficient representing the linear fixed genetic effect on thekthphenotype, andγkis aq× 1 vec-tor of fixed covariate effects on the kth phenotype. Qk and ϵk are random effect and error, respectively, as-sumed to follow normal distributions QkNð0;Φσ2gÞ andϵkNð0;σ2
eIÞ, whereσ2g andσ2e are genetic and en-vironmental components of variance,Iis anN×N iden-tity matrix and Φ is an N×N matrix of pairwise measures of genetic relatedness.To handle multiple phe-notypes, the most intuitive and simplest approach is to implement marginal LMM to test each SNP against 1 phenotype at a time. For thekthmarginal model, the null hypothesis is that the given SNP is not associated with the kth phenotype (H0k:βk= 0). The estimation of pa-rameters can be obtained through the maximum likeli-hood estimator (MLE) or the restricted MLE (RMLE) [4], and test statistics are constructed thereafter. Because multiple tests are conducted for each SNP, a modifica-tion of local significance level should be used to control the overall Type I error, such as Bonferroni correction. The marginal LMM completely ignores the correlation among traits, possibly reducing power, especially in the case of highly correlated phenotypes.
SSU test
The results from the marginal test can be combined to simultaneously test the association of a given SNP to the multiple phenotypes. Yang and Wang [1] extended Pan’s [5] test statistic for the association between multiple rare or common variants and a single phenotype, and devel-oped the well-known approach of the SSU test. The SSU test statistic is:
wheretkis the association statistic for thek th
phenotype with a given marker from a marginal model, for ex-ample, from eq. (1). The distribution of eq. (2) can be approximated as a scaled noncentral chi-squared distri-bution aχ2dþbwith
whereck’s are the eigenvalues of the variance–covariance matrixΣoftk[6]. The SSU test is derived from marginal modelsand does not consider the correlation structure explicitly; therefore, the power is not highly affected by increasing the degree of dependency among the traits. However, the SSU test suffers from power loss with a small proportion of associated traits.
Multivariate linear mixed model
MANOVA considers the trait correlation directly in the test statistics and corresponding distributions [7]. For family data, the multivariate LMM (mvLMM) has been developed as a compelling method for testing multiple phenotypes. An mvLMM for the association ofK pheno-types and a given SNP is:
Y¼αþGβTþCγkþQþϵ
whereβ is aK× 1 vector of the SNP genetic effect sizes for theKphenotypes;γkis anq×Kmatrix of the corre-sponding coefficients for the covariates; Q is an N×K
matrix of random effects with MVN distribution Q~MVNN×K(0,Φ,Vg), where Φ is the row covariance
matrix for relatedness,Vgis theK×Kcolumn covariance matrix for the genetic variance component;ϵis anN×K
matrix of errors with ϵ~MVNN×K(0,IN × N,Ve), where
IN × Nis the row covariance matrix, andVe is the K×K column covariance matrix of the environmental variance component. The null hypothesis of interest is that the SNP effect sizes for all phenotypes are zero:H0:β1=…
=βK= 0. These parameters can be estimated through ei-ther MLE or RMLE [8]. The mvLMM typically has good performance when a few of phenotypes are associated with a SNP, but lacks power with high correlations among traits and the genetic effect sizes of the traits are similar in magnitude and in same direction.
USAT and pUSAT
The true genetic sizes and the direction of associations are usually unknown a priori and therefore one would not know which approach is the best for the study. Ray et al. [3] proposed the USAT approach, which combines-MANOVA and SSU. USAT takes the advantages of MANOVA and SSU while not requiring the prior know-ledge of true effect sizes or correlations among traits. The method was originally designed for independent samples. LetTw be the weighted statisticTw=wTM+ (1 −w)TS, where w is a weight from 0 to 1, TM is the
MANOVA test statistic, and Ts is the SSU test statistic
statistics from the analyses assuming the independence among samples. Under the null, Tw is approximately a
linear combination of chi-squared distributions and the p value pw of Tw can be calculated using Liu et al. [6].
The optimal USAT test statistic is:
TUSAT ¼ min 0≤w≤1pw
andwcan be considered from a grid of {w1= 0,w2= 0.1, …,w11= 1}.
Here, we expand their method to related samples. Spe-cifically, we define the proposed pUSAT as Tw, pUSAT= wTmvLMM+ (1−w)Ts, LMM, where TmvLMM is the
mvLMM test statistic, andTs,LMMis the SSU test
statis-tic combining the marginal LMM results. In this way, the relatedness among study participants is taken into consideration in the test statistic. Then, the optimal pUSAT test statistic is defined as:
TpUSAT ¼ min
0≤w≤1pw;pUSAT
wherepw, pUSATis thepvalue ofTw, pUSAT. An
approxi-matedp value forTpUSATusing numerical integration is [3]:
tpUSAT)th percentile of the distribution of Twb for w =
wb, FTSð∙Þ is the cumulative distribution function of
TS, LMM, δwðxÞ ¼ min
w∈fw1;…;w11g
qminðwÞ−wx
1−w and fTMð∙Þ is
the probability density function ofTmvLMM. The details of this calculation can be found in Ray et al. [3]. The pUSAT is an application-directed approach and does not require knowledge of the underlying association. Weights to mvLMM can change according to the SNP being tested.
pUSAT may be powerful in detecting pleiotropy for a large number of traits with weak correlation or a few of highly correlated phenotypes.
Phenotypic and genotypic data
GAW20 provides the dense genome-wide SNPs from the 821 pedigree-based individuals with triglyceride (TG) and high-density lipoprotein cholesterol (HDL-C) levels measured. We used the log-transformed average of pretreatment values at visits 1 and 2 of TG and HDL-Clevels and investigated the pleiotropic variants involved in blood lipids. The GAW20 data has been genotyped using the Affymetrix Genome-wide Human SNP Array 6.0. SNPs were excluded with a call rate < 95%, minor allele frequency < 5%, and failure of the Hardy-Weinberg equilibrium test (p value<10e-6), which results in a total of 587,358 variants. Individuals with more than 5% missing genotypes were also excluded from analysis.
Results
Simulation study
To evaluate Type I error rate of the proposed pUSAT approach, we conducted simulation studies consider-ing 2 correlated phenotypes. The phenotype data were simulated from the following model:
YMVN2 0;Φ;Vg
þMVN2ð0;INN;VeÞ ð3Þ
where Vg=h2B(ρ),Ve=(1−h2)Eand h2is the heritability varying from 0 to 1. For the genetic covariance matrixB(ρ) and the environmental covariance matrixE, we used acom-pound symmetry (CS) correlation structure withB(ρ)ij=Eij =ρ, where a single parameterρcan control the model and
Table 1Estimated Type I errors of pUSAT for K = 2 phenotypes (α= 0.0)
Type I error
Correlationρ
0 0.25 0.5 0.75
pUSAT 0.027 0.032 0.036 0.038
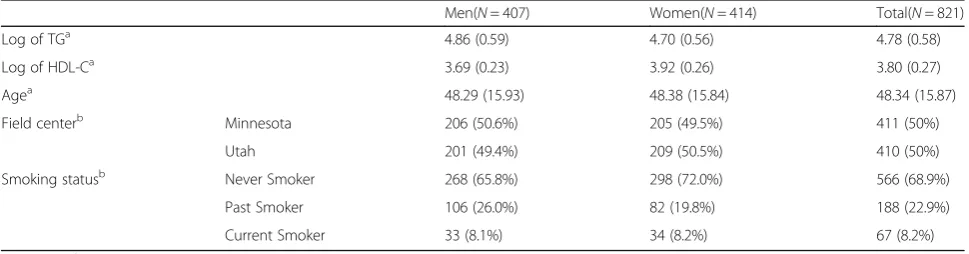
Table 2Descriptive statistics of variables in the analysis
Men(N= 407) Women(N= 414) Total(N= 821)
Log of TGa 4.86 (0.59) 4.70 (0.56) 4.78 (0.58)
Log of HDL-Ca 3.69 (0.23) 3.92 (0.26) 3.80 (0.27)
Agea 48.29 (15.93) 48.38 (15.84) 48.34 (15.87)
Field centerb Minnesota 206 (50.6%) 205 (49.5%) 411 (50%)
Utah 201 (49.4%) 209 (50.5%) 410 (50%)
Smoking statusb Never Smoker 268 (65.8%) 298 (72.0%) 566 (68.9%)
Past Smoker 106 (26.0%) 82 (19.8%) 188 (22.9%)
Current Smoker 33 (8.1%) 34 (8.2%) 67 (8.2%)
a
define the correlation among the phenotypes. We used the kinship matrix Φ ofGAW20 data and considered h2 as 0.5%. The different correlationρ ‘s (ρ= 0, 0.25, 0.5, 0.75) were assessed in the simulation. We evaluated the Type I error rate using 1000 null phenotype data setssimulated from eq. (3) and variants on chromosome 21 fromGAW20 individuals, with minor allele frequencyvarying from 0.052 to 0.500. TheType I error rate is well controlled for the pUSAT approach (Table1) although slightly conservative.
Real data analysis
The Pearson correlation coefficient, ignoring the family structure, between TG and HDL-Clevels (on log-scale) in
the data set, is −0.45. The empirical genetic relatedness matrix was calculated before conducting analyses. Besides SSU, mvLMM, USAT, and pUSAT, the univariate analyses were also performed and shown. All statistical models were adjusted for age, sex, indicators of field center, and smoking status, and implemented in GEMMA (genome-wide effi-cient mixed-model analysis) [4,8]. Table2lists the descrip-tive statistics for the variables used in the model.
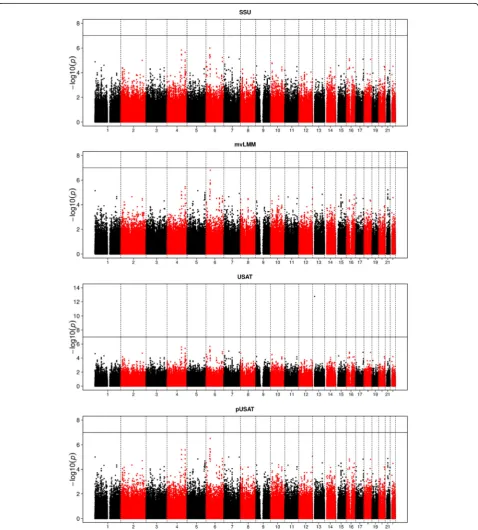
Figure 1 shows the Manhattan plots for the univariate analysis using marginal LMM. The horizontal line indicates the subgenome-wide significance level (pvalue = 1 × 10⁻⁷). We observed no genome-wide significant SNPs for either phenotype; however, we did identify1 subgenome-wide
Fig. 1Manhattan plots of the univariateanalyses (TG and HDL-C) for chromosomes 1 to 22. The black horizontal line indicated the subgenome-wide significance threshold (pvalue = 1 × 10⁻⁷)
Table 3SNPs that are suggestive as being of genome-wide significance (p< 5 × 10⁻⁶) in univariate and joint analysis*
SNP Chr:Pos Univariate analysis (LMM) Joint analysis
TG HDL-C SSU mvLMM USAT pUSAT
rs90513 1:3189344 3.33E-02 1.20E-06 1.30E-05 7.18E-06 2.36E-05 9.88E-06
rs11940232 4:138953336 6.32E-05 1.98E-05 1.47E-06 8.56E-06 2.65E-06 2.58E-06
rs17058802 4:173880215 5.66E-07 4.56E-03 2.23E-06 3.39E-06 4.13E-06 2.60E-06
rs708010 6:37071350 1.86E-04 4.69E-06 1.01E-06 5.48E-06 2.19E-06 2.12E-06
rs17619780 6:40472303 7.58E-08 2.22E-01 4.95E-06 1.59E-07 9.60E-06 3.01E-07
rs12533593 7:147451966 6.69E-03 2.28E-06 7.72E-06 1.22E-05 1.48E-05 1.01E-05
rs7300117 12:130266575 2.24E-05 8.66E-01 5.60E-04 3.92E-06 9.99E-04 8.58E-06
rs2880301 13:18998534 9.66E-01 7.29E-02 1.95E-01 1.19E-01 1.69E-13 2.22E-01
rs17464499 22:26221715 3.20E-02 4.48E-06 3.02E-05 2.67E-05 6.30E-05 3.29E-05
significant locus on chromosome 6 (rs17619780 with ap valueof 7.2 × 10⁻⁸in geneLRFN2) as associated with TG levels. LRFN2is related to TGs in the suggestive genome-wide significance level (p< 5 × 10⁻⁶) [9]; however, more exploration of this gene is needed. Interestingly, the heterozygous deletion of the LRFN2 is reported to be
associated with working memory deficits [10], a well-known complication of high TG levels. Furthermore, both USAT and pUSAT performed similarly (Table 3) ex-cept one genome-wide association (GWA)-significant vari-ant, rs2880301, identified by the regular USAT. The reportedpvalue of 1.69 × 10⁻¹³from USAT is suspicious
as no other approach (neither univariate nor joint analysis) reports even nominal significance signal. In addition, USAT analysis ignored the dependency among the individuals, which could potentially lead to the inflated signals. In addition, we did not identify any signals that reached GWAsignificance by another multivariate approach (SSU, mvLMM, or pUSAT), as shown in Fig.2. Some suggestive genome-wide significant signals were detected on chromosomes 4, 6, and 12. Most of the identi-fied SNPs in Fig.2are in linkage disequilibrium, therefore, we kept 1SNP with the smallestpvalue as representative within ± 500 kb (Table 3). From Table3, we found that the joint analysis is able to identify most variants that were significant in either marginal analysis and also catches 1 variant (rs7300117) missed in the univariate analysis, emphasizing the importance of multivariate joint analyses. pUSAT provides comparable results with slightly smaller p values by integrating information from SSU and mvLMM. Closer investigation shows that some SNPs are outstandingly noticeable for pUSAT, but not for SSUormvLMM, especially on chromosomes 2,3,4, and 6.
Discussion and conclusions
The explosion in datacollection and the increasing evidence that some loci affect multiple traits require more complex statistical models for analyses to better under-stand the properties of association. Here, we reviewed several different methods for multiple phenotypes in GWAS, and expanded the USAT approach to related sam-ples as pUSAT. The proposed method can provide insight into the underlying associations, and help the researchers to identify pleiotropic loci especially when prior informa-tion is unavailable. The simulainforma-tion studies demonstrate that the Type I error rate of pUSAT is conservative under different correlations. We also applied various methods to the GAW20 data with TG and HDL-C as the phenotypes. One suspicious locus was identified as GWA-significant by the regular USAT, which assumes independent individ-uals, whereas other multivariate analyses missed this locus. Several suggestiveGWA loci were detected by the joint multivariate analyses; however, pUSAT highlights the importance of joint analysis for multiple phenotypes and yields smallerpvalues for most SNPs.
Funding
Publication of this article was supported by NIH R01 GM031575.
Availability of data and materials
The data that support the findings of this study are available from the Genetic Analysis Workshop (GAW), but restrictions apply to the availability of these data, which were used under license for the current study. Qualified researchers may request these data directly from GAW.
About this supplement
This article has been published as part of BMC Proceedings Volume 12 Supplement 9, 2018: Genetic Analysis Workshop 20: envisioning the future of statistical genetics by exploring methods for epigenetic and
pharmacogenomic data. The full contents of the supplement are available online at https://bmcproc.biomedcentral.com/articles/supplements/volume-12-supplement-9.
Authors’contributions
All authors contributed to the overall study. XD, BW and VF conducted all analyses and XD drafted the manuscript. GMP, LAC and CTL provided constructive advice and revised the manuscript critically. All authors approved the final manuscript.
Ethics approval and consent to participate
Not applicable.
Consent for publication
Not applicable.
Competing interests
The authors declare that they have no competing interests.
Publisher’s Note
Springer Nature remains neutral with regard to jurisdictional claims in published maps and institutional affiliations.
Published: 17 September 2018
References
1. Yang Q, Wang Y. Methods for analyzing multivariate phenotypes in genetic association studies. J Probab Stat. 2012;2012:652569.
2. Ott J, Wang J. Multiple phenotypes in genome-wide genetic mapping studies. Protein Cell. 2011;2(7):519–22.
3. Ray D, Pankow JS, Basu S. USAT: a unified score-based association test for multiple phenotype-genotype analysis. Genet Epidemiol. 2016;40:15. 4. Zhou X, Stephens M. Genome-wide efficient mixed-model analysis for
association studies. Nat Genet. 2012;44:5.
5. Pan W. Asymptotic tests of association with multiple SNPs in linkage disequilibrium. Genet Epidemiol. 2009;33:11.
6. Liu H, Tang Y, Zhang HH. A new chi-square approximation to the distribution of non-negative definite quadratic forms in non-central normal variables. Comput Stat Data Anal. 2009;53:4.
7. Muller KE, Peterson BL. Practical methods for computing power in testing the multivariate general linear hypothesis. Comput Stat Data Anal. 1984;2(2):143–58. 8. Zhou X, Stephens M. Efficient multivariate linear mixed model algorithms
for genome-wide association studies. Nat Methods. 2014;11(4):407–9. 9. Comuzzie AG, Cole SA, Laston SL, Voruganti VS, Haack K, Gibbs RA, Butte
NF. Novel genetic loci identified for the pathophysiology of childhood obesity in the Hispanic population. PLoS One. 2012;7:e51954.