P R O C E E D I N G S
Open Access
Treating phenotype as given: a simple
resampling method for genome-wide association
studies
Kai Wang
1*
, Jian Huang
1,2
From
Genetic Analysis Workshop 17
Boston, MA, USA. 13-16 October 2010
Abstract
Significance of genetic association to a marker has been traditionally evaluated through statistics that are
standardized such that their null distributions conform to some known ones. Distributional assumptions are often
required in this standardization procedure. Based on the observation that the phenotype remains the same
regardless of the marker being investigated, we propose a simple statistic that does not need such standardization.
We propose a resampling procedure to assess this statistic
’
s genome-wide significance. This method has been
applied to replicate 2 of the Genetic Analysis Workshop 17 simulated data on unrelated individuals in an attempt
to map phenotype Q2. However, none of the selected SNPs are in genes that are disease-causing. This may be
due to the weak effect that each genetic factor has on Q2.
Background
The traditional approach to hypothesis testing is to
con-struct a test statistic whose exact or approximate
distri-bution under the null hypothesis is known. Alternative
methods for assessing significance of a test statistic
include resampling techniques, such as the bootstrap and
permutation. These methods dominate modern genetic
association studies.
Statistics used in these methods typically make use
of a standardization factor, for instance, the standard error
of the observed genetic effect size. Different model
assump-tions result in different standardization factors. For
instance, in a case-control genetic association study, we are
interested in testing whether the difference in the
fre-quency of a reference allele between case subjects and
con-trol subjects is 0. The popular allelic test and the
Cochran-Armitage test for trend are based on two different
esti-mates of the variance of this difference. The estimate for
the allelic test requires Hardy-Weinberg equilibrium in the
combined case-control population, whereas the estimate
for the Cochran-Armitage test does not. The properties of
these two tests are rather different [1].
It is a brilliant idea to construct a test statistic through
standardization. It makes it possible to assess the
signifi-cance of the observed effect size with respect to a
refer-ence distribution. However, in genome-wide association
studies there are typically tens of thousands of markers.
Presumably most of these markers are under the null
hypothesis (i.e., they are not associated). The presence of
these null markers provides a natural reference
distribu-tion. Standardizing the effect size in this setting appears to
be unnecessary and awkward.
We propose a novel resampling approach that aims to
directly assess the significance of genetic effect size. The
null distribution generated from this method is for a
ran-domly selected single-nucleotide polymorphism (SNP).
Hence it naturally addresses the genome-wide significance
of genetic effect size at a SNP and obviates the issue of
multiple testing. To define the genetic effect size, we
observe that the phenotype remains the same in a genome
scan. Only the testing locations are different. This
observa-tion leads to a simple representaobserva-tion of the genetic effect
size. This approach is demonstrated by means of a
gen-ome-wide association study on phenotype Q2 in replicate
* Correspondence: [email protected]
1
Department of Biostatistics, University of Iowa, Iowa City, IA 52242, USA
Full list of author information is available at the end of the article
2 of the Genetic Analysis Workshop 17 (GAW17)
simu-lated data on unresimu-lated subjects.
Methods
Let
n
denote the number of individuals in a study. Let
y
idenote the measure of a quantitative phenotype
y
on
individual
i
. The score of the genotype at a SNP is
denoted by
g
. Assuming that the two alleles of the SNP
are denoted by A and B, we set
g
= 0 for genotype AA,
g
= 1 for genotype AB, and
g
= 2 for genotype BB. The
genotype score on individual
i
is denoted by
g
i.
To identify SNPs associated with phenotype
y
, we
con-sider a regression in which the response variable is the
genotype score
g
and the independent variable is the
phe-notype
y
. The (partial) regression sum of squares for
g
equals:
(
)(
)
(
)
,
y
y
g
g
y
y
i
i
i
i
i
−
−
⎡
⎣
⎢
⎢
⎤
⎦
⎥
⎥
−
∑
∑
2
2
(1)
where
g
and
y
are the sample means of
g
iand
y
i,
respectively. Because the denominator in expression (1)
remains constant in a genome scan, a natural measure
of association would be:
(
y
i
y
)(
g
i
g
)
.
i
−
−
⎡
⎣
⎢
⎢
⎤
⎦
⎥
⎥
∑
2
(2)
Note that in a case-control study
(
y
iy
)(
g
ig
)
i
−
−
∑
is
proportional to the difference in the frequency of allele
B between case subjects and control subjects. If there
are
p
covariates
x
j,
j
= 1,
…
,
p
, then phenotype
y
iis
replaced by the residual
y
i
*
from the following linear
regression:
E y
i
j ij
x
j
p
( )
=
+
,
=
∑
a
0
a
1
(3)
where
x
ijis the value of
x
jfor individual
i
. Similarly,
genotype
g
is replaced by the residual
g
* of the
regres-sion of
g
over
x
j,
j
= 1,
…
,
p
.
We use the statistic:
S
y g
n
i
i
i
:
* *
*
=
⎡
⎣
⎢
⎢
⎤
⎦
⎥
⎥
∑
2
(4)
to measure the strength of association, where
n
* is the
number of subjects whose genotype is nonmissing at
the SNP being investigated. The sample mean of
{ ,
y i
*
i
=
1
,
, }
n
is 0, so it is dropped from the definition
of
S
. So is the sample mean of
{ ,
g i
*
i
=
1
,
, }
n
. The
pur-pose of using
n
* is to make the statistic
S
on the same
scale because
n
* is expected to vary across the genome.
In comparison, the usual method for detecting
asso-ciation would consider the following regression:
E y
( )
i
*
=
b
1
g
*
i
.
(5)
The least-squares estimate of
b
1, denoted
b
ˆ
1
, is:
ˆ
(
)
.
* *
*
b
1
2
=
∑
∑
y g
g
i
i
i
i
i
(6)
The statistic for testing for association is:
T
:
(
)
,
=
b
b
1
1
SE
(7)
where
SE(
b
1
)
is the standard error of
b
ˆ
1
. This
pro-cedure is equivalent to testing whether the coefficient of
g
is 0 in a multiple linear regression that includes
x
i,
…
,
x
pas covariates and
y
as the response. Because the total
sum of squares for
{ ,
y i
*
i
=
1
,
, }
n
is fixed in a genome
scan, there is a monotonic relationship between the
regression sum of squares for Eq. (5) and the statistic
T
.
We propose the following resampling procedure to
evaluate the genome-wide significance of
S
: (1) Compute
residuals
{ ,
y i
*
i
=
1
,
, }
n
and residuals
{ ,
g i
*
i
=
1
,
, }
n
from regression (3). (2) Randomly select a SNP from a
set of SNPs that are under the null hypothesis. This null
set can be determined by using a histogram of
p
-value
[2]. (3) Permute residuals
{ ,
g i
*
i
=
1
,
, }
n
(or,
equiva-lently, permute residuals
{ ,
y i
*
i
=
1
,
, }
n
). (4) Compute
the statistic
S
for the randomly selected marker. (5)
Repeat steps 2
–
4 the desired number of times, say
K
.
(6) Let
S
(k)denote the value of statistic
S
in the
k
th
iteration. Suppose that the value of statistic
S
is
s
for the
observed data. Its
p
-value is computed as:
K
I S
k
s
k
K
−
=
≥
∑
1
1
(
( )
),
(8)
where
I
(·) is the indicator function satisfying
I
(True) =
1 and
I
(False) = 0.
Because the SNP selected in each iteration is random,
the significance obtained in this way is genome-wide.
Results
same way. Genome-wide
p
-values from the
t
-distribu-tion with 1 degree of freedom for statistic
T
are
pre-sented in Figure 1. There are 19 SNPs with a
p
-value
less than 5 × 10
−4(Table 1).
The reference distribution for statistic
S
is obtained in
the way described in the previous section. The value of
K
is set at 10,000,000. The histogram of
p
-values for
parameter
b
1in regression (5) shows no apparent
devia-tion from uniform distribudevia-tion (data not shown). Thus
all SNPs are used to determine the reference
distribu-tion for statistic
S
.
P
-values obtained from the
resam-pling procedure are presented in Figure 2. Eighteen
SNPs have a
p
-value that is less than 5 × 10
−4. None of
these SNPs are close to the 19 SNPs that have
p
-values
less than 5 × 10
−4for statistic
T
, except for C20S2223
on chromosome 20 (base-pair position 61666107;
p
=
2.59 × 10
−5for statistic
T
; resampling
p
= 6.27 × 10
−2for statistic
S
). C20S2223 is located in gene
PRIC285
identified by statistic
S
.
Discussion and conclusions
Significance of genetic association at a SNP has been
tra-ditionally evaluated through a standardized test statistic
such that its significance can be evaluated through a
known distribution. For instance, in Eq. (7) the standard
error of
b
ˆ
1
serves as a standardization factor. Its
p
-value
is assessed through a
t
-distribution or a standard normal
distribution. This strategy works beautifully in general
but is awkward in the context of genome-wide
associa-tion studies. The presence of abundant unassociated
SNPs provides a natural reference distribution that is
pertinent to the data. We have proposed a simple statistic
S
and a resampling method for generating its reference
distribution. Although a distributional assumption is
necessary to compute the standard error of
b
ˆ
1
, it is not
required in our method. More important, the resampling
procedure has a built-in mechanism for handling
gen-ome-wide significance because the reference distribution
is the distribution of an arbitrary SNP under the null
hypothesis that there is no association. Application to the
GAW17 simulated data on unrelated individuals
(repli-cate 2) revealed several susceptible genes for phenotype
Q2 that can be used as candidates for further
investigation.
The essence of the proposed method is the existence
of a large number of similar features
—
SNPs in the
cur-rent context. The basic principle is applicable to other
situations that involve a large amount of similar
fea-tures, for instance, gene expression levels in gene
expression studies.
We have focused on a continuous trait. As alluded to
earlier, for a dichotomous trait, if there are no
covari-ates, then the statistic
S
can be defined as the difference
in frequency of the reference allele between the two
phenotype groups. More generally, one can use a
pro-portional odds model with genotype as the response and
phenotype as the predictor. A proportional odds model
is appealing for dealing with covariates and both
contin-uous and dichotomous traits. We are actively
investigat-ing this possibility.
The proposed method is resampling based and
requires intensive resampling. However, computation
for each sample is fast. The overall computation time
for
K
= 10,000,000 resampling iterations took less than
two days on a computer running the Windows Vista
operating system. The iteration coverage is about 408
Chromosome
−
log
10
Table 1 Selected SNPs based on
p-values of statistic
T
(p
< 5 × 10
−4)
p
-value
Chromosome
Gene
SNP
Minor allele frequency
Base-pair position
Statistic
T
Statistic
S
1
NEK7
C1S8842
0.001435
196488886
3.55 × 10
−41.53 × 10
−1Chromosome
−
log
10
Figure 2
Genome-wide plot of resampling
p
-values for the proposed statistic
S.
The horizontal line corresponds to
p
= 5 × 10
−4.
Table 2 Selected SNPs based on resampling
p
-values of statistic
S
(
p
< 5 × 10
−4)
p
-value
Chromosome
Gene
SNP
Minor allele frequency
Base-pair position
Statistic
T
Statistic
S
per SNP (
≈
K
/24,487 SNPs). We have also used
K
=
100,000; the simulated
p
-value remains almost the
same. The resampling procedure needs to be done only
once, regardless of the number of SNPs.
We are investigating the utility of our approach in
other association study settings, such as gene-gene
inter-action and population stratification.
We had no knowledge of the GAW17 disease-generating
model when this analysis was conducted. It turns out that
none of the genes in Table 1 and Table 2 are disease
caus-ing. This may be due to the weak effect that each genetic
factor has on Q2.
Acknowledgments
KW
’
s research is partly funded by the National Institute for Environmental
Health Sciences (National Institutes of Health) (NIEHS/NIH) grant P30
ES05605 through the University of Iowa Environmental Health Sciences
Research Center. JH
’
s work is partly supported by NIH grant R01 CA120988
and National Science Foundation (NSF) grant DMS 0805670. We would like
to thank the two anonymous referees for their helpful comments and
suggestions.
This article has been published as part of
BMC Proceedings
Volume 5
Supplement 9, 2011: Genetic Analysis Workshop 17. The full contents of the
supplement are available online at
http://www.biomedcentral.com/1753-6561/5?issue=S9.
Author details
1
Department of Biostatistics, University of Iowa, Iowa City, IA 52242, USA.
2Department of Statistics and Actuarial Sciences, University of Iowa, Iowa
City, IA 52242, USA.
Authors
’
contributions
KW conceived of the study and participated in its design and coordination
and helped to draft the manuscript. JH helped to draft the manuscript. All
authors read and approved the final manuscript.
Competing interests
The authors declare that there are no competing interests.
Published: 29 November 2011
References
1.
Sasieni PD:
From genotypes to genes: doubling the sample size.
Biometrics
1997,
53
:1253-1261.
2.
Storey JD, Tibshirani R:
Statistical significance for genomewide studies.
Proc Natl Acad Sci USA
2003,
100
:9440-9445.
doi:10.1186/1753-6561-5-S9-S60
Cite this article as:
Wang and Huang:
Treating phenotype as given: a
simple resampling method for genome-wide association studies.
BMC
Proceedings
2011
5(Suppl 9):S60.
Submit your next manuscript to BioMed Central
and take full advantage of:
•
Convenient online submission
•
Thorough peer review
•
No space constraints or color figure charges
•
Immediate publication on acceptance
•
Inclusion in PubMed, CAS, Scopus and Google Scholar
•
Research which is freely available for redistribution
Submit your manuscript at www.biomedcentral.com/submit
Table 2 Selected SNPs based on resampling
p-values of statistic
S
(p
< 5 × 10
−4)
(Continued)
GALNTL4
C11S1338
0.43
11310922
3.25 × 10
−32.04 × 10
−4SYTL2
C11S4881
0.38
85113378
2.36 × 10
−31.87 × 10
−4C11S4893
0.31
85114042
5.41 × 10
−33.70 × 10
−4C11S4949
0.48
85134351
6.79 × 10
−32.66 × 10
−4LOC100128794
C11S5677
0.30
107889417
8.72 × 10
−34.65 × 10
−412
OR6C76
C12S3054
0.26
54106388
4.77 × 10
−34.37 × 10
−417
RHOT1
C17S1743
0.35
27558083
6.77 × 10
−32.81 × 10
−4SLFN13
C17S1964
0.42
30792467
9.33 × 10
−32.33 × 10
−4PIP4K2B
C17S2376
0.40
34180257
7.62 × 10
−33.55 × 10
−4CDC27
C17S3299
0.46
42589359
2.68 × 10
−32.58 × 10
−419
PSG3
C19S4193
0.34
47935058
1.73 × 10
−24.00 × 10
−4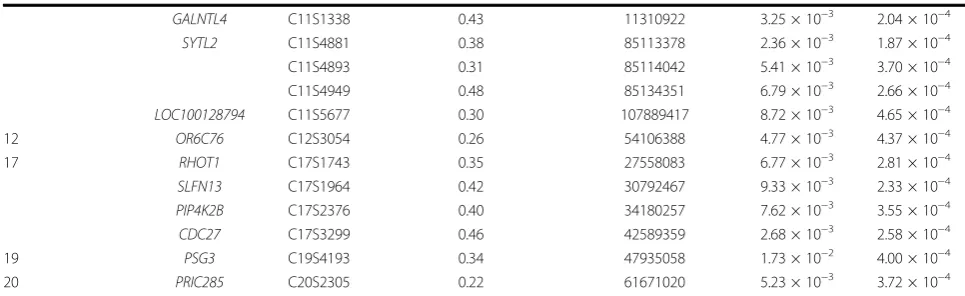
![Fourteenth annual management report 1982 [Office for Official Publications]](data:image/gif;base64,R0lGODlhAQABAIAAAP///wAAACH5BAEAAAAALAAAAAABAAEAAAICRAEAOw==)