Funnel Risk Graph Method in the
Design of Integrated Control and
Safety System
Submitted in fulfilment of the requirements of the degree of
Doctor of Philosophy
(Electrical and Electronic Engineering)
College of Engineering and Science
Angelito ‘Allan’ Gabriel
MBA(Hons), BS(CompEng), BS(MechEng), FIEAust 3244705, CPEng, NPER, RPEQ, TUV FSEng 5125/12, IEEE Member
2
©Copyright by Angelito Gabriel
3
To my beloved wife
ANNIE
, my princeCHARLES
and my parents4
Abstract
With the emergence of oil and gas industries such as the LNG industry in
Australia, e.g., the Chevron’s US$54B Gorgon and Wheatstone projects, Inpex’s
US$34B Ichthys, Shell’s US$12.6B Prelude FLNG, Origin’s $24.7B APLNG’s
projects, to name a few, and other related industries, it is inevitable that these
industries need to utilise risk analysis techniques during the development and
application of their Safety Instrumented System (SIS), in order to efficiently and
safely conduct its business, and for industry compliance. Currently, evaluation
and design of integrated control and safety systems (ICSS), particularly the SIS
are often cumbersome, time consuming and complex considering a lot of
Standards and Regulations to follow. These systems are mission and
safety-critical systems such that the development and execution must be carefully
planned and traceable to certain Standards and Regulations but needs to be
cost-efficient.
To address this impending concern, this research project will focus on the
development of an application of a more cost-effective, simplified and enhanced
approach for the design and evaluation of Safety Instrumented Systems (SIS)
called the Funnel Risk Graph Method (FRGM). Although risk graph methods are
commonly used in industries, the FRGM is unique in a way that the approach is
presented as a screening tool or initial pass, before a more detailed analysis is
one-by-5
one to a much complex traditional assessment process, the FRGM is used as a
funnel. If the assessed safety-related system received Safety Integrity Level (SIL)
allocation of greater than SIL 2 during the initial pass then a semi-quantitative or
a quantitative method as a ‘final pass’ should be conducted, or the
multi-disciplinary assessment team reached an agreement to justify the ‘second pass’
or pose a high Equipment Under Control (EUC) risk. Based on the preliminary
results, it is expected that significant economic benefits can be achieved.
Likewise, compliance will become more practicable and standards more useful,
resulting to an equal degree of functional safety as compared to the traditional
approach yet resource utilisation is efficient.
Further testing and analyses will be conducted to quantify the benefits of
FRGM. Real-life case studies utilizing industrial SIS devices will be presented to
demonstrate the benefits of this approach. In contrast with other complex
schemes commonly used for safety assessment, the proposed FRGM gives
benefits such that it is straightforward in steps and resource-efficient. While safety
is aimed at protecting the systems from accidental failures to eliminate or
minimize hazards, security is focused on protecting the systems from deliberate
malicious attacks. They share the same goal – protecting the SIS from failing.
Industry cybersecurity has become more critical these days, and to address such
concern, risk assessment for the cybersecurity of SIS is proposed to be integrated
in the assessment process using a proposed framework, as part of the enhanced
6
Declaration
“I, Angelito Gabriel, declare that the PhD thesis entitled ‘Funnel Risk Graph
Method in the Design of Integrated Control and Safety System’ is no more than
100,000 words in length including quotes and exclusive of tables, figures,
appendices, bibliography, references and footnotes. This thesis contains no
material that has been submitted previously, in whole or in part, for the award of
any other academic degree or diploma. Except where otherwise indicated, this
thesis is my own work”
14 February 2018
7
Acknowledgements
My first, and most earnest, acknowledgement in my doctoral studies must
go to my respected supervisors, Associate Professor Dr. Juan Shi and Dr. Cagil
Ozansoy for countless discussions, invaluable guidance and support, and for
encouraging me throughout my doctoral studies. I am indebted to these two lovely
persons for their advice and directions which has enabled me not only to
complete this research but also to become a better researcher. I would also like
to sincerely thank Professor Akhtar Kalam, Dr. Horace King and Professor Aladin
Zayegh for their constructive guidance and supports during this journey. I would
like to thank Ms. Elizabeth Smith for her continuous assistance and guidance
throughout my studies.
I would also like to thank the staff of Graduate Research Office specially Ms.
Nadia Itaywi for processing my applications. I would also like to express my
sincere gratitude to the entire members of staff of the College of Engineering and
Science, Victoria University and all those who provided me with the needed
8
Published papers during the
author’s candidature
All of the research results reported in this thesis have been published as
academic articles in referred journals or have been submitted as academic
papers to referred journals. A list of published papers are:
Published Journal Papers
1) A. Gabriel, "Design and Evaluation of Safety Instrumented Systems: A
Simplified and Enhanced Approach," in IEEE Access, vol. 5, pp. 3813-3823,
2017. doi: 10.1109/ACCESS.2017.2679023.
2) A. Gabriel, J. Shi and C. Ozansoy, "A Proposed Alignment of the National
Institute of Standards and Technology Framework with the Funnel Risk Graph
Method," in IEEE Access, vol. 5, pp. 12103-12113, 2017.
9
3) A. Gabriel, J. Shi, C. Ozansoy, “Developments in SIL Determination and
Calculation,” in Elsevier, Reliability Engineering and System Safety, vol. 177.
pp. 148-161, September 2018. doi: 10.1016/j.ress.2018.04.028
The contents of some of the chapters have been adopted from the published
papers. The detailed list of the included papers in each chapter is given in the
table below.
Chapter No.
Publication Title Publication Details Publication Status 2 Developments in SIL
Determination and Calculation
Elsevier Journal of Reliability Engineering and System Safety
Available in the Elsevier Journal of Reliability
Engineering and System Safety 3 Design and Evaluation
of Safety Instrumented Systems: A Simplified and Enhanced Approach
IEEE Access Available in
IEEEXplore
5 A Proposed Alignment of the National
Institute of Standards and Technology Framework with the Funnel Risk Graph Method
IEEE Access Available in
10
List of Abbreviations
AC BBN BoD BOP BPCS CCF CIUM COUM CPT CTMC CSMS Architectural Constraints
Bayesian Belief Networks
Basis of Design
Blowout Preventer
Basic Process Control System
Common Cause Failure
Control Input Unit Module
Control Output Unit Module
Conditional Probability Tables
Continuous Time Markov Chains
Cybersecurity Management System
C&E
DBN
Cause & Effect Diagram
Dynamic Bayesian Network
DD
DDMR
Dangerous Detected
Double Dual Modular Redundancy
DP
DTS
Differential Pressure
De-energized to Safe
11 DVC EA EMA ETS FACT FBN
Digital Valve Controller
Event Assessment
Enhanced Markov Analysis
Energized to Safe
Failure-Attack-CounTermeasure
Fuzzy Bayesian Network
FE Final Element
FEED Front End Engineering Design
FER Field Equipment Room
FGS Fire and Gas System
FMEDA
FRGM
Failure Mode, Effects, and Diagnostic Analysis
Funnel Risk Graph Method
FSMP FTA FFTA GDM GPFDF HAZOP HARA
Functional Safety Management Plan
Fault Tree Analysis
Fuzzy Fault Tree Analysis
General Dependency Model
Generalised PFD Formula
Hazard and Operability
12 HIPS HRM HMI ICS ICSS
High Integrity Protective System
Hybrid Relation Model
Human Machine Interface
Industrial Control System
Integrated Control and Safety System
IS
ISA
Intrinsically Safe
International Society of Automation
IEC International Electrotechnical Commission
IPL
KooN
Independent Protection Layer
K-out-of-N architecture
LNG
LOPA
Liquefied Natural Gas
Layers of Protection Analysis
LVCB MA MC MCS MDBN MF
Low Voltage Circuit Breaker
Markov Analysis
Maintenance Capability
Monte Carlo Simulation
Multiphase Dynamic Bayesian Network
Membership Functions
13 MOS
MRST
MT
Maintenance Override Switch
Minimum Resource Spanning Trees
Mission Time
MTTFS Mean Time to Failure Safe
MTTR
MTSR
MUnT
NEC
NIST
NSSR
NR
Mean Time to Repair
Mean Time to System Restoration
Mean Unavailable Time
Network Enabled Capability
National Institute of Standards and Technology
No Standard Safety Requirement
Not Recommended
O&M Operations and Maintenance
PCS Process Control System
P&ID Piping and Instrumentation Diagram
PFD Probability of Failure on Demand
14 PHA PL PLC PRA PROBIST PSA PST
Process Hazard Analysis
Protection Layer
Programmable Logic Controllers
Probabilistic Risk Assessment
Probability Binary State
Process Safety Analysis
Partial Stroke Testing
PTC Proof Test Coverage
PTI Proof Test Interval
PV Process Variable
PVST
RBD
Partial Valve Stroke Test
Reliability Block Diagram
RRF
SD
SCP
Risk Reduction Factor
Safe Detected
Screw Pluggable
SERH Safety Equipment Reliability Handbook
SFF Safe Failure Fraction – Ratio of the (total safe failure
rate of a subsystem plus the dangerous detected
failure rate of the subsystem) to the total failure rate
15
SIF Safety Instrumented Function
SIL
SILver
Safety Integrity Level
SIL Verification
SIS
SM
Safety Instrumented System
Switching Markov
SME Subject Matter Expert
SOA
SoS
Safety Objective Analysis
System of Systems
SOV SPP SU Solenoid Valve Spring Pluggable Safe Undetected
ST Spurious Trip: A failure of an SIS related system or
component resulting in an unwarranted process
shutdown.
SRS Safety Requirements Specification
SSDVR SIF SIL Design Verification Report
TMR
TSO
Triple Modular Redundancy
Tight Shutoff
16
List of Symbols
3σ criterion Triangular Fuzzy Number
A ̃ Fuzzy Number
Α( ) Left-end-point of the fuzzy interval
Α( ) Right-end-point of the fuzzy interval
B10 Cycles in usable life (failure rate value)
β Common Cause Failure Fraction
βD Detected common cause failure fraction
C Consequence
E Extensive
f Frequency
λS Transition rate to safe state
λde Demand rate
λSD Safe detected failure rate
λSU Safe undetected failure rate
λDD Dangerous detected failure rate
λDU Dangerous undetected failure rate
λD(=λDU+λDD) Dangerous failure rate
µDD DD- repair rate
17
μ~( ) Membership Function of Fuzzy Number
µS Restoration rate
µde Demand duration rate
m Renewal rate
M Minor
N Number of Total Time Slices
P Probability
R Risk
S Serious
V Vulnerability factor
18
Table of Contents
ABSTRACT ... 4
DECLARATION ... 6
ACKNOWLEDGEMENTS ... 7
PUBLISHED/SUBMITTED PAPERS DURING THE AUTHOR’S CANDIDATURE ... 8
JOURNAL PAPERS ... 8
LIST OF ABBREVIATIONS ... 10
LIST OF SYMBOLS ... 16
LIST OF FIGURES ... 23
LIST OF TABLES ... 28
CHAPTER 1 - INTRODUCTION ... 32
MOTIVATION AND BACKGROUND ... 33
OBJECTIVE AND SCOPE OF THE THESIS ... 35
1.2.1 General Objective ... 35
Specific Objectives: ... 37
MAIN CONTRIBUTIONS TO KNOWLEDGE ... 38
ORGANISATION OF THE THESIS ... 41
CHAPTER 2 - DEVELOPMENTS IN SIL DETERMINATION AND CALCULATION ... 43
2.1 INTRODUCTION ... 43
2.2 SIL APPROACHES ... 48
19
2.4 BAYESIAN NETWORKS (BNS) AND DYNAMIC BAYESIAN NETWORKS (DBNS) ... 71
2.5 TECHNIQUES IN SIL CALCULATION ... 81
2.6 SUMMARY AND REVIEW OF DIFFERENT SELECTED TARGET SIL DETERMINATION AND CALCULATION METHOD ... 94
2.6.1 Evaluation of target SIL determination methods ... 94
2.6.2 Evaluation of SIL calculation methods ... 100
2.7 DISCUSSION AND CONCLUSION ... 102
CHAPTER 3 - DEVELOPMENT OF THE FUNNEL RISK GRAPH METHOD (FRGM) ... 104
3.1 INTRODUCTION ... 104
3.2 SAFETY LIFECYCLE AND THE FRGM ... 107
3.3 THE EQUIVALENCE OF SIL AND PL ... 109
3.4 THE EQUIVALENCE OF SIL AND CAT ... 110
3.5 CALIBRATION OF THE FRGM ... 112
3.6 APPLICATION OF FRGM TO CASE STUDY INVOLVING 3 SIFS ... 115
3.6.1 SIF#1 (A100), SIF#2 (M100) and SIF#3 (A200) analyses ... 116
3.6.2 Application of LOPA to case study involving 3 SIFs ... 125
3.7 COMPARISON BETWEEN FRGM AND LOPA (AND OTHER TRADITIONAL METHODS) . 130 3.8 CONCLUSION ... 133
CHAPTER 4 - QUANTITATIVE ANALYSES: SIF SIL DESIGN CALCULATIONS & VERIFICATIONS ... 135
4.1 INTRODUCTION ... 135
4.2 SCOPE – PROCESS UNIT 6400 ... 137
4.3 ANALYSIS OF SIL CALCULATIONS/VERIFICATIONS ... 138
20
4.4.1 064FZ-0567 LL ... 142
4.4.2 064FZ-0568 LL ... 142
4.4.3 064FZ-0602 LL ... 143
4.4.4 064FZ-0603 LL ... 143
4.4.5 064FZ-0821 LL ... 144
4.4.6 064FZ-0831 LL ... 144
4.4.7 064FZ-0852 LL ... 144
4.4.8 064LZ-0011 LL ... 145
4.4.9 064LZ-0511 HH ... 145
4.4.10 064LZ-0511 LLL ... 145
4.4.11 064LZ-0541 LL ... 146
4.4.12 064LZ-0712 LL ... 146
4.4.13 064PDZ-0733 +HH ... 146
4.4.14 064PDZ-0733 -HH ... 147
4.4.15 064PDZ-0830 HH ... 147
4.4.16 064XS-0020 ... 147
4.5 CALCULATION BASIS ... 148
4.6 SIS LOGIC SOLVER ... 148
4.7 FIELD EQUIPMENT ... 149
4.8 SENSOR ELEMENTS ... 149
4.8.1 Valves ... 151
4.8.2 Electrical Loads ... 152
4.9 RELIABILITY DATA ... 153
4.10 SERH... 153
4.11 USER DEFINED ... 153
4.12 CONCLUSION ... 154
21
APPENDIX B: EXSILENTIA SILVER EXCEL EXPORT ... 171
APPENDIX C: SELECTED EXSILENTIA IEC61511 COMPLIANCE REPORT ... 173
APPENDIX D: FRGM FOR SIFS PER TABLE 4.1 ... 177
ATTACHMENT 1: SIEMENS 3RT CONTACTOR FAILURE RATE DATA ... 178
ATTACHMENT 2: ABB AXX-30 CONTACTOR FAILURE RATE DATA ... 181
ATTACHMENT 3: SIL SAFETY CONSIDERATIONS FOR FAIL SAFE RELAY PSR-SCP-24DC/ESP4/2X1/1X2 ... 182
CHAPTER 5 - NIST + FRGM: CONSIDERATION ON CYBERSECURITY ... 190
5.1 INTRODUCTION ... 190
5.2 NIST ... 192
5.3 NIST FRAMEWORK CORE [138] ... 193
5.4 NIST FRAMEWORK IMPLEMENTATION TIERS ... 195
Tier 1: Partial ... 196
Tier 2: Risk Informed ... 197
Tier 3: Repeatable ... 198
Tier 4: Adaptive... 199
5.5 NIST FRAMEWORK PROFILE (“PROFILE”) ... 200
5.6 ISA 99 (IEC 62443) – INDUSTRIAL AUTOMATION AND CONTROL SYSTEMS SECURITY . ... 200
5.7 RELATED WORKS ... 201
Alignment between safety and security standards ISA 84 (IEC 61511) and ISA 99 (IEC 62443) ... 203
Integrating Industrial Control System (ICS) Safety and Security ... 204
Safety and security aware framework for the development of feedback control systems ... 206
22
5.9 DETAILED PROPOSAL: ALIGNMENT OF THE NIST FRAMEWORK WITH THE FRGM .. 210 5.10 APPLICATION OF THE PROPOSED FRAMEWORK TO A CASE STUDY... 214
SIF 064FZ-0567 LL NIST Risk Assessment ... 215 SIF 064FZ-0567 LL FRGM Risk Assessment ... 220
5.11 CONCLUSION ... 224
CHAPTER 6 – SUMMARY & FUTURE WORKS ... 226
23
List of Figures
Fig. 1.1. Risk Reduction General Concept ... 36
Fig. 1.2. Funnel Risk Graph Method ... 37
Fig. 2.1. Block diagram of SIS subsystems. ... 45
Fig. 2.2. Example of SIS subsystems. ... 45
Fig. 2.3. Overall safety life cycle by IEC 61508 [2]. ... 51
Fig. 2.4. The Funnel Risk Graph Method (FRGM) ... 54
Fig. 2.5. Uncertainty classification [32]. ... 57
Fig. 2.6. Overall procedure of fuzzy safety integrity assessment [41]. ... 61
Fig. 2.7. Fuzzy probabilistic approach concept [45]. ... 64
Fig. 2.8. Example using a single burner with five outlets [49]... 66
Fig. 2.9. Switching Markov model of 1oo1 architecture [62]. ... 69
Fig. 2.10. Schematic diagram of MDBN for SIL determination [66]. ... 72
Fig. 2.11. State transition diagram of IC and CC nodes in proof test phase [66].
... 73
Fig. 2.12. Markov transition diagram [93]. ... 87
Fig. 2.13. Hybrid model; System level RBD [89]. ... 90
Fig. 2.14. Hybrid model; Sub-level CTMC [89]. ... 92
Fig. 2.15. Plotted calculation results [108]. ... 93
Fig. 3.1. Risk reduction factor concept. ... 105
24
Fig. 3.3. Example of corporate risk matrix. ... 113
Fig. 3.4. Block Diagram of Conveyor Safety System ... 116
Fig. 3.5. SIF#1 (A100) - Safety Switches ... 117
Fig. 3.6. SIF#1 (A100) – Schematic Diagram showing SILBUS transmitter .. 118
Fig. 3.7. SIF#2 (M100) – Metal Detector [118] ... 119
Fig. 3.8. SIF#3 (A200) - Safety Switches [119] ... 120
Fig. 3.9. FRGM straightforward steps using SIF#1 (A100) – SIL 2 ... 121
Fig. 3.10. FRGM straightforward steps using SIF#2 (M100) – SIL 1 ... 122
Fig. 3.11. FRGM straightforward steps using SIF#3 (A200) – SIL 3 ... 124
Fig. A.1. Silver Summary Report for 064FZ-0567 LL ... 155
Fig. A.2. Silver Summary Report for 064FZ-568 LL ... 156
Fig. A.3. Silver Summary Report for 064FZ-0602 LL ... 157
Fig. A.4. Silver Summary Report for 064FZ-0603 LL ... 158
Fig. A.5. Silver Summary Report for 064FZ-0821 LL ... 159
Fig. A.6. Silver Summary Report for 064FZ-0831 LL ... 160
Fig. A.7. Silver Summary Report for 064FZ-0852 LL ... 161
Fig. A.8. Silver Summary Report for 064LZ-0011 LL ... 162
Fig. A.9. Silver Summary Report for 064LZ-0511 HH ... 163
Fig. A.10. Silver Summary Report for 064LZ-0511 LLL ... 164
Fig. A.11. Silver Summary Report for 064LZ-0541 LL ... 165
Fig. A.12. Silver Summary Report for 064LZ-0712 LL ... 166
Fig. A.13. Silver Summary Report for 064PDZ-0733 +HH ... 167
25
Fig. A.15. Silver Summary Report for 064PDZ-0830 HH ... 169
Fig. B.1. exSILentia SILVer Report ... 171
Fig. B.2. exSILentia SILVer Report ... 172
Fig. C.1. Target and Achieved SIL results for SIF 064FZ-0567 LL ... 173
Fig. C.2. Analysis results for SIF 064FZ-0567 LL ... 173
Fig. C.3. SIF conceptual design for SIF 064FZ-0567 LL ... 174
Fig. C.4. Sensor Part Configuration ... 174
Fig. D.1. FRGM SIL Determination for 064FZ-0567 LL (SIL 1) per Table 4.1 177
Fig. D.2. FRGM SIL Determination for SIF 064LZ-0712 LL (SIL 2) per Table 4.1
... 177
Fig. E.1. Failure Rate Calculation: Siemens Sirus 3RT Series Contactor ... 178
Fig. E.2. Failure Rate Calculation: Approvals, Test Certificates, Characteristic
Curves ... 179
Fig. E.3. Failure Rate Calculation: Standards and Approvals ... 180
Fig. F.1. Failure Rate Calculation: ABB Axx-30 Contactor ... 181
Fig. G.1. Raw results of the FMEDA - High demand – Input Circuit ... 183
Fig. G.2. Raw results of the FMEDA – High demand – Relay Channel 1 ... 183
Fig. G.3. Raw results of the FMEDA – High demand – Relay Channel 2 ... 183
Fig. G.4. Calculation for the input circuit ... 184
Fig. G.5. Calculation for the redundant structure ... 185
Fig. G.6. Combined values according to 1oo1 structure ... 186
Fig. G.7. Raw results of the FMEDA - Low demand – Input Circuit ... 186
26
Fig. G.9. Raw results of the FMEDA - Low demand – Relay Channel 2 ... 187
Fig. G.10. Calculation for the input structure ... 187
Fig. G.11. Calculation for the redundant structure ... 188
Fig. G.12. Combined values according to 1oo1 structure ... 189
Fig. 5.1. NIST Framework Core ... 193
Fig. 5.2. NIST Cybersecurity Framework ... 194
Fig. 5.3. ISA 99 (IEC 62443) [137] ... 202
Fig. 5.4. FACT: Merged ISA 84 (IEC 61511) and ISA 99 (IEC 62443) lifecycles
[13] ... 204
Fig. 5.5. Safety, Security and Operational Output Stream [14] ... 205
Fig. 5.6. V-model Lifecycle [10] ... 206
Fig. 5.7. Top level architecture of the Simulink model of the framework [15] . 207
Fig. 5.8. Processing segmentation inside the main modules of the framework
[15] ... 207
Fig. 5.9. Overview of the alignment framework ... 209
Fig. 5.10. Detailed framework for the alignment of NIST and FRGM ... 212
Fig. 5.11. Modelling of the SIF 064FZ-0567 LL Conceptual Design ... 215
Fig. 5.12. Sensor of SIF 064FZ-0567 LL ... 216
Fig. 5.13. Logic Solver Yokogawa ProSafe-RS and Workbench ... 217
Fig. 5.14. ICSS/SCADA Network, in accordance with ISA-99 [145] ... 218
Fig. 5.15. FRGM SIL Determination for SIF 064FZ-0567 – SIL 1 ... 220
27
Fig. 5.17. SIL Certificate for 064FZ-0567 LL EJX Differential Pressure
28
List of Tables
Table 2.1. Organizational differences [2, 3]... 52
Table 2.2 Terminology [2, 3]. ... 52
Table 2.3. Comparison between traditional methods and FRGM. ... 55
Table 2.4. Benefit calculation and sensitivity analysis. ... 55
Table 2.5. Uncertainty sources and their classification, in SIL determination
methods [32]. ... 57
Table 2.6. PFD and RRF for each SIL rating [37]. ... 59
Table 2.7.The size of the matrix model in reference [41]. ... 63
Table 2.8. Reliability of extended safety integrity level [61]. ... 68
Table 2.9. States and description of switching Markov model [62]. ... 69
Table 2.10. State transition CPTs of IC and CC nodes in proof test phase [66].
... 73
Table 2.11. Comparison among equivalent mean down times for the three
system architectures [50]. ... 83
Table 2.12. System states [93]. ... 87
Table 2.13. System states [93]. ... 87
Table 2.14. Comparison of analysis techniques [108]. ... 93
Table 2.15. Comparison of selected target SIL determination methods. ... 99
Table 3.1. – Phases of the safety lifecycle ... 108
29
Table 3.3 – Equivalence of SIL’s and CAT’s ... 111
Table 3.4. – Typical Pattern of Calibration using the FRGM ... 114
Table 3.5. – Calibration of FRGM ... 115
Table 3.6. – Summary of Risk Assessment and Allocations using FRGM for
SIF#1, SIF#2 and SIF#3 ... 125
Table 3.7. – Summary of Risk Assessment and Allocations using LOPA [3] for 3
SIFs ... 126
Table 3.8. – Typical Protection Layer Probability of Failure on Demand ... 128
Table 3.9. – Summary of Results using FRGM and LOPA for SIF#1, SIF#2 and
SIF#3 ... 130
Table 3.10. – Comparison between FRGM and Traditional Standard Methods
... 132
Table 3.11. Benefit calculation and sensitivity analysis for 3,000 SIFs. ... 133
Table 4.1. Summary of Safety Instrumented Functions for PU6400 ... 138
Table 4.2. Summary Cost Reduction Entire LNG Plant A SIFs ... 142
Table C.1. Functional Safety Performance of SIF 064FZ-0567 LL ... 174
Table C.2. Functional Safety ... 174
Table C.3. Reliability Data Sensor Group 064FZ-0567 ... 175
Table C.4. Reliability Data Sensor Group 064GBZ-6601 ... 175
Table C.5. Reliability Data Logic Solver Yokogawa SIS ... 175
Table C.6. Reliability Data Final Element Group 064UZR-6601 ... 176
Table D.1: Results for DTS high demand mode of the ESP4 according to 1oo1
30
Table D.2: Results for DTS low demand mode of the ESP4 according to 1oo1
structure ... 182
Table D.3: Results for DTS high demand mode of the ESP4 according to 1oo1
structure ... 186
Table D.4: Results for DTS low demand mode of the ESP4 according to 1oo1
structure ... 189
31
“Imagination is more important than knowledge...”
32
Chapter 1 - Introduction
Integrated Control and Safety Systems (ICSS) are considered the heart of
any industrial plant. Dependability to ICSS is very important because systems
failure might endanger human life, lead to significant property loss, or cause
extensive environmental damage. In oil and gas, such as the LNG industry [1],
petrochemical and process industries, Safety Instrumented Systems (SIS) are
implemented to safely ‘secure liquid inside the pipe’ or keep a process under
control from hazardous processes, and ensure that the instrumentation for
functional safety is in place. These mission and safety-critical systems prevent
physical harm to personnel and/or damage to company property or the
environment. In the event that a hazardous process condition is sensed by the
ICSS, a safe state will then be executed by the SIS. Moreover, in the event of a
SIS failure, the SIS is expected to force the process into its fail-safe condition,
i.e., the condition where the presence of harm is eliminated [2]. As oil and gas
industries have been one of the major sources of energy, its existence is
inevitable in the decades to come, despite of the risks associated with it. It is in
absolute certainty that these industries need to utilize ICSS to safely and
effectively conduct their business. Learning from the past, understanding these
constraints and making contributions are paramount in this research project. Take
for example the oil platform Piper Alpha, which was destroyed by a gas leak in
July 1988, and is still the worst offshore oilfield disaster to date (in terms of human
33
cumbersome, time consuming and complex [3, 4, 5, 6, 7, 8, 9] considering a
bunch of Standards and Regulations to follow. Therefore, new optimised
approaches to the design and evaluation of ICSS will be fundamental to this
research work. An application of a more cost-effective, simplified and enhanced
approach called the Funnel Risk Graph Method (FRGM), for the design and
evaluation of SIS will be investigated in this project. Like other computers, ICSS
is also vulnerable to cyber-attacks, recent news about serious security incidents
such as WannaCry [10] ransomware affecting the whole world are heard more
often. Therefore, an evaluation of the impact of the cybersecurity vulnerabilities
will also be considered in this project.
This chapter provides an overview of the research reported in this thesis.
Previous research progresses were reviewed and the motivation for the work is
presented. The objectives of the research are identified and the main scientific
contributions made through this research are highlighted.
Motivation and Background
In oil and gas, petrochemical and process industries, SIS is implemented to
safely ‘secure liquid inside the pipe’ or keep a process under control from
hazardous processes, and ensure that the instrumentation for functional safety is
in place [1]. These mission and safety-critical systems are designed to prevent
physical harm to personnel and/or damage to company property or the
34
ICSS then a safe state will be executed by the SIS. Moreover, in the event of SIS
failure, the SIS is expected to force the process into its fail-safe condition, i.e., the
condition where the presence of harm is eliminated [1]. For instance, a control
valve moves to its fail-open or fail-close condition depending on the SIS design.
The ultimate objective of designing SIS is to comply with the requirements of
Safety Integrity Level (SIL). As identified by risk analysis of the related process,
a SIS is designed against the SIL [1]. Reference [2] requires Probability of Failure
on Demand (PFD), which is a requirement of the SIS design. In process industry
sector, a more detailed application of SIS is included in [3]. The requirements of
SIL must be reflected by the design of the SIS. The architecture of SIS including
field devices and systems need to be selected properly to enable safety function
as designed. Hardware Fault Tolerance (HFT), as one of the architectural
constraints is also examined in this paper. One of the ways to approach SIS
issues is suggested by [2] and, for SIS concerning the process industries, by [3].
These international standards [2, 3] refer to safety system for electric, electronic
and programmable electronic systems. Specifically, these international standards
set criteria and management guidelines from the ‘cradle’ or the first phase of the
project until the ‘grave’, which is the end of life of the product. When these
international standards are strictly followed, it is often than not, leads to allocation
of more resources and time in the safety assessment phase, as such the
application is often complicated [4-9]. Furthermore, none of the standards are
able to provide both a stand-alone safety lifecycle framework and the guidelines
35
technologies that are likely to be encountered in industries such as in mining or
industrial plant [10]. Given the complexity of process industries, mining and other
plant, SIL and Performance Level (PL) allocation should be performed via a
quantitative or semi-quantitative methodology where practicable [1]. The size of
instrumentation, SIS, project risk assessments yield a large number of hazards,
many of which require further consideration and allocation of SIL’s or PL’s to
safety-related systems. In such cases, it may be impracticable to apply a
semi-quantitative or semi-quantitative approach due to the substantial amount of time and
resources involved. An optimised method for SIS design starts from the
assessment phase.
All the aforementioned reasons have motivated us to investigate the current
gaps between the existing methodologies and challenges involved in the design
and evaluation of ICSS, particularly the SIS through the introduction of FRGM.
Objective and Scope of the Thesis
1.2.1
General Objective
The aim of this thesis is to explore a more cost-effective, simplified and
enhanced approach for the design and evaluation of SIS through the FRGM.
Safety Integrity Level (SIL) and Performance Level (PL) allocation for process,
mining and other related industries require deeper level of analysis. Adopting the
36
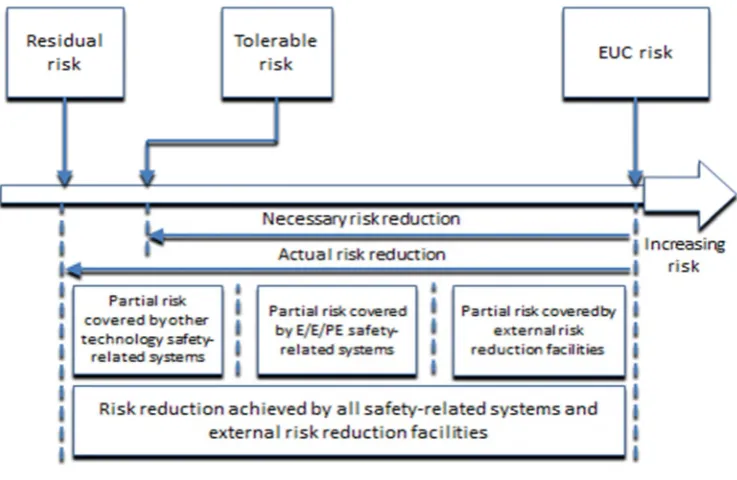
each of the Equipment Under Control (EUC) risks are identified, the level of risk
is calculated or estimated and then one or more risk reduction measures are
designated. The objective of this risk management approach is to apply sufficient
risk reduction measures against the EUC risk such that the “actual risk reduction”
exceeds the “necessary risk reduction” to achieve an acceptable “tolerable risk”.
Fig. 1.1. Risk Reduction General Concept
Based on this concept, this research project’s main aim is to develop and
apply an optimised approach for the design and evaluation of ICSS using the
FRGM method shown in Figure 1.2 [10-12] (FRGM is the proposed approach in
evaluation of ICSS that aims to reduce costs in the early stage of the design
37
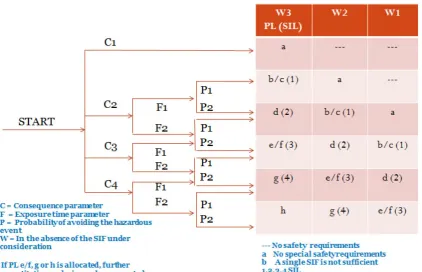
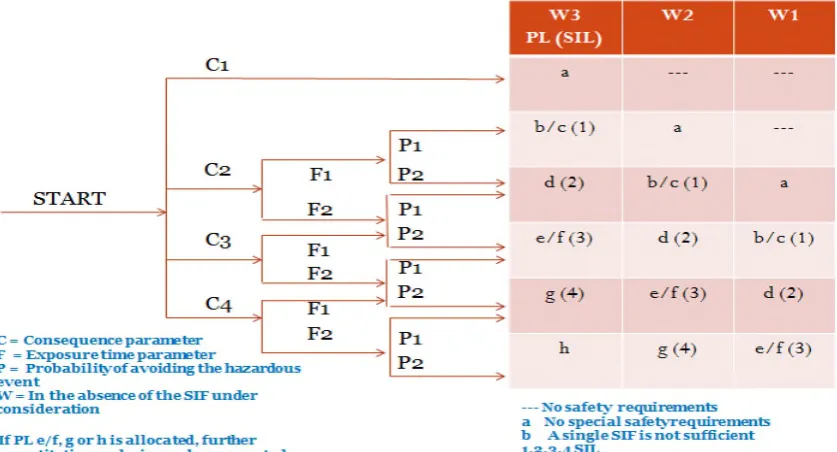
Fig. 1.2. Funnel Risk Graph Method
Specific Objectives:
Real-life industrial scenarios will be analysed to prove the advantage of
FRGM over the traditional approach. The specific objectives of this project are to:
1. Develop the framework of the FRGM approach by aligning to the
phases of the safety lifecycle as a ‘funnel’;
2. Present case study analyses to prove the advantages of FRGM over
the traditional approach;
3. Carry out an evaluation of FRGM, comparing it to the traditional
38
• FRGM will result in equal functional safety;
• FRGM requires few number of steps required and time taken, thus achieving economic benefit.
4. Analyse different kinds of SIF with resulting SIL;
5. Cybersecurity consideration using FRGM.
Main Contributions to Knowledge
This research strives to address the issues faced by the oil & gas and
related industries regarding the evaluation and design of ICSS, particularly the
SIS. Big or small players in the industry, cannot escape from the fact that they
need to utilise ICSS in their business operations. Traditionally, in designing ICSS,
all SIF must undergo quantitative or semi-quantitative analyses consuming a lot
of resources. In this research work, an application of a more cost-effective,
simplified and enhanced approach called FRGM for the design and evaluation of
SIS will be explored in reference to the functional safety standards. FRGM will be
discussed in-depth in Chapter 3. Based on the preliminary results, it is expected
that the project will result in significant economic benefits, more practicable
compliance with results in equal degree of functional safety as compared to the
traditional approach. To prove the effectiveness of this approach, comparative
analyses are presented in Chapters 3 and 4. The proposed approach will also
consider cybersecurity as an important component of the assessment in Chapter
39
• Developed the FRGM as a novel approach to determine SIL ratings. The FRGM approach can be applied to filter lower SIL ratings and the
result as target or required SIL. By utilising this technique, a lot of
resources can be saved. Potential cost savings were presented in
Chapters 3 and 4 for different applications;
• Presented several case studies and compared results of FRGM with traditional method to show accuracy of FRGM. The application of
FRGM was presented in Chapter 3 involving 3 SIFs. These 3 SIFs
were involved in a process of transporting and handling solids through
a conveyor belt. They are designed to disable any movement of the
conveyor belt and its associated equipment during emergency or
metal detection. Potential hazards may involve fatalities, injuries or
equipment damage. Another real-life case study was presented In
Chapter 4 utilising LNG Plant A. The Plant is one of the biggest LNG
plants in the world with an estimated gas resource of 50 trillion cubic
feet;
• Presented cost benefit analyses of FRGM. All of the case studies presented in this research demonstrated potential cost savings to
prove the effectiveness of the FRGM approach. The 3 SIFs in Chapter
3, which involves a process of transporting and handling solids through
a conveyor belt, generated a potential savings of $976,500. The LNG
Plant A in Chapter 4 yielded a total cost reduction of $3,906,000 out of
40
assessment. This was based on 3,000 SIFs, total reduction of 2.167
hours and average salary rate of $150/hour;
• Conducted SIL calculations and verifications for SIFs in the LNG Plant A using exSILentia software and compared results with FRGM to
prove accuracy of the proposed FRGM approach. Achieved SIL
ratings were verified for 16 SIF loops in Chapter 4. It is shown in Table
4.1 that all 16 loops achieved their respective SIL targets. SIF
064LZ-0011 LL even exceeded the achieved SIL from 1 to 2;
• Developed the novel National Institute of Standards and Technology (NIST) + FRGM framework for the integration of SIS and
cybersecurity. It has been recognised by the research community
[13-21], the industry, as well as the International Society of Automation
(ISA) [22] that there is a need of such alignment between safety and
security, in which this research work was also striving to address;
• Presented a case study using the NIST + FRGM framework for a SIF in the LNG Plant A. SIF 064FZ-0567 LL from LNG Plant A was
explored and re-analysed to illustrate the proposed integrated NIST +
FRGM in Chapter 5. The objective is to demonstrate how SIL
assessment would be impacted in the consideration of cyber security
threats. The result showed that the SIF has low cybersecurity risk with
SIL rating of SIL 1. The primary advantage of this integrated approach
41
Secondarily, optimising the evaluation process into a unified approach
would mean significant cost benefit.
Organisation of the Thesis
This thesis is presented in six Chapters. The organisation of the remaining
Chapters is as follows:
Chapter 2 provides literature reviews of past and ongoing research work.
Pros and cons of those methodology were compared and contradicted. Various
SIL determination and calculation methods are compared as per criteria of
relevant qualifying factors. This Chapter compared advantages and
disadvantages of reviewed methods from complexity, accuracy and
cost-effectiveness perspectives.
Chapter 3focuses on the development of FRGM which was based on the
Phase 5: Safety Requirements Allocation. This was based on the 16-phase
IEC61508 [2] safety lifecycle with the inclusion of IEC62061 [23], IEC61511 [3],
ISO13849 [24] and AS4024.1 [25] as a combined safety lifecycle process [10].
The qualities of FRGM being more cost-effective and simplified is explored in this
Chapter. Comparative analyses between FRGM and LOPA (and other traditional
methods) are also presented. The FRGM only takes 3 steps while LOPA takes
13 steps. An estimated cost savings of $976,500 is calculated for 3,000 SIFs with
42
Chapter 4provides quantitative analyses for the SIFs used in the LNG Plant
A Process Unit 6400 (PU6400). This Chapter demonstrates SIL calculations
performed for each SIF loop that were assigned a SIL target of SIL 1 or greater.
Calculations are based on the actual hardware selected for the Sensor, the Logic
Solver and the Final Element. The software for performing SIL calculations is
exSILentia coupled with the latest reliability database SERH, then results
compared against FRGM. Considering the factors such as number of hours
reduced using FRGM, salary per hour and the number of personnel conducting
the assessment, potential savings can be achieved at around $3,906,000 using
the FRGM when the entire SIFs of the LNG Plant A are evaluated.
Chapter 5 this complementary chapter is dedicated to an integrated and
optimised evaluation framework for ICSS and related subsystems considering
cybersecurity and safety. This can be achieved by the alignment of the
cybersecurity framework formulated by the National Institute of Standards and
Technology (NIST) with safety and security standards ISA84 (IEC 61511) and
ISA99 (IEC 62443), and the novel Funnel Risk Graph Method (FRGM). The need
of such alignment between safety and security has been recognised by the
research community, the industry, as well as the International Society of
Automation (ISA). The framework is called NIST + FRGM.
Chapter 6 summarises the research work and presents the conclusions
drawn from the study along with some recommendations for possible future
43
Chapter 2 - Developments in SIL
Determination and Verification
2.1 Introduction
Recent developments in technology and the move towards efficient
utilisation of resources have inspired researchers and practitioners to come up
with cost-effective approaches to Safety Integrity Level (SIL) determination and
verification, as the current methods are too cumbersome and time-consuming.
The bottom line is meeting the organisation’s safety requirements in an
economical manner regardless of methodology employed yet without sacrificing
accuracy. This Chapter presents a review of various target SIL determination and
calculation methods in the life cycle of Safety Instrumented Systems (SIS).
Various SIL determination and calculation methods are compared as per criteria
of relevant qualifying factors. Advantages and disadvantages of each method are
briefly discussed. The key outcome of this review is that the qualitative funnel risk
graph method (FRGM) can be used as a funnel technique to assess lower SIL
ratings whilst more complex methods are applied on higher SILs with caution.
IEC 61508 [2] and IEC 61511 [3] are two standards used to measure the
SIL of a SIS in the related industries such as oil, gas, chemicals and electricity
44
[2], which is a measure of the confidence with which the system can be expected
to perform their safety function. SIL is the measure that indicates the importance
of Safety Instrumented Function (SIF), as described in IEC 61508-6 [27]. Figure
2.1 shows the block diagram of SIS Subsystems and Figure 2.2 shows an
example of SIS, which generally consists of three Subsystems: sensor, logic
solver and final element. The sensor subsystem detects the onset of possible
hazardous situations, the logic solver subsystem decides what to do by
evaluating the information from the sensor subsystem, and the final element
subsystem takes action through control valves, safety valves, circuit breakers,
among others.
A SIF is designed to respond to a specific hazardous event and implements
an action. Bringing to safe state is the task for demand mode SIFs. Continuous
mode SIFs 'maintain' plant in safe state. Demand mode SIF bring equipment
under control (EUC) into a safe state. Each SIF is defined with a SIL according
to the risk reduction level that is required from that function. The SIL has a
discrete four-level scale, where SIL 1 is the minimum safety requirement and SIL
4 is the most stringent. These levels are used to specify the safety integrity
requirements for the safety functions performed by safety systems. The target
SIL is a criterion indicating whether a SIS should meet the safety requirements,
derived from risk assessment. The actual SIL indicates that the SIS can perform
its safety function after SIL verification. There are three different approaches in
45
Several methods under these approaches can be used and have their
advantages and disadvantages. SIL assignment during design of SIS from
database based on experience was explored by Wang et al. [29].
Functional safety refers to SIS that implements SIF. SIL targets must first
be determined, and later verified or validated. SIS are widely used in the process
industry to protect humans, the environment, and material assets against
hazardous events, such as an explosion due to high pressure or product spillage
due to high tank level.
Fig. 2.1. Block diagram of SIS subsystems.
Fig. 2.2. Example of SIS subsystems.
The SIS must fulfil certain safety requirements to provide a specified level
of risk reduction. Many standards and guidelines have been developed, which
define the SIF requirements and how the SIL should be determined and its
requirements should be fulfilled. There are a few governing standards for
46
functional safety such as IEC 61513 (Nuclear power plants), IEC 62061 (Safety
of machinery - Functional safety of safety-related electrical, electronic and
programmable electronic control systems, based on EN 61508), ISO 13849-1
(Safety of machinery - Safety-related parts of control systems. Non-technology
dependent standard for control system safety of machinery), IEC 62304 (Medical
device software), EN 50128 (Railway industry specific – Software safety), EN
50129 (Railway industry specific – system safety in electronic systems), EN
50495 (Safety devices related to explosion risks), NASA Safety Critical
Guidelines, ISO 26262 (Road vehicles functional safety), EUROCAE ED-12B
European Airborne Flight Safety Systems among others. However, IEC 61508 [2]
is the most common of these standards, which is a generic standard specifying
the functional safety requirements for SIS. The IEC 61508 [2] also serves as the
overarching mother standard for the development of industry-specific safety
standards such as IEC 61511 [3] for the process industry and IEC 62061 [23, 30]
for machinery systems. SIS have been used for many years to perform SIF in the
process industries. If SIS is to be effectively used for SIF, it is essential that SIS
achieves certain minimum standards and performance levels. IEC 61511 [3]
standard addresses the application of SIS for the process industries. It also
requires a process hazard and risk assessment to be carried out to enable the
specification for SIS to be derived.
The objective of functional safety management is to identify the
47
objectives are met [3]. They are implemented by Integrated Control and Safety
Systems (ICSS), which are usually operating in a computer network using wired
and/or wireless communication technologies. Risk managers may use SIF
together with several other risk reduction measures to control risk exposure. The
target level of risk reduction for each SIF is determined to ensure that the overall
risk to personnel is as low as reasonably practicable.
This Chapter presents a review of SIL determination and validation
methods. SIL determination is the front-end engineering aspect to set the target
SIL on each of a given SIF, while SIL verification is the validation process to
ensure if the achieved target SIL can be achieved, using preferred methods.
There are several calculation techniques described in the IEC 61508-7 [2]
standard to verify the SIL for the systems comprised of programmable electronic
and automation components. It was noted that the application of each one of
these methods might be cumbersome depending on the different approaches that
the analyst may take.
This Chapter is organized as follows: Section 2.2 discusses SIL
approaches, Section 2.3 explores selective SIL target determination methods,
Section 2.4 explores research interests in Bayesian networks (BNs) and dynamic
Bayesian networks (DBNs), Section 2.5 discusses techniques in SIL calculation,
Section 2.6 summarises and reviews different selected target SIL determination
48
2.2 SIL approaches
IEC 61508 [31] standard is the generic approach for all safety lifecycle
activities for systems comprised of electrical and/or electronic and/or
programmable electronic components (electrical/electronic/ programmable
electronic systems (E/E/PES) that are designed to perform safety functions. This
integrated approach has been utilised such that a rational and consistent
technical policy be developed for all electrically-based safety-related systems.
The overall safety lifecycle of IEC 61508 [2] is shown in Figure 2.3 [2]. IEC
61508 [31] standard has the following functions:
• When E/E/PESs are used to perform safety functions, they consider all relevant overall E/E/PES and software safety lifecycle phases.
• It has been developed in a way that it is comprehensive; that is the framework is sufficiently robust and far-reaching to accommodate for
future developments.
• As an overarching standard, it enables application sector international standards, dealing with safety-related E/ E/ PESs, to be developed,
which enables to have both safety and economic benefits.
• It provides a method for the development of the safety requirements specification (SRS) necessary to achieve the required functional
49
• It uses SIL for specifying the target level of safety integrity for the safety functions to be implemented by the E/E/PE safety-related
systems.
• In the determination of the SIL requirements, it adopts a risk-based approach.
• It has sets of numerical target failure measures for E/E/PE safety-related systems which are linked to the SIL.
• On the target failure measures, it sets the lower limit in a dangerous mode of failure, which can be claimed for a single E/E/PE
safety-related system; for E/E/PE safety-safety-related systems operating in:
(1) A low demand mode of operation, the lower limit is set at an average
probability of failure of 10–5 to perform its design function on demand,
(2) A high demand or continuous mode of operation, the lower limit is set at
a probability of a dangerous failure of 10–9 per hour;
• It adopts a broad range of principles, techniques and measures to achieve functional safety for E/E/PE safety-related systems, but does
not use the concept of fail-safe.
For the process industries, IEC 61511 [3] is to be used. It addresses the
application of SIS. It requires a process hazard and risk assessment to be carried
50
which are fundamental to its application; safety lifecycle and SIL. It addresses
SIS, which are based on the use of E/E/PES technology. Where other
technologies are used for logic solvers, the basic principles of this standard
should be applied. IEC 61511 also addresses the SIS sensors and final elements
regardless of the technology used. IEC 61511 is process industry specific within
the framework of IEC 61508 [2]. There are key differences between IEC 61511
[3] and IEC 61508 [2] and these differences are enumerated in Tables 2.1 and
Table 2.1. Organizational differences [2, 3].
IEC 61508 IEC 61511 Comment
Part 1 Part 1 IEC 61508-1, -2, -3 and -4 have been combined into IEC 61511-1
Part 2 Part 2 Included in IEC 61511-1 Part 3 Part 3 Included in IEC 61511-1 Part 4 Part 4 Included in IEC 61511-1 Part 5 Part 5 Included in IEC 61511-3 Part 6 Part 6 Guidelines for IEC 61511-1
Part 7 Part 7 Informative references included in each part as annexes
Table 2.2 Terminology [2, 3].
IEC 61508-4 IEC
61511-1
Comment
E/E/PE safety related system
SIS IEC 61508 refers to E/E/PE safety systems while IEC 61511 refers to safety instrumented systems
PES SIS IEC 61508 “PES” includes sensors and final control elements, while IEC 61511 uses the term SIS.
Process control system Basic process control system
Basic process control system is a global term for the process sector.
EUC Process IEC 61508 refers to EUC (equipment under control) while IEC 61511 refers to process.
Safety function SIF IEC 61508 safety function implemented by E/E/PES, other technology safety related system, or external risk reduction facilities. IEC 61511 SIF is implemented solely by SIS.
2.3 Selective target SIL determination methods
SIL determination refers to the activity of selecting the required SIL for a
SIF. SIL determination is usually done after the risk assessment has been
performed and the SIFs required have been defined. Qualitative and quantitative
techniques can be used to evaluate the risk associated to a process. After the
risk has been evaluated, the necessary SIF needs to be identified then implement
it on a SIS to achieve the desired safety level, and verify that the SIS configuration
meets the required SIL. The IEC 61508 [2] provides a method for the
53
E/E/PE safety-related systems. It uses SIL for specifying the target of safety
integrity for safety functions, adopts a risk-based approach for SIL determination
and sets numerical target failure measures, which are linked to the SIL.
In the field of ICSS, research on SIL determination has attracted
considerable attention and thus, we have enumerated, discussed and compared
various selected techniques.
Risk graph method is one of the frequently-used methods when determining
target SIL [32]. It is intended to be simple and conservative [33]. The risk graph
considers likelihood, consequence, occupancy and probability of personnel
avoiding hazards while hazard matrices consider only likelihood and
consequence of an event. These four parameters used in risk graph are
combined to indicate the level of unmitigated risks. Risk graph method is a
qualitative method that enables SIL determination from a knowledge of the risk
factors associated with the EUC and the EUC control system [2]. Risk graph is
based on the following equation as shown in Eq. (1.1):
= (1.1)
Where is the risk with no safety-related systems in place;
, is the frequency of the hazardous event with no safety-related
systems in place, and;
, is the consequence of the hazardous event.
The frequency of the hazardous event is made up of three influencing
54
hazardous event and the probability of the hazardous event taking place without
the addition of any safety-related systems. With this, four risk parameters were
produced:
• C: consequence parameter of the hazardous event;
• F: frequency of and exposure time parameter in the hazardous zone;
• P: Probability of avoiding the hazardous event and;
• W: Demand rate in the absence of the SIF under consideration.
The Funnel Risk Graph Method (FRGM) [34, 35] is based on the risk graph
method, which was explored by Gabriel et al. [34, 35], and presented in Figure
2.4.
55
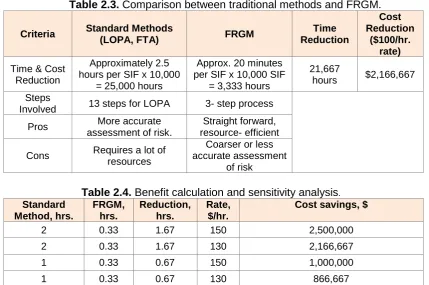
Table 2.3 shows the comparative differences between the traditional
quantitative methods such as Fault Tree Analysis (FTA) and semi-quantitative
method Layers of Protection Analysis (LOPA), as compared to the proposed
FRGM approach at say 10,000* SIFs (example only). Per our simulations, cost
reduction is realized by the number of hours spent by a multi-disciplinary team.
The coarser or less accurate assessment of risk using the FRGM is not a concern
as it is used as a funnel from a broad range of SIL 0 to SIL 2. Table 2.4 shows
the sensitivity analysis with varying inputs.
Table 2.3. Comparison between traditional methods and FRGM.
Criteria Standard Methods
(LOPA, FTA) FRGM
Time Reduction Cost Reduction ($100/hr. rate) Time & Cost
Reduction
Approximately 2.5 hours per SIF x 10,000
= 25,000 hours
Approx. 20 minutes per SIF x 10,000 SIF
= 3,333 hours
21,667
hours $2,166,667 Steps
Involved 13 steps for LOPA 3- step process Pros More accurate
assessment of risk.
Straight forward, resource- efficient Cons Requires a lot of
resources
Coarser or less accurate assessment
of risk
Table 2.4. Benefit calculation and sensitivity analysis.
Standard Method, hrs. FRGM, hrs. Reduction, hrs. Rate, $/hr.
Cost savings, $
2 0.33 1.67 150 2,500,000
2 0.33 1.67 130 2,166,667
1 0.33 0.67 150 1,000,000
1 0.33 0.67 130 866,667
0.75 0.33 0.42 150 625,000
* 10,000 SIFs were used to easily demonstrate the advantages of FRGM and the
56
Chang et al. [32] presented an uncertainty analysis for target SIL
determination and discussed its application in the offshore industry. The work
presented aimed to identify uncertainty sources in SIL determination methods,
specifically the risk graph method. As shown in Figure 2.5, there are two
classifications of uncertainty:
(1) Randomness due to natural variability of system (aleatory) and,
(2) Imprecision due to lack of knowledge on the system (epistemic) [36].
Based on the definitions of uncertainty, various target SIL determination
methods can be classified as possibly affected by aleatory/epistemic,
parameter/model/known completeness/unknown completeness uncertainty,
based on the characteristics of each method. The result of the classification is
shown in Table 2.5. The authors [32] proposed procedures for uncertainty
analysis in SIL determination by using three distinct approaches. These include
the non-probabilistic Fuzzy Set approach, probabilistic Monte Carlo simulation
(MCS), and a combination of non-probabilistic and probabilistic MCS and the
Fuzzy Set approaches. The key feature of the work [32] is the fact that it
investigated the effect of uncertainties, the fuzzy set approach and MCS in its
application to the risk graph method and OLF 070 (SIL Table from Norwegian Oil
Industry Association, Norwegian: Oljeindustriens Landsforening, OLF) minimum
SIL requirement, respectively. The fuzzy set approach was used to evaluate the
risk graph method, a combination of MCS and fuzzy set approach was used for
57
MCS. All methods showed reliable results, with the MCS and fuzzy set approach
applied to LOPA showing advantages of less uncertainty than the fuzzy set
approach, given there is sufficient information available.
Fig. 2.5. Uncertainty classification [32].
Khalil et al. [37] proposed a cascaded fuzzy-LOPA model for SIL
determination for certain hazardous scenarios and at different frequencies of
occurrence in the natural gas industry. The authors developed two fuzzy models.
One was developed to determine the severity of each scenario which involved
checking the impact of each scenario on safety and economical aspects for the
company. The second model was used to determine the SIL requirement based
on the risk. The models were developed by means of a distinct fuzzy logic model,
58
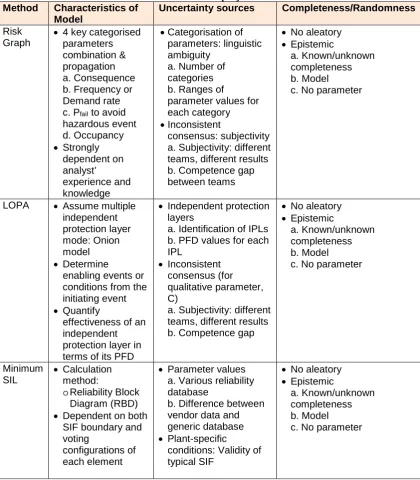
Table 2.5. Uncertainty sources and their classification, in SIL determination methods [32].
Method Characteristics of Model
Uncertainty sources Completeness/Randomness Risk
Graph
• 4 key categorised parameters combination & propagation a. Consequence b. Frequency or Demand rate c. Pfail to avoid
hazardous event d. Occupancy
• Strongly dependent on analyst’
experience and knowledge
• Categorisation of parameters: linguistic ambiguity
a. Number of categories b. Ranges of
parameter values for each category
• Inconsistent
consensus: subjectivity a. Subjectivity: different teams, different results b. Competence gap between teams
• No aleatory
• Epistemic
a. Known/unknown completeness b. Model c. No parameter
LOPA • Assume multiple independent protection layer mode: Onion model
• Determine
enabling events or conditions from the initiating event
• Quantify
effectiveness of an independent protection layer in terms of its PFD
• Independent protection layers
a. Identification of IPLs b. PFD values for each IPL
• Inconsistent consensus (for qualitative parameter, C)
a. Subjectivity: different teams, different results b. Competence gap
• No aleatory
• Epistemic
a. Known/unknown completeness b. Model c. No parameter
Minimum SIL
• Calculation method:
o Reliability Block Diagram (RBD)
• Dependent on both SIF boundary and voting
configurations of each element
• Parameter values a. Various reliability database
b. Difference between vendor data and generic database
• Plant-specific
conditions: Validity of typical SIF
• No aleatory
• Epistemic
a. Known/unknown completeness b. Model c. No parameter
Table 2.6 shows the SIL ratings with the corresponding average probability of
dangerous failure on demand (PFDavg) and Risk Reduction Factor (RRF). NSSR
59
NR “Not Recommended” means there is nothing capable of reducing the risk to
acceptable limits. The introduced model was tested at moderate and high-risk
levels controlled in its practical limits using SIF. The results showed that the
proposed cascaded model and conventional models gave the same results in two
experiments, and the proposed cascaded model only gave better SIL results in
one single experiment.
Table 2.6. PFD and RRF for each SIL rating [37].
SIL
Probability of failure on demand average range (PFDAVG)
Risk Reduction Factor (RRF)
NSSR 10 -1 to 1 1 to 10
1 10 -2 to 10 -1 10 to 100
2 10 -3 to 10 -2 100 to 1,000
3 10 -4 to 10 -3 1,000 to 10,000
4 10 -5 to 10 -4 10,000 to 100,000
NR 10 -6 to 10 -5 100,000 to 1,000,000
Kim et al. [31] proposed an evaluation method for hardware SIL
determination by using hazard analysis and risk assessment (HARA) and failure
modes, effects and diagnostic analysis (FMEDA). The safety assessment of SIS
was evaluated in two phases; defining the safety requirements using HARA, and
evaluating the SIL for hardware and software. The hardware SIL evaluation was
conducted as an eight-step process based on FMEDA that can be used to
evaluate hardware SILs for reliability verification. This process defined the
components of the SIS subsystems, failure modes, and failure effects. A failure
mechanism distribution and failure rate were assigned to each component, and
the safety mode was determined, as well as the detectability of each failure mode.
60
the safety requirement of the flame scanner was determined using the risk graph
method. As a result, the safety requirement of the flame scanner system was
defined as SIL 2. The hardware SIL was also determined to be SIL 2 from the
combined architectural constraints.
Ding et al. [39] proposed an approach for SIL determination based on
system degradation by using reliability block diagram (RBD). From the
perspective of system degradation, any failed channel in a multi-channel system
will cause degradation of the system. This approach discusses the RBD of
several classical safety architectures and explores the formula of PFD and Mean
unavailable time (MUnTs), also based on the degradation processes. The key
idea of the method proposed was to perform RBD analysis and calculation of
average PFD at each stage of system degradation, caused by failures of
redundant channels. The method was applied to several classical redundant
architectures of safety related systems, and could make the SIL verification
process simpler.
Dutuit et al [40] proposed PFD evaluation method in relationship with SIL
of SIS by introducing fault tree models. They focused on the periodically tested
components, which according to their study, must be elaborated to perform
realistic computations of PFD and SIL. The specific problems raised by the
assessment of SIL, which restricts the use of the formula proposed in the
standard was raised. Time-dependent behavior of the system unavailability in
![Fig. 2.3. Overall safety life cycle by IEC 61508 [2].](https://thumb-us.123doks.com/thumbv2/123dok_us/7934590.1317408/51.793.52.729.76.433/fig-overall-safety-life-cycle-iec.webp)
![Table 2.1. Organizational differences [2, 3]. IEC 61511 Comment](https://thumb-us.123doks.com/thumbv2/123dok_us/7934590.1317408/52.595.85.514.84.431/table-organizational-differences-iec-comment.webp)
![Fig. 2.5. Uncertainty classification [32].](https://thumb-us.123doks.com/thumbv2/123dok_us/7934590.1317408/57.595.148.475.167.377/fig-uncertainty-classification.webp)
![Fig. 2.7. Fuzzy probabilistic approach concept [45].](https://thumb-us.123doks.com/thumbv2/123dok_us/7934590.1317408/64.595.202.401.251.422/fig-fuzzy-probabilistic-approach-concept.webp)
![Fig. 2.8. Example using a single burner with five outlets [49].](https://thumb-us.123doks.com/thumbv2/123dok_us/7934590.1317408/66.595.148.432.92.368/fig-example-using-single-burner-outlets.webp)
