Chapter 13 – Concrete Columns 13-i
C
HAPTER
13
C
ONCRETE
C
OLUMNS
TABLE OF CONTENTS
13.1
INTRODUCTION ... 13-1 13.2 TYPES OF COLUMNS ... 13-1
13.3 DESIGN
LOADS...
13-1
13.4 DESIGN
CRITERIA
...
13-2
13.4.1 Limit States ... 13-2 13.4.2 Forces ... 13-213.5 APPROXIMATE EVALUATION OF SLENDERNESS EFFECTS ... 13-2
13.5.1 Moment Magnification Method ... 13-3
13.6 COMBINED AXIAL AND FLEXURAL STRENGTH ... 13-5
13.6.1 Interaction Diagrams ... 13-5 13.6.2 Pure Compression ... 13-6 13.6.3 Biaxial Flexure ... 13-713.7 COLUMN FLEXURAL DESIGN PROCEDURE ... 13-8
13.7.1 Longitudinal Analysis (CTBridge) ... 13-8 13.7.2 Transverse Analysis (CSiBridge) ... 13-8 13.7.3 Column Live Load Input Procedue ... 13-8 13.7.4 Wind Loads (WS, WL) ... 13-14 13.7.5 Braking Force (BR) ... 13-14 13.7.6 Prestress Shortening Effects (CR, SH) ... 13-14 13.7.7 Prestressing Secondary Effect Forces (PS) ... 13-14 13.7.8 Input Loads into WinYIELD ... 13-14 13.7.9 Column Design/Check ... 13-14
13.8 COLUMN SHEAR DESIGN PROCEDURE ... 13-15
13.8.1 Longitudinal Analysis ... 13-15 13.8.2 Transverse Analysis ... 13-15
Chapter 13 – Concrete Columns 13-ii 13.8.3 Column Live Load Input Procedure ... 13-16
13.9 COLUMN SEISMIC DESIGN PROCEDURE ... 13-18
13.10 DESIGN EXAMPLE
...
13-18
13.10.1 Design Column One at Bent Two ... 13-19 13.10.2 Flexural Check of Main Column Reinforcemen (As) ... 13-21
13.10.3 Shear Design for Transverse Reinforcement (Av) ... 13-44
NOTATION ... 13-55
REFERENCES ... 13-58
Chapter 13 – Concrete Columns 13-1
C
HAPTER
13
C
ONCRETE
C
OLUMNS
13.1 INTRODUCTION
Columns are structural elements that support the superstructure, transfer vertical loads from superstructure to foundation, and resist the lateral loads acting on the bridge due to seismic and various service loads.
13.2 TYPES
OF
COLUMNS
Columns are categorized along two parameters (Chen, 2014 and MacGregor, 1988): shape and height:
Columns sections are usually round, rectangular, solid, hollow, octagonal, or hexagonal.
Columns may be short or tall. The column is called either short or tall according to its effective slenderness ratio (Klu/r).
where:
K = effective length factor
lu = unsupported length of a compression member
r = radius of gyration
13.3 DESIGN
LOADS
The considered design loads as specified in AASHTO 3.3.2 are:
Dead loads (DC)
Added dead loads (DW)
Design vehicular live loads:1. Design vehicle HL-93 shall consists of a combination of (Truck + Lane) or (design tandem + Lane) including dynamic load allowance (IM).
2. Permit vehicle (P15) including the dynamic load allowance (IM).
Chapter 13 – Concrete Columns 13-2
Braking force (BR)
Thermal effects (TU)
Prestress shortening effects (CR, SH)
Prestressing secondary effects (PS)13.4 DESIGN
CRITERIA
Columns are designed for Service, Strength, and Extreme Event limit states (AASHTO, 2012 and Caltrans, 2014). The Extreme Event I limit state must be in accordance with the current the Caltrans Seismic Design Criteria (SDC) version 1.7 (Caltrans, 2013). Columns should be designed as ductile members to deform inelastically for several cycles without significant degradation of strength or stiffness under the design earthquake demand (see SDC seismic design criteria chapters 3 and 4 for more details). Columns supporting a superstructure that is built using balanced cantilevered construction, or other unusual construction loads, are not addressed herein.
13.4.1 Limit
States
As stated above, columns are designed for three limit states:
Strength Limit State
Service Limit State
Extreme Event Limit State13.4.2 Forces
Bridge columns are subjected to axial loads, bending moments, and shears in both the longitudinal and transverse directions of the bridge.
13.5 APPROXIMATE
EVALUATION OF SLENDERNESS
EFFECTS
The slenderness of the compression member is based on the ratio of Klu/r
(AASHTO 5.7.4.3), while the effective length factor, K (AASHTO 4.6.2.5), is to compensate for rotational and transitional boundary conditions other than pinned ends.
Theoretical and design values of K for individual members are given in AASHTO Table C4.6.2.5.-1.
Slenderness s effect is ignored if:
Chapter 13 – Concrete Columns 13-3
Klu/r < 34 – 12 (M1 / M2) (members braced against sidesway) where:
M1 = smaller end moment, should be positive for single curvature flexure
M2 = larger end moment, should be positive for single curvature flexure
lu = unsupported length of a compression member
r = radius of gyration
= 0.25 times the column diameter for circular columns
= 0.3 times the column dimension in the direction of buckling for rectangular columns
If slenderness ratio exceeds the above-mentioned limits, the moment magnification procedure (AASHTO 4.5.3.2.2b) can approximate the analysis.
Note: If Klu/r exceeds 100, columns may experience appreciable lateral deflections
resulting from vertical loads or the combination of vertical loads and lateral loads. For this case, a more detailed second-order non-linear analysis should be considered, including the significant change in column geometry and stiffness.
13.5.1
Moment Magnification Method
The factored moments may be increased to reflect effects of deformation as follows:
Mc = b M2b + s M2s (AASHTO 4.5.3.2.2b-1)
where:
Mc = magnified factored moment
M2b= moment on compression member due to factored gravity loads that result
in no sideway, always positive
M2s = moment on compression member due to factored lateral or gravity loads that result in sideway, , greater than lu/1500, always positive
b = moment magnification factor for compression member braced against
sidesway
s = moment magnification factor for compression member not braced against
sidesway
The moment magnification factors (band s) are defined as follows:
1 1 e k u m b P P C (AASHTO 4.5.3.2.2b-3)
Chapter 13 – Concrete Columns 13-4 1 1 s u k e P P (AASHTO 4.5.3.2.2b-4)
For members braced against sideway sis taken as one unless analysis indicates a
lower value.For members not braced against sideway bis to be determined as for a
braced member andsfor an unbraced member. Pu = factored axial load
Pe = Euler buckling load, which is determined as follows:
2 ) ( 2 u Kl I c E e P
Ec = the elastic modulus of concrete
I = moment of inertia about axis under consideration
k = stiffness reduction factor; 0.75 for concrete members and 1 for steel
members
Cm = a factor, which relates the actual moment diagram to an equivalent uniform
moment diagram, is typically taken as one
However, in the case where the member is braced against sidesway and without transverse loads between supports, Cm may be based on the following expression:
b b m
M
M
C
2 10.4
0.6
(AASHTO 4.5.3.2.2b-6)To compute the flexural rigidity EI for concrete column in determining Pe,
AASHTO 5.7.4.3 (AASHTO, 2012) recommends that the larger of the following be used: 5 1 c g s s d E I E I EI (AASHTO 5.7.4.3-1) 2.5 1 c g d E I EI (AASHTO 5.7.4.3-2) where:
Ig = the gross moment of inertia (in.4) Es = elastic modulus of reinforcement (ksi)
Is = moment of inertia of longitudinal steel about neutral axis (ksi)
d = ratio of maximum factored permanent load moment to the maximum
Chapter 13 – Concrete Columns 13-5
P
13.6 COMBINED
AXIAL
AND
FLEXURAL STRENGTH
13.6.1 Interaction
Diagrams
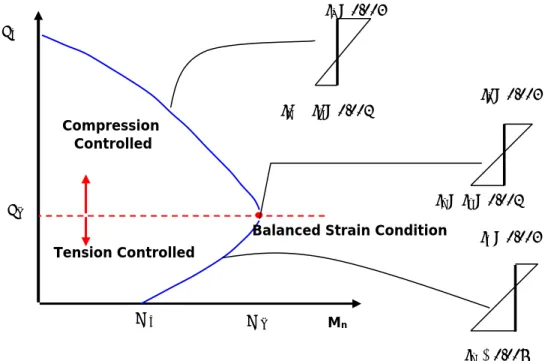
Flexural resistance of a concrete member is dependent upon the axial force acting on the member. Interaction diagrams for a reinforced concrete section are created assuming a series of strain distributions and computing the corresponding moments and axial forces. The results are plotted to produce an interaction diagram as shown in Figure 13.6-1.
Figure 13.6-1 Typical Strength Interaction Diagram for Reinforced Concrete Section with Grade 60 Reinforcement
When combined axial compression and bending moment act on a member having a low slenderness ratio and where column buckling is not a possible mode of failure, the strength of the member is governed by the material strength of the cross section. For this so–called short column, the strength is achieved when the extreme concrete compression fiber reaches the strain of 0.003. In general, one of three modes of failure will occur: tension controlled, compression controlled, or balanced strain condition (AASHTO 5.7.2.1). These modes of failure are detailed below:
Mn
Tension Controlled
Balanced Strain Condition Compression Controlled c = 0.003 s ≤y = 0.002 c = 0.003 s = y = 0.002 c = 0.003 s ≥ 0.005 Pb Mb Mo Po
Chapter 13 – Concrete Columns 13-6
Tension controlled: Sections are tension controlled when the net tensile strain in the extreme tension steel is equal to or greater than 0.005 just as the concrete in compression reaches its assumed strain limit of 0.003.
Compression controlled: Sections are compression controlled when the net tensile strain in the extreme tension steel is equal to or less than the net tensile strain in the reinforcement (y = 0.002) at balanced strain
condition at the time the concrete in compression reaches its assumed strain limit of 0.003.
Balanced strain condition: Where compression strain of the concrete (c = 0.003) and yield strain of the steel (for Grade 60 reinforcementy = 0.002) are reached simultaneously, the strain is in a balanced
condition.
13.6.2 Pure
Compression
For members with spiral transverse reinforcement, the axial resistance is based on:
Pr=Pn= Po = fcAgAstAst fy(AASHTO
For members with tie transverse reinforcement, the axial resistance is based on:
Pr =Pn= Po = fcAgAstAst fy AASHTO
where:
Pr = factored axial resistance
Pn = nominal axial resistance, with or without flexure
= resistance factor specified in AASHTO 5.5.4.2
Po= nominal axial resistance of a section at zero eccentricity
fc = specified strength of concrete at 28 days, unless another age is specified Ag= gross area of section
Ast = total area of main column reinforcement fy = specified yield strength of reinforcement
Chapter 13 – Concrete Columns 13-7
13.6.3 Biaxial
Flexure
AASHTO 5.7.4.5 specifies the design of non-circular members subjected to biaxial flexure and compression based on the stress and strain compatibility using one of the following approximate expressions:
For the factored axial load, Pu≥ 0.1fcAg
1 Prxy 1 Prx 1 Pry 1 Po (AASHTO 5.7.4.5-1) where: Po = 0.85fc (Ag– Ast) + Astfy (AASHTO 5.7.4.5-2)
For the factored axial load, Pu ≤ 0.1fcAg
1 ry uy rx ux M M M M (AASHTO 5.7.4.5-3) where:
Prxy = factored axial resistance in biaxial flexure
Prx = factored axial resistance determined on the basis that only eccentricity ey is
present
Pry = factored axial resistance determined on the basis that only eccentricity ex is present
Pu = factored applied axial force
Mux = factored applied moment about x axis Muy = factored applied moment about y axis
Mrx = uniaxial factored flexural resistance of a section about x axis corresponding
to the eccentricity produced by the applied factored axial load and moment
Mry = uniaxial factored flexural resistance of a section about y axis corresponding
Chapter 13 – Concrete Columns 13-8
13.7 COLUMN
FLEXURAL DESIGN PROCEDURE
Column flexure design steps for permanent and transient loads are presented in the following sub-sections.
13.7.1 Longitudinal
Analysis
(CTBridge)
Perform a longitudinal analysis of the bridge under consideration using Caltrans CTBridge software. Results will determine:
Axial load (Ax) and longitudinal moment (Mz) at top of the column for
DC and DW
Maximum unfactored axial load (Ax) and associated longitudinal moment
(Mz) of design vehicular live loads for one lane per bent
Maximum unfactored longitudinal moment (Mz) and associated axialload (Ax) of design vehicular live loads for the one lane per bent
13.7.2
Transverse Analysis (CSiBridge)
Perform a transverse analysis of bent cap (BDP Chapter 12, Bent-Cap) using commercial software CSiBridge. Results of the analysis is used to determine:
Column axial load (P) and transverse moment (M3) for DC and DW Maximum axial load (P) and associated transverse moment (M3) for
design vehicular live loads
Maximum transverse moment (M3) and associated axial load (P) for
design vehicular live loads
Note: WinYIELD (Caltrans, 2008) uses the x-axis for longitudinal direction and y -axis for the transverse direction. The CTBridge output renames Mz as Mx and Ax as P.
The CSiBridge output renames the transverse moment, M3, as My.
13.7.3
Column Live Load Input Procedure
13.7.3.1 Output from Longitudinal 2D Analysis (CTBridge)
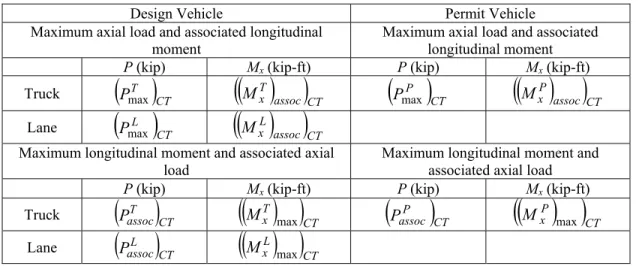
Column unfactored live load forces and moments for one lane from longitudinal analysis (CTBridge) are summarized in Table 13.7-1 below:
Chapter 13 – Concrete Columns 13-9
Table 13.7-1 Unfactored Bent Reactions for One Lane, Dynamic Load Allowance Factors Not Included
Design Vehicle Permit Vehicle
Maximum axial load and associated longitudinal
moment Maximum axial load and associated longitudinal moment
Ax(kip) Mz(kip-ft) Ax(kip) Mz(kip-ft)
Truck
AmaxT CT
MTz assoc
CT
AmaxP CT
MzP assoc
CT Lane
AmaxL CT
MzL assoc
CTMaximum longitudinal moment and associated
axial load Maximum longitudinal moment and associated axial load
Ax(kip) Mz(kip-ft) Ax(kip) Mz(kip-ft)
Truck
ATassoc
CT
MzT max
CT
AassocP
CT
CT P zM max
Lane
AassocL
CT
MzL max
CTwhere:
AmaxT CT = maximum axial force for truck load
MTz assoc
CT = longitudinal moment associated with maximum axial force for truck load
AmaxL CT = maximum axial force for lane load
MzL assoc
CT = longitudinal moment associated with maximum axial force for lane load
AmaxP CT = maximum axial force for permit vehicle load
MzP assoc
CT = longitudinal moment associated with maximum axial force for permitvehicle load
T
CTz
M max = maximum longitudinal moment for truck load
AassocT
CT = axial force associated with maximum longitudinal moment for truck load
MzL max = maximum longitudinal moment for lane load
AassocL
CT = axial force associated with maximum longitudinal moment for lane load
P
CTz
M max = maximum longitudinal moment for permit vehicle load
AassocP
CT = axial force associated with maximum longitudinal moment for permit vehicleChapter 13 – Concrete Columns 13-10
13.7.3.2 Output from 2D Transverse Analysis (CSiBridge)
Axial forces presented in Table 13.7-1 are converted to two pseudo wheel loads including dynamic allowance factor to be used in transverse analysis (see BDP Chapter 12) to be used in transverse analysis.
Include dynamic load allowance factor for Table 13.7-1.
Column reaction = 1.33(reaction/2) for truck = 1(reaction/2) for lane = 1.25(reaction/2) for P-15
The transverse analysis column forces for pseudo truck and permit wheel loadings are presented in Table 13.7-2.
Table 13.7-2 Unfactored Column Reaction, Including Dynamic Load Allowance Factors
Design Vehicle Permit Vehicle
Maximum axial load and associated transverse
moment Maximum axial load and associated transverse moment
P (kip) M3(kip-ft) P (kip) M3(kip-ft)
Truck
PmaxT CSi
M3T assoc
CSi
PmaxP CSi
M3P assoc
CSiMaximum transverse moment and associated axial
load Maximum transverse moment and associated axial load
P (kip) M3(kip-ft) P (kip) M3(kip-ft)
Truck
PassocT CSi
M3T max
CSi
P CSi assocP
M3P max
CSiwhere:
CSiT
Pmax = maximum axial force due to pseudo truck wheel loads
M3T assoc
CSi = transverse moment associated with maximum axial force due to pseudo truckwheel loads.
PmaxP Csi = maximum axial force due to pseudo permit wheel loads
M3P assoc
CSi= transverse moment associated with maximum axial force due to pseudo permit wheel loads
MT
CSimax
3 = maximum transverse moment due to pseudo truck wheel loads
PassocT CSiChapter 13 – Concrete Columns 13-11
MP
CSimax
3 = maximum transverse moment due to pseudo permit wheel loads
PassocP CSi = axial force associated with maximum transverse moment due to pseudo permitwheel loads
13.7.3.3 CTBridge output includingDynamic Load Allowance Factors
Multiply dynamic allowance factor for values in Table 13.7-1 divided by number of bent columns to get reactions per column (Table 13.7-3).
Table 13.7-3 Unfactored Column Reactions for One Lane, Including Dynamic Load Allowance Factors
Design Vehicle Permit Vehicle
Maximum axial load and associated longitudinal
moment Maximum axial load and associated longitudinal moment
P (kip) Mx(kip-ft) P (kip) Mx(kip-ft)
Truck
PmaxT CT
MTx assoc
CT
PmaxP CT
MxP assoc
CT Lane
PmaxL CT
MxL assoc
CTMaximum longitudinal moment and associated axial load
Maximum longitudinal moment and associated axial load
P (kip) Mx(kip-ft) P (kip) Mx(kip-ft)
Truck
PassocT CT
MTx max
CT
CT P assocP
MxP max
CTLane
PassocL CT
MxL max
CT13.7.3.4 Truck and Lane Loads for Transverse Analysis (CSiBridge)
Split truck reactions results of transverse analysis (Table 13.7-3) into truck and lane loads as follows:
Ratio of truck load per design vehicle =
1max max max R P P P CT L CT T CT T
Ratio of lane load per design vehicle =
2max max max R P P P CT L CT T CT L
Unfactored column reactions (Table 13.7-4) including dynamic load allowance (CSiBridge):
R1 = truck load ratio of design vehicle (values of Table 13.7-2)
Chapter 13 – Concrete Columns 13-12
Table 13.7-4 Unfactored Column Reactions, Including Dynamic Load Allowance Factors
Design Vehicle Permit Vehicle
Maximum axial load and associated transverse
moment Maximum axial load and associated transverse moment
P (kip) My(kip-ft) P (kip) My(kip-ft)
Truck
PmaxT CSi
MTy assoc
CSi
PmaxP CSi
MyP assoc
CSi Lane
PmaxL CSi
CSi assoc L y M
Maximum transverse moment and associated axial
load Maximum transverse moment and associated axial load
P (kip) My(kip-ft) P (kip) My(kip-ft)
Truck
PassocT CSi
CSi T y M max
P CSi assoc P
CSi P y M maxLane
PassocL CSi
MyL max
CSi13.7.3.5 Combination of Longitudinal and Transverse Output
Combine forces and moments of Tables 13.7-3 and 13.7-4.
Case 1: Maximum My (Table 13.7-5) Case 2: Maximum Mx (Table 13.7-6) Case 3: Maximum P (Table 13.7-7)
Table 13.7-5 Case 1: Maximum Transverse Moment (My)
P-truck H-truck Lane
My (kip-ft)
CSi P y M max
CSi T y M max
CSi L y M max Mx (kip-ft)
xP assoc
CT CT P CSi P assoc M P P . max
Tx assoc
CT CT T CSi T assoc M P P max
xL assoc
CT CT L CSi L assoc M P P maxChapter 13 – Concrete Columns 13-13
Table 13.7-6 Case 2: Maximum Longitudinal Moment (Mx)
P-truck H-truck Lane
My (kip-ft)
assoc
CSi P y CT P CT P assoc M P P . . max .
assoc
CSi T y CT T CT T assoc M P P . . max .
assoc
CSi L y CT L CT L assoc M P P . . max . Mx (kip-ft)
CT P x CT P CSi P M P P max . max max
CT T x CT T CSi T M P P max . max max
CT L x CT L CSi L M P P max . max max P (kip)
P CSi CT P CT P assoc P P P . max max .
T CSi CT T CT T assoc P P P . max max .
L CSi CT L CT L assoc P P P . max max . Table 13.7-7 Case 3: Maximum Axial Load (P)
P-truck H-truck Lane
My
(kip-ft)
assoc
CSi P y M .
CSi assoc T y M .
CSi assoc L y M . Mx (kip-ft)
xP assoc
CT CT P CSi P M P P . max max
xT assoc
CT CT T CSi T M P P . max max
xL assoc
CT CT L CSi L M P P . max max P (kip)
PmaxP CSi
PmaxT CSi
PmaxL CSi13.7.3.6 WinYIELD Live Load Input
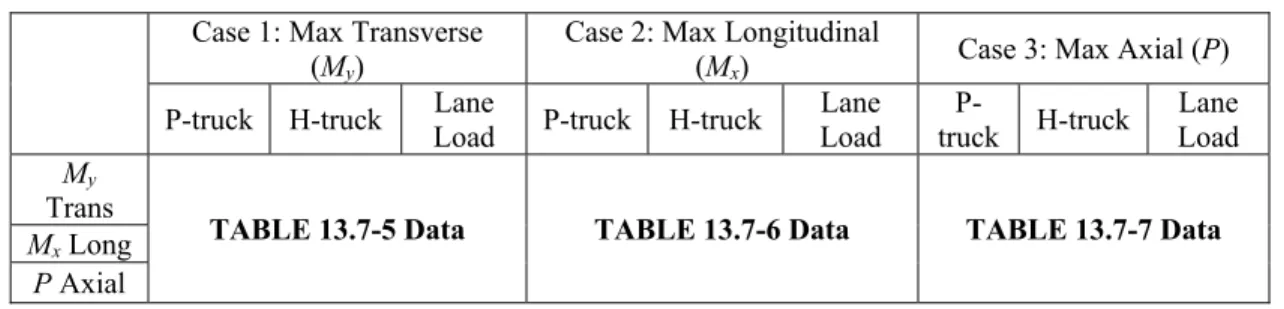
Transfer Tables 13.7-5, 13.7-6, and 13.7-7 data into Table 13.7-8, which will be used as load input for the WinYIELD program.
Table 13.7-8 Input for Column Live Load Analysis of WinYIELD Program.
Case 1: Max Transverse (My)
Case 2: Max Longitudinal
(Mx) Case 3: Max Axial (P)
P-truck H-truck Lane Load P-truck H-truck Load Lane truck P- H-truck Load Lane
My
Trans
TABLE 13.7-5 Data TABLE 13.7-6 Data TABLE 13.7-7 Data
Mx Long
Chapter 13 – Concrete Columns 13-14
13.7.4
Wind Loads (WS, WL)
Calculate wind moments and axial loads for column (see BDP Chapter 3).
13.7.5
Braking Force (BR)
Calculate braking force moments and axial load for column (see BDP Chapter 3).
13.7.6
Prestress Shortening Effects (CR, SH)
Calculate prestress shortening moments as shown in design example (13.10).
13.7.7
Prestressing Secondary Effect Forces (PS)
Calculate secondary prestress moments and axial loads (from CTBridge output).
13.7.8
Input Loads into WinYIELD
Transfer all loads into WinYIELD’s load table.
13.7.9 Column
Design/Check
Chapter 13 – Concrete Columns 13-15
13.8
COLUMN SHEAR DESIGN PROCEDURE
Column shear demand values are calculated from longitudinal and transverse analyses.
13.8.1 Longitudinal
Analysis
Perform a longitudinal analysis (CTBridge) to determine:
Longitudinal shear (Vy) and moment (Mz) for DC and DW at top and
bottom of the column.
Maximum longitudinal shear (Vy) and associated moment (Mz) for design
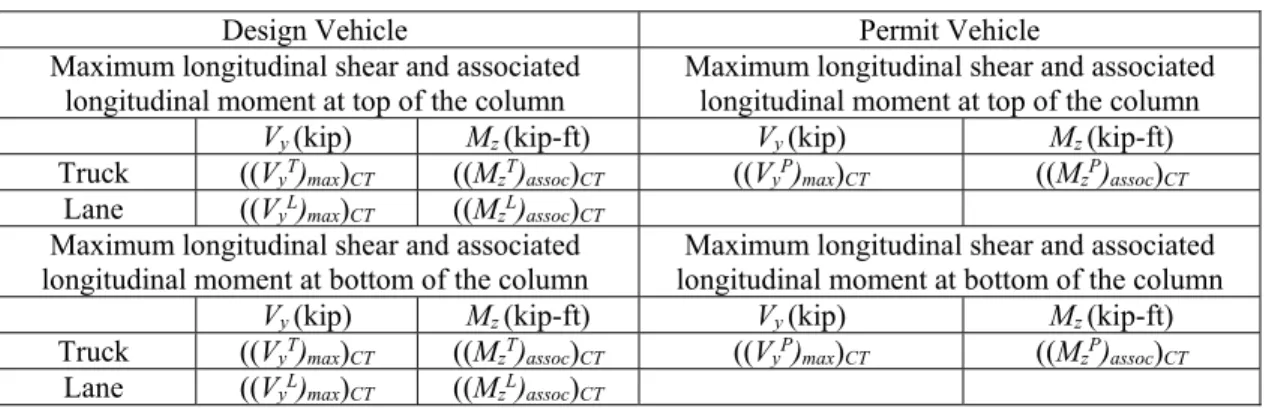
vehicular live loads at top and bottom of the bent unfactored reactions for one lane as shown in Table 13.8-1.
Table 13.8-1 Longitudinal Unfactored Bent Reactions for One Lane, Dynamic Load Allowance Factors Not Included.
Design Vehicle Permit Vehicle
Maximum longitudinal shear and associated
longitudinal moment at top of the column Maximum longitudinal shear and associated longitudinal moment at top of the column
Vy (kip) Mz (kip-ft) Vy (kip) Mz (kip-ft)
Truck ((VyT)max)CT ((MzT)assoc)CT ((VyP)max)CT ((MzP)assoc)CT
Lane ((VyL)max)CT ((MzL)assoc)CT
Maximum longitudinal shear and associated longitudinal moment at bottom of the column
Maximum longitudinal shear and associated longitudinal moment at bottom of the column
Vy (kip) Mz (kip-ft) Vy (kip) Mz (kip-ft)
Truck ((VyT)max)CT ((MzT)assoc)CT ((VyP)max)CT ((MzP)assoc)CT
Lane ((VyL)max)CT ((MzL)assoc)CT
where:
((VyT)max)CT = maximum longitudinal shear at top and bottom of column for truck
load
((MzT)assoc)CT = longitudinal moment at top and bottom of column associated with
maximum shear
for truck load
((VyL)max)CT = maximum longitudinal shear at top and bottom of column for lane
load
((MzL)assoc)CT = longitudinal moment at top and bottom of column associated
with ,aximum shear for lane load
((VyP)max)CT = maximum longitudinal shear at top and bottom of column for permit
load
((MzP)assoc)CT = longitudinal moment at top and bottom of column associated with
Chapter 13 – Concrete Columns 13-16
13.8.2 Transverse
Analysis
Perform a transverse analysis (CSiBridge) to determine:
Column transverse shears (V2) and associated moment (M3) for DC and
DW
Maximum transverse shear (V2) and associated moment (M3) for designvehicular live loads at top and bottom of the column with dynamic load allowance factors included, as shown in Table 13.8-2
Table 13.8-2 Transverse Unfactored Column Reactions Including Dynamic Load Allowance Factors
Design Vehicle Permit Vehicle
Maximum transverse shear and associated
transverse moment at top of the column Maximum transverse shear and associated transverse moment at top of the column
V2 (kip) M3 (kip-ft) V2 (kip) M3 (kip-ft)
Truck ((V2T)max)CSi ((M3T)assoc)CSi ((V2P)max)CSi ((M3P)assoc)CSi
Maximum transverse shear and associated transverse moment at bottom of the column
Maximum transverse shear and associated transverse moment at bottom of the column
V2 (kip) M3 (kip-ft) V2 (kip) M3 (kip-ft)
Truck ((V2T)max)CSi ((M3T)assoc)CSi ((V2P)max)CSi ((M3P)assoc)CSi
where:
((V2T)max)CSi = maximum longitudinal shear at top and bottom of column for truck
load
((M3T)assoc)CSi = transverse moment at top and bottom of column associated with
maximum shearfor truck load
((V2P)max)CSi = maximum transverse shear at top and bottom of column for permit
load
((M3P)assoc)CSi = transverse moment at top and bottom of column associated with
maximum shear for permit load
13.8.3
Column Live Load Input Procedure
13.8.3.1 Output from Longitudinal 2D Analysis (CTBridge)
Include dynamic load allowance factors per column for CTBridge output (Table 13.8-1) and summarize the results in Table 13.8-3.
Chapter 13 – Concrete Columns 13-17
Table 13.8-3 Unfactored Column Longitudinal Shear and Associated Longitudinal Moment for One Lane, Including Dynamic Load Allowance Factors (CTBridge)
Design Vehicle Permit Vehicle
Maximum longitudinal shear and associated
longitudinal moment at top of the column Maximum longitudinal shear and associated longitudinal moment at top of the column
Vy (kip) Mz (kip-ft) Vy (kip) Mz (kip-ft)
Truck ((VyT)max)CT ((MzT)assoc)CT ((VyP)max)CT ((MzP)assoc)CT
Lane ((VyL)max)CT ((MzL)assoc)CT
Maximum longitudinal shear and associated longitudinal moment at bottom of the column
Maximum longitudinal shear and associated longitudinal moment at bottom of the column
Vy (kip) Mz (kip-ft) Vy (kip) Mz (kip-ft)
Truck ((VyT)max)CT ((MzT)assoc)CT ((VyP)max)CT ((MzP)assoc)CT
Lane ((VyL)max)CT ((MzL)assoc)CT
13.8.3.2 Output from 2D Transverse Analysis (CSiBridge)
Reform Table 13.8-2 to split truck reactions of CSiBridge analysis (Table 13.8-2) into truck and lane loads (13.7.3.4) as shown in Table 13.8-4.
Table 13.8-4 Unfactored Column Reactions, Including Dynamic Load Allowance Factors (CSiBridge)
Design Vehicle Permit Vehicle
Maximum transverse shear and associated
longitudinal moment at top of the column Maximum transverse shear and associated longitudinal moment at top of the column
V2(kip) M3 (kip-ft) V2(kip) M3 (kip-ft)
Truck ((V2T)max)CSi ((M3T)assoc)CSi ((V2P)max)CSi ((M3P)assoc)CSi
Lane ((V2L)max)CSi ((M3L)assoc)CSi
Maximum transverse shear and associated
longitudinal moment at bottom of the column longitudinal moment at bottom of the column Maximum transverse shear and associated
V2(kip) M3 (kip-ft) V2(kip) M3 (kip-ft)
Truck ((V2T)max)CSi ((M3T)assoc)CSi ((V2P)max)CSi ((M3P)assoc)SAP
Chapter 13 – Concrete Columns 13-18 Since the longitudinal shears and associated longitudinal moments are per one lane from CTBridge, the total longitudinal shears and associated longitudinal moments should be calculated as shown in Table 13.8-5.
Table 13.8-5 Total Longitudinal Shear (Vy) and Associated Longitudinal Moment (Mz)
P-truck H-truck Lane
(Vy)max (kip)
CT P y CT P CSi P V P P max max max
CT T y CT T CSi T V P P max max max
CT L y CT L CSi L V P P max max max (Mz)assoc. (kip-ft)
zP assoc
CT CT P CSi P M P P max max
Tz assoc
CT CT T CSi T Mz P P max max
zL assoc
CT CT L CSi L M P P max max Determine factored shear and associated factored moment for Strength I and Strength II Limit States.
Design for shear for controlling case as per AASHTO 5.8.3.
The following example in Section 13.10 will demonstrate the shear design in details.
13.9
COLUMN SEISMIC DESIGN PROCEDURE
Column seismic design and details shall follow the Caltrans Seismic Design Criteria 1.7.
13.10 DESIGN
EXAMPLE
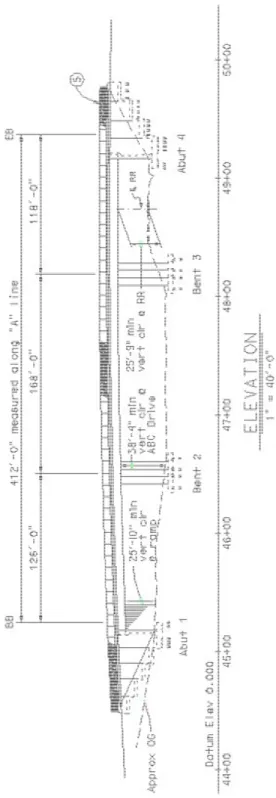
The bridge shown in Figures 13.10-1 and 13.10-2 are a three-span PS/CIP box girder bridge with 20º skew and two column bents. The superstructure depth is 6.75 ft. Columns’ heights from top of footing to superstructure soffit are 44 ft at bent two and 47 ft at bent three. The columns are round with a diameter of 6 ft. The centerline distance between columns is 34 ft.
Chapter 13 – Concrete Columns 13-19
13.10.1
Design Column One at Bent Two
Chapter 13 – Concrete Columns 13-20
Chapter 13 – Concrete Columns 13-21
13.10.2
Flexural Check of Main Column Reinforcement (
A
s)
13.10.2.1 Longitudinal Analysis
From CTBridge output, determine Mzfor Dead Load (DC) and Added Dead Load
(DW).
Table 13.10-1 Dead Load Unfactored Column Forces
Table 13.10-2 Additional Dead Load Unfactored Column Forces.
Controlling moments, Mz, are as follows:
DC Mz= -925.2 kip-ft
Chapter 13 – Concrete Columns 13-22
13.10.2.2 Design Vehicular Live Loads
From CTBridge output, determine bent two unfactored reactions for one lane (no dynamic load allowance factors) for the design vehicle as:
Maximum Ax and associated Mz at top of the column Maximum Mz and associated Ax at top of the column
Table 13.10-3 Live Load, Controlling Unfactored Bent Reactions
From the CTBridge output, determine unfactored bent two reactions for one lane (no dynamic load allowance factors) of permit vehicle load as follows:
Maximum Ax and associated Mz at top of the column
Chapter 13 – Concrete Columns 13-23
Table 13.10-4 Bent 2 Reactions, LRFD Permit Vehicle
13.10.2.3 Transverse Analysis
From CSiBridge output, determine the axial loads and transverse moments for DC and DW.
Chapter 13 – Concrete Columns 13-24
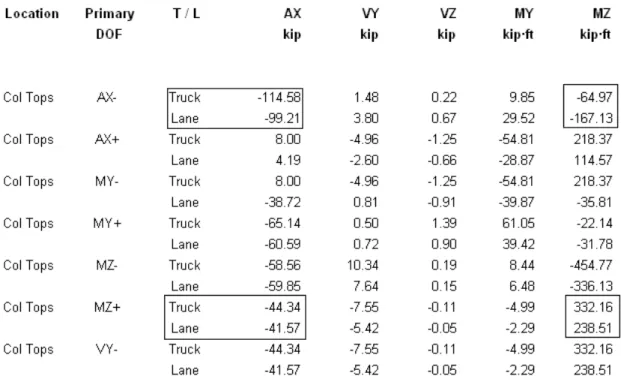
13.10.2.4 Live Loads
From CSiBridge output, determine the unfactored column reactions for design vehicle including the dynamic load allowance factors which are:
Maximum P and associated M3 Maximum M3 and associated P
Table 13.10-6 Maximum Axial Load (P) for Design Vehicle
Table 13.10-7 Maximum Longitudinal Moment (M3) for Design Vehicle
From CSiBridge output, determine the unfactored column reactions for permit vehicle including the dynamic load allowance factors which are:
Maximum P and associated M3 Maximum M3 and associated P
Chapter 13 – Concrete Columns 13-25
Table 13.10-8 Maximum Axial Load (P) for Permit Vehicle.
Chapter 13 – Concrete Columns 13-26
13.10.2.5 Output from Longitudinal 2D Analysis (CTBridge)
Column unfactored live load forces and moments for one lane from longitudinal analysis (CTBridge) are presented in Table 13.10-10.
Table 13.10-10 Unfactored Bent Reactions for One Lane, Dynamic Load Allowance Factors Not Included
Design Vehicle Permit Vehicle
Maximum axial load and associated longitudinal
moment Maximum axial load and associated longitudinal moment
Ax (kip) Mz(kip-ft) Ax(kip) Mz (kip-ft)
Truck -115 -65 -360 -201
Lane -99 -167 Maximum longitudinal moment and associated
axial load
Maximum longitudinal moment and associated axial load
Ax (kip) Mz (kip-ft) Ax (kip) Mz(kip-ft)
Truck -44 332 -231 -1486
Lane -42 239
13.10.2.6 Output from Transverse 2D Analysis (CSiBridge)
Two pseudo wheel loads including dynamic allowance factor to be used in transverse analysis (see Section 13.7.3.2).
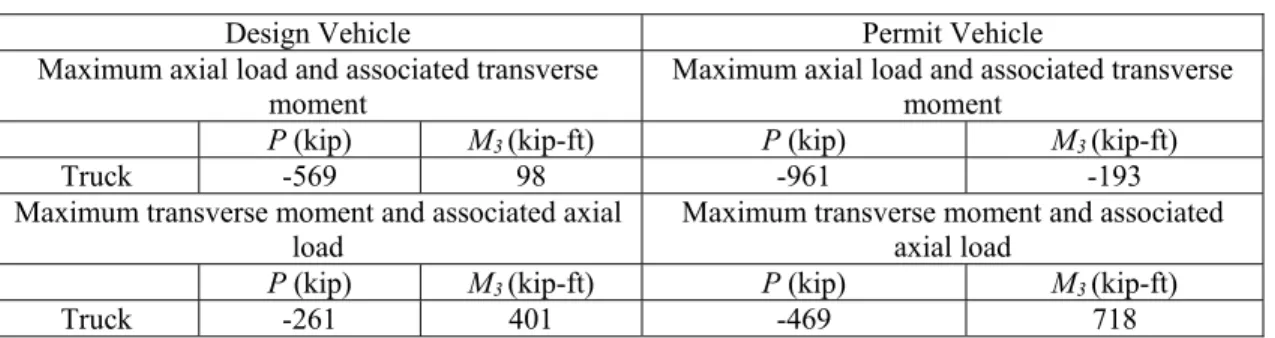
The transverse analysis column forces for pseudo truck and permit wheel loadings are presented in Table 13.10-11.
Table 13.10-11 Unfactored Column Reaction, Including Dynamic Load Allowance Factors.
Design Vehicle Permit Vehicle
Maximum axial load and associated transverse
moment Maximum axial load and associated transverse moment
P (kip) M3(kip-ft) P (kip) M3(kip-ft)
Truck -569 98 -961 -193
Maximum transverse moment and associated axial
load Maximum transverse moment and associated axial load
P (kip) M3(kip-ft) P (kip) M3(kip-ft)
Chapter 13 – Concrete Columns 13-27
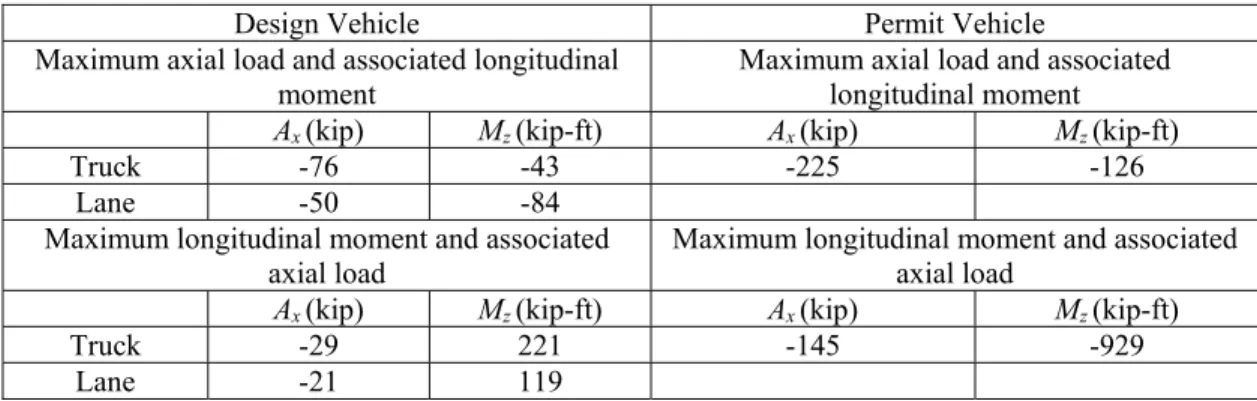
13.10.2.7 Unfactored Column Reactions for One Lane, Including Impact (CTBridge)
Multiply dynamic allowance factor for values in Table 13.10-10 and calculate reaction per column (Table 13.10-12).
Table 13.10-12 Unfactored Column Reactions for One Lane, Including Dynamic Load Allowance Factors (CTBridge)
Design Vehicle Permit Vehicle
Maximum axial load and associated longitudinal
moment Maximum axial load and associated longitudinal moment
Ax(kip) Mz (kip-ft) Ax (kip) Mz (kip-ft)
Truck -76 -43 -225 -126
Lane -50 -84 Maximum longitudinal moment and associated
axial load
Maximum longitudinal moment and associated axial load
Ax(kip) Mz (kip-ft) Ax(kip) Mz (kip-ft)
Truck -29 221 -145 -929
Lane -21 119
13.10.2.8 Unfactored Column Reactions, Including Dynamic Load Allowance Factors (CSiBridge)
Split the truck reactions results of transverse analysis (Section 13.7.3.4) into truck and lane loads as follows:
Ratio of truck load per design vehicle = (76.2) / (76.2 + 49.605) = 0.606 Ratio of lane load per design vehicle = (49.6) / (76.2 + 49.605) = 0.394 Truck load of design vehicle = 0.606 (values of Table 13.10-11) Lane load of design vehicle = 0.394 (values of Table 13.10-11)
Table 13.10-13 summarizes the truck and lane loads for both design and permit vehicles of transverse analysis.
Table 13.10-13 Unfactored Column Reactions, Including Dynamic Load Allowance Factors (CSiBridge)
Design Vehicle Permit Vehicle
Maximum axial load and associated transverse moment
Maximum axial load and associated transverse moment
P (kip) M3 (kip-ft) P (kip) M3 (kip-ft)
Truck -345 59 -961 -193
Lane -224 39 Maximum transverse moment and associated axial
load Maximum transverse moment and associated axial load
P (kip) M3 (kip-ft) P (kip) M3 (kip-ft)
Truck -158 243 -469 718
Chapter 13 – Concrete Columns 13-28 Combine load results as shown in Tables 13.7-5, 13.7-6, 13.7-7, and 13.7-8 to get WinYEILD input loads as shown in Table 13.10-14.
Table 13.10-14 WinYIELD Column Live Load Input
Case 1 Max
Transverse-My
Case 2 Max
Longitudinal-Mx Case 3 Max Axial-P
P-Truck H-Truck Lane Load P-Truck H-Truck Lane Load P-Truck H-Truck Lane Load My-Trans (kip-ft) 718 243 158 -124 23 16 -193 60 39 Mx-Long (kip-ft) -262 -90 -173 -3965 1003 533 -537 -195 -377 P-Axial (kip) -469 -158 -103 -617 -132 -95 -961 -345 -224 13.10.2.9 Wind Load (WS, WL) Wind on structure (WS):
Average bridge height = 50.25 ft
Assume bridge is in “Open Country,” from AASHTO Table 3.8.1.1-1
Vo = 8.2 mph Zo = 0.23 ft
o B o DZ V ZZ V V V 2.5 30 ln (AASHTO 3.8.1.1-1)
110.4 mph 0.23 50.25 ln 100 100 8.2 5 . 2 DZV (design wind velocity)
2 B DZ B D V V P
P for wind skew direction = 0˚ (AASHTO 3.8.1.2.1-1) From AASHTO Table 3.8.1.2.1-1
PB = 0.05 for superstructure (skew angle of wind = 0˚) PB = 0.04 for columns (skew angle of wind = 0˚)
ksf 0.061 100 110.4 0.05 2 D P (Superstructure) ksf 049 . 0 100 4 . 110 04 . 0 2 D P (Columns)
The base wind pressure, PB, for various angles of wind directions may be taken
Chapter 13 – Concrete Columns 13-29 where:
PB = base wind pressure, corresponding to VB =100 mph PD = wind pressure on structures, LRFD equation 3.8.1.2.1-1 VDZ = design wind velocity (mph) at design elevations
VB = base wind velocity of 100 mph at 30 ft height Vo = friction velocity (mph), LRFD Table 3.8.1.1-1
Z = height of structure (ft) at which wind loads are being calculated as measured from low ground, or from water level, > 30 ft
Zo = friction length (ft) upstream fetch, LRFD Table 3.8.1.1-1
The wind pressure, PD, is calculated at various angels using the base wind
pressure, PB, as per AASHTO Table 3.8.1.2.2-1. Table 13.10-15 lists the wind
pressure, PD, at various angles of wind.
Table 13.10-15 Wind Pressure at Various Skew Angles of Wind
Superstructure Columns
Skew angle of
wind (degrees) (PD)Trans (ksf) (PD)Long(ksf) (PD)Trans (ksf) (PD)Long(ksf)
0 0.061 0 0.049 0 15 0.054 0.007 0.043 0.006 30 0.050 0.015 0.040 0.012 45 0.040 0.020 0.032 0.016 60 0.021 0.023 0.017 0.019 Load on span = (6.75 + 2.67)PD Load on columns = (6)PD
Loads on both superstructure and columns at various winds skew directions are shown in Table 13.10-16:
Table 13.10-16 Wind Loads at Various Skew Angles of Wind
Superstructure Columns
Skew angle of
wind (degrees) (PD)Trans (kip/ft) (PD)Long(kip/ft) (PD)Trans (kip/ft) (PD)Long(kip/ft)
0 0.575 0 0.294 0
15 0.509 0.066 0.258 0.036
30 0.471 0.141 0.24 0.072
45 0.377 0.188 0.192 0.096
Chapter 13 – Concrete Columns 13-30 Model wind as a user-defined load in CTBridge as shown below:
Figure 13.10-3 User Defined Loads for Wind Loads
From CTBridge output:
o Case of maximum transverse wind takes place at wind direction with
skew = 0˚
o Case of maximum longitudinal wind takes place at wind direction
Chapter 13 – Concrete Columns 13-31
Table 13.10-17 User Loads, Unfactored Column Forces, WS Trans Skew 0˚
Table 13.10-18 User Loads, Unfactored Column Forces, WS Trans Skew 60˚.
Chapter 13 – Concrete Columns 13-32
Wind on live load (WL):
Apply 0.1k/ft acting at various angles (AASHTO Table 3.8.1.3-1) as shown in Table 13.10-19:
Table 13.10-19 Wind on Live Load (WL) at Various Angles
Skew angle of wind
(degrees) Normal component (k-ft) Parallel component (k-ft)
0 0.1 0
15 0.088 0.012
30 0.082 0.024
45 0.066 0.032
60 0.034 0.038
Using CTBridge for wind on live load, the results are:
o Case of maximum transverse wind takes place at skew angle of
wind = 0˚
o Case of maximum longitudinal wind takes place at wind direction
with skew = 60˚
Chapter 13 – Concrete Columns 13-33
Table 13.10-21 User Loads, Unfactored Column Forces, WL Trans Skew 60˚
Table 13.10-22 Summary of Wind Loads Reactions for Column 1 at Bent 2
Wind on Structure Wind on Live Load Max. Trans. Max. Long. Max. Trans. Max. Long.
My (kip-ft) 474 -468 80 -74
Mx (kip-ft) 205 1102 34 173
P (kip) 34 -7 6 -1
13.10.2.10 Braking Force (BR)
The braking force (AASHTO 3.6.4) shall be taken as the greater of:
25% design truck = 0.25(72) = 18 kips
25% design tandem = 0.25(50) = 12.5 kips
5% design truck + lane = 0.05[72 + 0.64(412)] = 16.8 kips
5% design tandem + lane = 0.05[50 + 0.64(412)] = 15.7 kips Controlling force = 18 kips
Number of lanes = [58.83-2(1.42)]/12 = 4.66 Use four lanes, MPF = 0.65
Total breaking force = 18(4) (0.65) = 46.8 kips
Apply the braking force longitudinally then design for the moment and shear force effects. The braking force can be modeled in CTBridge as a user defined load in the direction of local X direction as shown below:
Chapter 13 – Concrete Columns 13-34
Figure 13.10-4 User Defined Loads for Braking Force
Braking forces output from CTBridge are shown in Table 13.10-23.
Chapter 13 – Concrete Columns 13-35
13.10.2.11 Thermal Effects (TU)
For a three-span bridge, the point of no movement is shown in Figure 13.10-5:
Figure 13.10-5 Point of No Movement
Design temperature ranges from 10 to 80˚F (AASHTO Table 3.12.2.1-1) For normal weight concrete ˚F (AASHTO 5.4.2.2)
Load factor for moment in column due to thermal movement TU = 0.5
(AASHTO 3.4.1) Thermal movement = 100 ft)(12) = 0.504 in. /100 ft
' 5 . 1 1 000 , 33 K wc fc E (AASHTO 5.4.2.4-1) For f′c = 3.6 ksi, E 33,000(1)(0.15)1.5 3.6 3637 ksi
Ig r4
4 for circular column For 6 ft diameter column, Ig (3)4
4 63.6 ft 4 Point of no movement calculation:
3 3 L EI k , P = k∆ then, P3EI L3 I (two columns per bent) = 2(63.6) =127.2 ft4
kips 51 . 195 )) 12 ( 44 ( ) 1 ( ) 12 )( 2 . 127 )( 3637 ( 3 3 4 2 Bent P kips 4 . 160 )) 12 ( 47 ( ) 1 ( ) 12 )( 2 . 127 )( 3637 ( 3 3 4 3 Bent P Point of No Movement
Chapter 13 – Concrete Columns 13-36 where:
coefficient of thermal expansion
k = column stiffness = lateral displacement
L = column height
PBent2 = lateral force due to lateral displacement () of 1 in at bent-2
PBent3 = lateral force due to lateral displacement () of 1 in at bent-3
Table 13.10-24 Point Of No Movement
Units are
kips and ft Abut1 Bent2 Bent3 Abut4 SUM
P at 1inch. (kip) 0 195.5 160.4 0 355.9
Distance (D) (ft) 0 126 294 412 832
PD (kip-ft) 0 24,633 47,157.6 0 71,790.6
Distance from CL of support at Abut (X) = (71790.6 / 355.9) = 201.72 ft
Distance from point of no movement from Bent 2 = 201.72 – 126 = 75.72 ft
Note: The point of no movement can be read directly from the CTBridge output. For this example, the point of no movement is 75.72 ft from bent two, as shown in Figure 13.10-6.
Figure 13.10-6 Point of No Movement
Thermal displacement () = (0.504 / 100) (75.72) = 0.38 in.
M
TH
3
EI
g
THL
2
TU = 0.5 )) 12 ( 44 ( ) 38 . 0 ( ) 12 )( 6 . 63 )( 3637 ( 3 2 4 = 9807 kip-in. = 817 kip-ftChapter 13 – Concrete Columns 13-37 (MTH)x = M cos cos(20) = 767.6 kip-ft
(MTH)y= M sin sin(20) = 279.4 kip-ft
where:
MTH = column moment due to thermal expansion = skew angle
TU = load factor for uniform temperature
13.10.2.12 Prestress Shortening Effects (Creep and Shrinkage)
The anticipated shortening due to prestressing effects occurs at a rate of 0.63 in. per 100 ft (MTD 7-10). Displacement = 0.63 (75.72 / 100) = 0.48 in. 2
3
g csh pEI
M
L
= 4 23(3637)(63.6)(12) (0.48)
0.5=12387 kip-in.=1032 kip-ft
(44x12)
(Mcsh)x = M cos cos(20) = 970 kip-ft (Mcsh)y = M sin sin(20) = 353 kip-ft
where:
Mcsh = column moment due to prestress shortening (creep and shrinkage) p = load factor for permanent load due to creep and shrinkage
13.10.2.13 Prestress Secondary Effects (PS)
The secondary effect of prestressing after long term losses is shown in Table 13.10-25.
Chapter 13 – Concrete Columns 13-38
13.10.2.14 WinYIELD Input for Column 1 at Bent 2
Design of column reinforcement is performed by running WinYIELD starting by general form as shown in Figure 13.10-7.
Chapter 13 – Concrete Columns 13-39 Column form for circular column with diameter of 72 inches is shown in Figure 13.10-8.
Chapter 13 – Concrete Columns 13-40 Material form (Figure 13.10-9) shows concrete specified compressive strength,
fʹc= 3.6 ksi and steel rebar specified minimum yield strength, fy= 60 ksi.
Chapter 13 – Concrete Columns 13-41 Figure 13.10-10 shows the rebar form with:
Out to out distance = 72 2(2) = 68 in. (for cover = 2 in.) Assume #14 bundle total 36 and #8 hoops
Loop radius = [72 2(2) 2(1.13) 2(1.88/2)]/2 = 31.9 in.
Chapter 13 – Concrete Columns 13-42 Use AASHTO Chapter 4 to determine Kx and Ky, considering AASHTO
C4.6.2.5-1 to be used in load-1 form (Figure 13.10-11).
Chapter 13 – Concrete Columns 13-43 Load-2 (Figure 13.10-12) input data is taken from Table 13.10-14.
Figure 13.10-12 WinYIELD Load-2 Form
13.10.2.15 WinYIELD Output
Winyield output sheet (Figure 13.10-13) shows the steel reinforcement required for the column.
Figure 13.10-13 WinYIELD Output Results
The final design could be summarized as:
Provided number of bars = 18 bundle > required number of bars = 10.6 (OK) Min. clearance and spacing for #14 bundle horizontally = 7.5 in.
Chapter 13 – Concrete Columns 13-44
13.10.3 Shear Design for Transverse Reinforcement (Av)
The procedure of determining column transverse reinforcement is presented in consequent sections.
13.10.3.1 Longitudinal Analysis
From CTBridge output (Tables 13.10-26 and 13.10-27), determine longitudinal shear (Vy) and moment (Mz) at top and bottom of columns for DC and DW. Combine
output in Table 3.10-28.
Table 13.10-26 Dead Load, Unfactored Column Forces
Chapter 13 – Concrete Columns 13-45
Table 13.10-28 Longitudinal Shear (Vy) and Longitudinal Moment (Mz) for DC and DW
Top of Column Bottom of Column
DC DW DC DW
Vy(kip) 21 2.5 21 2.5
Mz (kip-ft) -925.2 -110.1 0 0
Determine maximum longitudinal shear (Vy) and associated moment (Mz) for
design vehicular live loads at top and bottom of the bent unfactored reactions for one lane as shown in Table 13.10-29.
Table 13.10-29 Unfactored Bent Reactions For Design Vehicle
Determine maximum longitudinal shear (Vy) and associated moment (Mz) for
permit vehicular live loads at top and bottom of the bent unfactored reactions for one lane as shown in Table 13.10-30.
Chapter 13 – Concrete Columns 13-46
Table 13.10-30 Unfactored Bent Reactions For Permit Vehicle
Re-arrange the longitudinal shear and moment output from CTBridge are for two columns (Table 13.10-31).
Chapter 13 – Concrete Columns 13-47
Table 13.10-31 Unfactored Bent Reactions for One Lane, Dynamic Load Allowance Factors Not Included
Design Vehicle Permit Vehicle
Maximum longitudinal shear and associated
longitudinal moment at top of the column Maximum longitudinal shear and associated longitudinal moment at top of the column (Vy)max
(kip) ((kip-ft)Mz)assoc ((kip)Vy)max ((kip-ft)Mz)assoc
Truck 10.3 -455 -12.28 540.25
Lane 7.6 -336 Maximum longitudinal shear and associated
longitudinal moment at bottom of the column
Maximum longitudinal shear and associated longitudinal moment at bottom of the column (Vy)max (kip) ( Mz)assoc (kip-ft) ( Vy)max (kip) ( Mz)assoc (kip-ft) Truck 10.3 0 33.78 0 Lane 7.6 0
Apply dynamic allowance factor to Table 13.10-31 for one column as shown in Table 13.10-32.
Table 13.10-32 Unfactored Column Longitudinal Shear and Associated Longitudinal Moment for One Lane, Including Dynamic Load Allowance Factors.
Design Vehicle Permit Vehicle
Maximum longitudinal shear and associated longitudinal moment at top of the column
Maximum longitudinal shear and associated longitudinal moment at top of the column (Vy)max(kip) (Mz)assoc(kip-ft) (Vy)max(kip) (Mz)assoc (kip-ft)
Truck 6.8 -303 -7.7 338
Lane 3.8 -168 Maximum longitudinal shear and associated
longitudinal moment at bottom of the column longitudinal moment at bottom of the column Maximum longitudinal shear and associated (Vy)max(kip) (Mz)assoc(kip-ft) (Vy)max(kip) (Mz)assoc (kip-ft)
Truck 6.8 0 21 0
Chapter 13 – Concrete Columns 13-48
13.10.3.2 Transverse Analysis
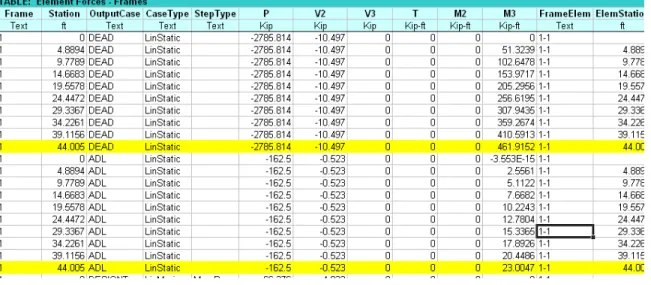
CSiBridge output for load cases of dead load (DC) and added dead load (ADL) is shown in Table 13.10-33.
Table 13.10-33 Transverse Shear (V2) and Moment (M3) at Top and Bottom of Columns
due to Dead Load (DC) and Added Dead Load (DW)
Combine output in Table 3.10-34.
Table 13.10-34 Transverse Shear (V2) and Moment (M3) for DC and DW
Top of column Bottom of column
DC DW DC DW
V2 (kip) -10.5 -0.5 -10.5 -0.5
M3 (kip-ft) 462 23 0 0
CSiBridge output for maximum shear (V2) and associated and moment (M3) for
Chapter 13 – Concrete Columns 13-49
Table 13.10-35 Maximum Shear (V2) and Associated Moment (M3) for Design Vehicle
CSiBridge output for maximum shear (V2) and associated and moment (M3) for
permit vehicle including dynamic load allowance as shown in Table 13.10-36.
Table 13.10-36 Maximum Shear (V2) and Associated Moment (M3) for Permit Vehicle
Re-arrange the transverse shear and moment output from CSiBridge in Table 13.10-37.
Chapter 13 – Concrete Columns 13-50
Table 13.10-37 Unfactored Column Reaction, Including Dynamic Load Allowance Factors
Design Vehicle Permit Vehicle
Maximum transverse shear and associated
transverse moment at top of the column Maximum transverse shear and associated transverse moment at top of the column (V2)max (kip) (M3)assoc (kip-ft) (V2)max (kip) (M3)assoc (kip-ft) Truck -9.1 400 -16.3 718
Maximum transverse shear and associated
transverse moment at bottom of the column transverse moment at bottom of the column Maximum transverse shear and associated (V2)max
(kip) ((kip-ft)M3)assoc ((kip)V2)max ((kip-ft)M3)assoc
Truck -9.1 0 -16.3 0
Use the procedure shown in 13.7.4 and arrange output in Table 13.10-38.
Table 13.10-38 Unfactored Column Reactions, Including Dynamic Load Allowance Factor
Design Vehicle Permit Vehicle
Maximum transverse shear and associated
longitudinal moment at top of the column Maximum transverse shear and associated longitudinal moment at top of the column
Truck -5.5 243 -16.3 718
Lane -3.6 157 Maximum transverse shear and associated
longitudinal moment at bottom of the column longitudinal moment at bottom of the column Maximum transverse shear and associated (V2)max
(kip) ((kip-ft)M3)assoc ((kip)V2)max ((kip-ft)M3)assoc
Truck -5.5 0 -16.3 0
Lane -3.6 0
13.10.3 Total Longitudinal Shear and Associated Moments
Total column longitudinal total shear and associated moment as per 13.8.3 is presented in Table 13.10-39.
Table 13.10-39 Unfactored Column Total Longitudinal Shear and Associated Longitudinal Moment, Including Dynamic Load Allowance Factors
Design Vehicle Permit Vehicle
Maximum longitudinal shear and associated
longitudinal moment at top of the column Maximum longitudinal shear and associated longitudinal moment at top of the column (Vy)max (kip) (Mz)assoc (kip-ft) (Vy)max (kip) (Mz)assoc (kip-ft)
Truck 31 -1367 -12 519
Lane 17 -759 Maximum longitudinal shear and associated
longitudinal moment at bottom of the column longitudinal moment at bottom of the column Maximum longitudinal shear and associated (Vy)max (kip) (Mz)assoc (kip-ft) (Vy)max (kip) (Mz)assoc (kip-ft)
Truck 31 0 32 0
Chapter 13 – Concrete Columns 13-51
13.10.3.9 Summary of Column Shear Loads
Column shear loads are summarized in Table 13.10-40.
Table 13.10-40 Longitudinal Shear and Associated Longitudinal Moment
Load Case (V Top of Column Bottom of Column
y)max. (kip) (Mz)assoc (kip-ft) (Vy)max. (kip) (Mz)assoc (kip-ft)
DC 21 -925 21 0 DW 2.5 -110 2.5 0
H-Truck 31 -1367 31 0
Lane 17 -759 17 0
P-Truck -12 519 32 0
Table 13.10-41 Transverse Shear and Associated Transverse Moment.
Load Case (V Top of Column Bottom of Column
2)max(kip) (M3)assoc(kip-ft) (V2)max(kip) (M3)assoc (kip-ft)
DC -10.5 462 -10.5 0
DW -0.5 23 -0.5 0
H-Truck -5.8 258 -5.8 0
Lane -3.3 143 -3.3 0
P-Truck -16.3 718 -16.3 0
Since this example uses circular columns, the design shears and moments should be taken as the square root of the sum of the squares:
Table 13.10-42 Square Root of the Sum of the Squares
Load Case V (kip)Top of Column (M) Bottom of Column
assoc(kip-ft) V (kip) (M)assoc (kip-ft)
DC 23 1034 23 0 DW 3 112 3 0
H-Truck 32 1392 32 0
Lane 17 772 17 0
P-Truck 20 886 36 0
13.10.3.10 Strength Shear Limit States
Determine strength I and strength II limit states for shear and associated moments.
Strength I: Vu = 1.25 (23) + 1.5 (3) + 1.75 (32 + 17) = 119 kips (controls) Mu= 1.25 (1034) + 1.5 (112) + 1.75 (1392 + 772) = 5248 kips Strength II: Vu = 1.25 (23) + 1.5 (3) + 1.35 (20) = 60 kips Mu= 1.25 (1034) + 1.5 (112) + 1.35 (886) = 2,657 kip-ft