Pattern of Retrogression of Native Vegetation
in North Central Oklahoma
PHILLIP L. SIMS AND DON D. DWYER
Graduate Research Assistant and Assistant Professor1 respectively, Agronomy Department, Oklahoma State University, Stillwater.
Highlight
The pattern of reirogression due fo grazing for native vegetation was established for ihe imporianf plants of the loamy prairie range site. Total forb numbers increased as range condition declined but there were usually as many perenntal forbs in high condition pastures as in low condition ones. To’fal available wa- fer was significantly greater in ex- cellent condition fhan poor condition range.
Disturbance of plant cover by overuse, such as grazing and mowing, upsets orderly succes- sion and causes retrogression (Sampson 1919). Ellison (1960) states that overgrazing initiates a destructive type of secondary succession resulting in a change in the vegetative composition and establishment of plant com- munities that are usually less palatable to the grazing animal and ordinarily are less produc- tive. Range condition needs to be studied in order to relate range condition to productivity which may be related to animal output and rancher income.
Range condition is a practical representation of the major suc- cessional stages of plant commu- nities as influenced by grazing use. The sustained trend associ- ated with retrogression is the primary factor causing a decline in range condition. Major factors considered in trend are density and composition of the vegeta- tion and litter and stability of the soil. Composition of the vege- tation denotes the quality of the
1 Dwyer presently Associate Projes- sor, Range Management, New Mexico State University, Universi- ty Park.
range and is the best indicator of long time trends (Parker 1954).
Basal cover increases as over- grazing occurs, when the in- creasing species are sod-formers, and is accompanied by a de- crease in plant vigor and forage production (Tomanek and Al- bertson 1953).
Several workers (Launchbaugh 1955, Weaver and Tomanek 1951, Voight and Weaver 1951, and Smith 1940) have studied vegeta- tive changes due to grazing and found that certain groups of species decrease in abundance while other species increase or invade. Dyksterhuis (1946), chart-
ing the change in vegetation due to overgrazing in the Fort Worth Prairie, found that decreasers de- clined from 67 percent on excel- lent condition range to less than two percent on poor condition pastures. Increasers rose from three percent on excellent condi- tion range to 88 percent on fair condition sites, then decreased as overuse continued. Invader plants increased from two per- cent on excellent condition range to 47 percent on poor condition range.
A decline in range condition is usually accompanied by a de- crease in the amount of mulch which also indicates that recent use has been abnormally heavy (Humphrey 1949). Much empha- sis has been placed on the effect of soil surface condition on plant- water relationship. Duley and Kelly (1941) and Duley and Do- mingo (1949) state that surface condition of the soil is more im- portant than soil type or previ-
20
ous soil moisture on rate of in- take of rainfall. Mulch conserves moisture primarily in the upper two feet of the soil according to Stephenson and Schuster (1945). The primary purpose of this study was to determine the pat- tern of retrogression that occurs on the loamy prairie range site in north central Oklahoma. Also an attempt was made to deter- mine the relationship between condition of the range and amount of soil moisture.
Methods and Procedures Investigation of the retrogression pattern of native vegetation was conducted on the loamy prairie range site, the dominant grassland site in north central Oklahoma. Stu- dy areas were selected to represent various stages of vegetative depar- ture from the potential of the site. Care was taken to avoid sites that had ever been cultivated. Yearlong grazing was practiced on all areas.
The loamy prairie range sites are gently to steeply rolling, deep, loamy upland soils. The soils are neutral to slightly acid with slow to medium permeability (U.S.D.A. Soil Conserv. Serv. 1961).
The climate of the study region includes hot, often dry summers; mild autumns; mild to cold winters and cool springs. Average annual precipitation for the study region is 32.2 inches (U.S. Dept. of Com- merce). Approximately 70 percent of the total precipitation occurs from April to October.
The point intercept method of vegetation analysis (Levy and Mad- den 1933) was used to determine the percent basal cover and percent spe- cies composition of the grasses of each study area. Two hundred sam- ples, 2,000 points, were taken in each study area.
The square foot method was used to determine the abundance and species of forbs present on each study area. Fifty square foot samples were taken in each study area at regular intervals along predeter- mined transects. The square foot sampling tool was placed at the toe on the final pace and the number of plants of each species occurring in the sample was recorded.
Table 1. Relative percent of decreaser, increaser, and invader grasses and percent basal cover of grasses in the study areas.
Item STUDY AREAS
1* II III Iv* v VI VII VIII IX X XI XII XIII XIV
Decreasers 93 88 86 82 81 75 57 27 26 12 6 3 1 -
Increasers 7 8 12 15 16 21 35 29 39 30 43 5 11 40
Invaders - 4 2 3 4 4 8 44 34 57 51 92 88 60
TOTAL 100 100 100 100 101 100 100 100 99 99 100 100 100 100
Basal Cover 13 12 8 14 16 10 15 16 13 23 16 23 20 19
Range Condition EXCELLENT GOOD FAIR POOR
*Native Hay Meadows
twenty 11.5 by 24 inch quadrats. Each sample was oven-dried and the weight recorded in grams. Pounds of mulch per acre were calculated by multiplying the average weights in grams by the factor 50. Frequency of mulch occurrrence was deter- mined in conjunction with species composition determination by the point intercept method. A hit was recorded when a pin came in con- tact with mulch, but had not touched a plant.
Soil moisture measurements on two pastures that differed widely in vegetative composition were taken with a Nuclear Chicago probe (P-19) and scaler (No. 2,800). Percent soil moisture by volume was determined at six inch intervals to a depth of four feet. These determinations were made twice monthly from April 1 to October 1 and monthly during the remaining six months of the study.
Results and Discussion Range Condition and Grass
Composition
A definite trend can be seen in the change in composition of de- creaser, increaser and invader grasses on the various study areas as vegetation retrogression occurs (Table 1).
The decreasers, little bluestem
(Andropogon scoparius)2, big bluestem (A. gerardi), indian- grass (Sorghastrum nutans) and switchgrass (Panicum virgatum)
comprised 93 percent of the grasses in study area I and de- creased to zero in area XIV.
2 Scientific names follow Waterfall, U. T. 1960. Keys to the Flora of Oklahoma. OkZa. State Univ. Bot. Dept. and Res. Foundation.
Of the seven species of increas- er grasses only blue grama (Bou- teloua gracilis), sideoats grama
(B. curtipendula) and hairy grama (B. hirsuta) were impor- tant. These along with tall drop- seed (Sporobolus asper), Scrib- ners panicum (Panicurn oligo- santhes), purple lovegrass (Era- grostis spectabilis), fall witch- grass (Leptoloma cognatum) and Carex spp. increased from seven percent in study area I to an av- erage of 33 percent in study areas VI through XI.
Invader grasses increased from a trace of buffalograss (Buchloe dactyloides) in area I to aproxi- mately 90 percent in pastures XII and XIII. A decrease of invaders in pasture XIV is a result of an unexplainable increase of blue grama.
As range condition declined basal area of grasses increased (Table 1) . This was a result of the increase in buffalograss and blue grama. The average basal cover of the five excellent condi- tion pastures was 12 percent as opposed to an average of 20 per- cent basal cover for grasses in the five poor condition pastures.
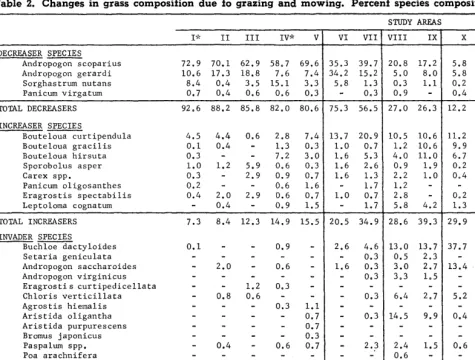
Table 2 illustrates the changes that occurred between study area I, a lightly used meadow, and study area XIV, a severely overgrazed pasture. The study areas are arranged in order of successively poorer range condi- tion from I to XIV.
Little bluestem was the most abundant decreaser species, big bluestem the second most abund-
ant. Sites I and IV (meadows) had less big bluestem than sites II, III, VI, and VII (grazed pas- tures) , indicating that mowing a native meadow may be detri- mental to big bluestem. The na- tive hay meadows were the only excellent condition areas having any buffalograss. Big bluestem declined from approximately 18 percent of the composition in areas II and III to 0.3 percent in the poor condition range, area XIV. Big bluestem was present in the two poorest pastures but little bluestem was not. This suggests that big bluestem may resist continuous severe over- grazing better than little blue- stem. The large percentage of big bluestem in areas VI and VII, 34.2 and 15.2 percent, respective- ly, is difficult to explain except both areas had a past history of over-utilization; however, for the last few years prior to the study they had been lightly grazed. It is possible that big bluestem recovers more quickly than some other species . after overutilization and that the pres- ent cover reflects recent light use rather than past heavy use. Indiangrass was relatively un- important except in the mead- ows. Annual mowing seemed to cause an increase in the abun- dance of this grass. Indiangrass and switchgrass disappeared in the poor condition pastures.
22
SIMS AND DWYER
Table 2. Changes in grass composition due fo grazing and mowing. Percent species composition.
p II III Iv* v DECREASER SPECIES
Andropogon scoparius 72.9 70.1 62.9 58.7 69.6 Andropogon gerardi 10.6 17.3 18.8 7.6 7.4 Sorghastrum nutans 8.4 0.4 3.5 15.1 3.3 Panicum virgatum 0.7 0.4 0.6 0.6 0.3
TOTAL DECREASERS 92.6 88.2 85.8 82.0 80.6
INCREASER SPECIES
Bouteloua curtipendula Bouteloua gracilis Bouteloua hirsuta Sporobolus asper Carex spp.
Panicurn-oligosanthes Eragrostis spectabilis Leptoloma cognatum
4.5 4.4 0.6 2.8 7.4 0.1 0.4 - 1.3 0.3 0.3 - - 7.2 3.0 1.0 1.2 5.9 0.6 0.3 0.3 - 2.9 0.9 0.7 0.2 - - 0.6 1.6 0.4 2.0 2.9 0.6 0.7 - 0.4 - 0.9 1.5
TOTAL INCREASERS 7.3 8.4 12.3 14.9 15.5
INVADER SPECIES --
Buchloe dac tyloides 0.1 - Setaria geniculata
Andropogon saccharoides Andropogon virginicus Eragrostis curtipedicellata Chloris verticillata Agrostis hiemalis Aristida oligantha Aristida purpurescens Bromus japonicus Paspalum spp. Poa arachnifera Hordeum pusillum Distichlis stricta Eragrostis intermedia
- 2.0
- 0.8
- 0.4
- 0.9 - - 0.6 -
1.2 0.3 - 0.6 - - - 0.3 1.1
- 0.7 - 0.7 - 0.3 - 0.6 0.7
TOTAL INVADERS 0.1 3.2 1.8 2.7 3.5 4.2 8.4
RANGE CONDITION EXCELLENT GOOD
* Native Hay Meadows
well as areas X and XI of the
poor condition pastures. This
species was quite variable, but
averaged about 14 percent in the
intermediate condition pastures
(areas VI through XI). Blue
grama became a prominent in-
creaser in the fair condition pas-
ture IX and in the poor condi-
tion pastures, XI and XIV. The
reaction of this plant to the
severest grazing pressure stud-
ied was not clear.
Invader grasses of importance,
other than buffalograss, were
annual threeawn
(Aristida oli- gantha),silver bluestem
(Andro- pogon saccharoides)and wind-
mill grass
(Chloris verticillata).Many of the invader grasses,
as well as some increaser grasses,
showed no apparent pattern or
trend due to grazing pressure
and resulted in fluctuations in
species composition.
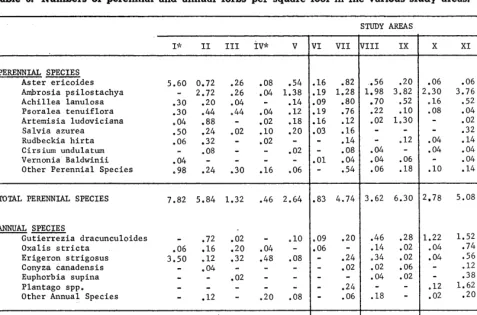
Effects of Grazing on Forbs
Forbs were important in many
of the study areas while in
others they were relatively in-
significant (Table 3). Western
ragweed
(Ambrosia psilostach- ya)tended to increase with a de-
cline in range condition. An ex-
ception to this was pasture II,
which even though
lightly
grazed, had an abundance of
western ragweed in areas of
“spot” overgrazing. Other peren-
nial species that tended to in-
crease were western yarrow
(AchiZZea Zunulosa),
blackeyed-
Susan
(Rudbeckia hirta),wavy-
leaf thistle
(Cirsium undulatum)and Baldwin ironweed
(Verno- nia baldwinii).Perennial species
that showed a decrease as graz-
ing pressures increased were
blue salvia
(Salvia axurea)and
prairie scurfpea (Psoralea
tenui- flora).Annual forb species increased
in most cases under progressive-
ly heavier grazing. Such species
as spurge
(Euphorbia supina),marestail (Conyxa
canadensis),and Plantago spp. did not be
come important until pastures
retrogressed to fair or poor con-
dition. Annual broomweed (Gu-
tierrexia dracunculoides)
be-
came more abundant in pastures
VII through XI, but when range
utilization was severest in pas-
tures XIII and XIV, this species
diminished.
Total forb numbers increased
as range condition declined. How-
ever, Table 3 indicates there may
be as many total perennial forbs
in the very best pastures as in
the very poorest. Forbs, especial-
ly the annuals, appear to react
to seasonal weather changes and
grazing practices more quickly
than the grasses,
VI VII
35.3 39.7 34.2 15.2 5.8 1.3 - 0.3
75.3 56.5
13.7 20.9 1.0 0.7 1.6 5.3 1.6 2.6 1.6 1.3 - 1.7 1.0 0.7 - 1.7
20.5 34.9
2.6 4.6 - 0.3 1.6 0.3 - 0.3
- 0.3
- 0.3
- 2.3
STUDYAREAS
VIII IX
20.8 17.2 5.0 8.0 0.3 1.1 0.9 -
27.0 26.3
10.5 10.6 1.2 10.6 4.0 11.0 0.9 1.9 2.2 1.0 1.2 - 2.8 - 5.8 4.2
28.6 39.3
13.0 13.7 0.5 2.3 3.0 2.7 3.3 1.5
6.4 2.7
14.5 9.9
2.4 1.5 0.6 -
0.5 -
44.2 34.3
FAIR
X XI XII XIII XIV
5.8 1.6 0.8 - - 5.8 4.2 2.1 0.5 0.3
0.2 - - - -
0.4 - - - -
12.2 5.8 2.9 0.5 0.3
11.2 21.2 3.0 1.3 - 9.9 12.7 0.2 3.0 33.0 6.7 5.3 - 5.3 6.2 0.2 0.6 0.2 - - 0.4 2.2 1.3 1.5 0.6
- 0.6 - - - 0.2 - 0.2 0.2 - 1.3 0.6 - - -
29.9 43.2 4.9 11.3 39.8
37.7 15.2 70.5 69.3 48.4 - 0.5 - 13.4 - 2.1 0.2 -
- 0.2 - - 5.2 18.0 12.4 4.3 1.0
- 1.0 - 0.4 8.7 0.6 5.3 7.3
c 0.3 0.6 7.4 6.2 7.1 2.9 - 0.9 - - -
- 0.3 - 0.2 - - 0.3 - - -
57.3 50.5 92.0 87.9 60.2
Table 3. Numbers of perennial and annual forbs per square foot in the various study areas.
1;‘; II III iv* v
PERENNIAL SPECIES Aster ericoides Ambrosia psilostachya Achilles lanulosa Psoralea tenuiflora Artemisia ludoviciana Salvia azurea Rudbeckia hirta Cirsium undulatum Vernonia Baldwinii Other Perennial Species
5.60
.30 .30 004 .50 .06
.04 098
0.72 .26 2.72 .26 .20 .04 .44 .44 .88 - .24 002 .32 - .08 -
.24 .30 .08 .04
.04 .02 .lO .02
.16 .54 1.38 .14 .12 .18 -20
.02
.06
TOTAL PERENNIAL SPECIES 7.82 5.84 1.32 .46 2.64
ANNUAL SPECIES --
Gutierrezia dracunculoides - .72 .02 ’ - .lO Oxalis stricta
Erigeron strigosus Conyza canadensis Euphorbia supina Plantago spp. Other Annual Species
.06 .16 .20 .04 - 3.50 912 .32 .48 .08
- .04 - - - - .02 - -
- .12 - .20 .08
TOTAL ANNUAL SPECIES 3.56 1.16 .56 .72 .26
Total Forbs Per Square Foot 11.38 7.00 1.88 1.18 2.90
Range Condition EXCELLENT
II VII
,16 .82 119 1.28 ,09 .80 ,19 .76 ,16 .12 103 .16 - .14 - .08 ,Ol .04 - .54
,83 4.74
,09 .20 ,06 -
- .24 - .02
- .24 - .06
,15 076
,98 5.50
GOOD
STUDY AREAS
III IX
.56 .20 1.98 3.82 .70 .52 .22 .lO .02 1.30
- .12 .04 - .04 .06 .06 .18
3.62 6.30
.46 .28 .14 .02 034 .02 .02 .06 .04 .02
.18 -
1.18 .40
4.80 6.70
FAIR
X XI XII XIII XIV
.06 .06 .90 .86 .46 2.30 3.76 2.80 4.12 2.38 016 .52 4.10 086 .36 .08 .04 .14 - -
.02 020 .24 -
.32 - - -
.04 .14 .44 .18 .18 .04 .04 .06 - -
.04 .36 .06 - .lO .14 .04 .16 004
2.78 5.08 9.04 6.48 3.42
1.22 1.52 002 .18 .lO 004 .74 .90 .06 1.12 .04 .56 .lO .08 -
012 .02 .02 - .38 1.00 1.26 .22 012 1.62 - - 6.40 .02 .20 .04 .06 1.50
1.44 5.14 2.08 1.66 9.34
4.22 10.22 11.12 8.14 12.76
P 0 0 R
;k Native Hay Meadows
Table 4. Quantify of mulch on fhe sfudy areas in pounds per acre and percent basal cover of mulch.
Item STUDY AREAS
I* II III Iv* v VI VII VIII IX X XI XII XIII XIV
Mulch Quantity 1890 2430 5860 1485 2480 5145 1920 835 1430 263 240 800 261 81
Mulch Cover ** ** 82 5’7 56 86 15 24 52 3 10 37 7 4
Range Condition EXCELLENT GOOD FAIR POOR
*Native Hay Meadows **NO data
Mulch as Related fo Range Condition I
There was considerably less
mulch present in volume and
ground cover in poor as com-
pared to excellent condition pas-
tures (Table 4). The data indi-
cate that the average mulch is
over one ton per acre in the
excellent condition pastures and
about 1,000 pounds per acre in
the fair condition pastures. In
severely overgrazed
pastures
mulch was very limited. Percent
of ground covered by mulch was
related to pounds of mulch per
acre.
The amount of mulch on a
range site appeared subject to
rapid change; for example, in
area III, which was overutilized
after the sampling, mulch was
reduced to less than one ton per
acre in one year.
Effect of Range Condition
Study
used to
on Soil Moisture
areas III and XIII were
determine the effect of
range condition on soil moisture.
Pasture III was in excellent
range condition and pasture XIII
in poor. A detailed examination
of each soil profile immediately
adjacent to the source of the
soil moisture data indicated that
the only difference in the pro-
files occurred at depths greater
than 30 inches where the soil
texture in pasture III contained
more of the sand fraction than in
pasture XIII.
24
SIMS AND DWYER
d 7
5 6
b 5
FIGURE 1. Available soil moisture in 48 inch profile of excellent and poor range condi- tion sites and rainfall data.
poor condition pastures through-
out the year, and the precipita-
tion for the interval between
sampling. Overall, soil moisture
in the excellent condition pas-
ture exceeded the moisture in
the poor condition by an average
1.8 inches of water available to
plants in the 48 inch profile (dif-
ference significant at the .05
level). However, no moisture
stress was observed in either
pasture during a near average
rainfall year of 29.4 inches.
Throughout the dormant peri-
od, November, 1962, to April,
1963, the poor condition pasture
contained fewer inches of avail-
able water in the profile than
the excellent condition pasture.
Once plants began to make their
spring growth, water in both
profiles declined even though
substantial rainfall occurred. in
April and May. The soil in the
excellent condition pasture had
more inches of available water
than the poor condition pasture
and probably more water used
due to more vegetation being
present. As range condition de-
clined from excellent to poor,
pounds of mulch and percent of
ground covered by mulch de-
creased from 5,860 pounds and
82 percent to 261 pounds and
seven percent, respectively. Ac-
cording to Duley and Kelly
(1941) and Duley and Domingo
(1949)) this decrease in mulch
covering could influence
the
amount of rainfall absorbed into
the soil profile.
Summary
The pattern of retrogression
due to grazing for native vegeta-
tion was determined
for the
loamy prairie range site in north
central Oklahoma. An attempt
was made to determine the re-
lationship of range condition to
amount of mulch on the soil sur-
face and to soil moisture. The
loamy prairie range sites are
gently rolling, deep, loamy up-
land soils. The soils are neutral
to slightly acid with slow to me-
dium permeability.
The important findings were:
(1) Decreasers, primarily little
and big bluestem, declined from
93 percent in excellent condition
pastures to zero in extremely
poor condition pastures.
(2) Sideoats grama, blue grama,
and other increaser plants in-
creased in intermediate condi-
tion pastures and usually de-
creased in poor condition pas-
tures.
(3) Invader plants, primarily
buffalograss, increased from zero
on excellent condition pastures
to 92 percent on a poor condition
pasture.
(4) Basal cover of grasses in-
creased from 12.5 percent in ex-
cellent and good condition pas-
tures to 14.5 percent in fair con-
dition pastures and to 20 percent
in poor condition pastures.
(5) Forbs were important in
many study areas and in others
they were insignificant. Western
ragweed, western yarrow, black-
eyed Susan, and wavyleaf thistle
are perennial species that in-
creased with overgrazing. Blue
salvia and prairie scurfpea de-
creased when overgrazed. Gen-
erally, perennial forbs decreased
under light grazing but increased
as grazing became heavier while
annual forbs increased under
overgrazing.
(6) Considerably less mulch oc-
curred on poor condition pas-
tures as compared to excellent
and good condition sites. Aver-
age mulch per acre was 3,000
pounds for excellent and good,
1,130 for fair and 330 pounds for
poor range condition study areas.
Percent of ground covered by
mulch decreased with lowering
range condition and reduction in
mulch quantity.
(7) Throughout a season of
near average rainfall, 29.4 inches,
available water averaged 9.3 and
7.5 inches per 48 inch profile for
excellent and poor range condi-
tion pastures, respectively.
LITERATURE CITED
BEUTNER, E. L: AND D. ANDERSON. 1943. The effect of surface mulches on water conservation and forage production in some semidesert grassland soils. Jour. Amer. Sot. Agron. 35: 393-400.
DULEY, F. L. AND C. E. DOMINGO. 1949. Effect of grass on intake of water. Nebr. Res. Bul. 159. 15 pp. DULEY, F. L. AND L. L. KELLY. 1939.
Effect of soil type, slope, and sur- face conditions on intake of water. Nebr. Res. Bul. 112. 16 pp.
DULEY, F. L. AND L. L. KELLY. 1941. Surface condition of soil and time of application as related to intake of water. U. S. Dept. Agr. Cir. 608. 31 pp.
DYKSTERHUIS, E. J. 1946. The vege- tation of the Fort Worth Prairie. Ecol. Mono. 16: l-29.
HUMPHREY, R. R. 1949. Field com- ments on the range condition method of forage survey. Jour. Range Mangt. 2: l-10.
LAUNCHBAUGH, J. L. 1955. Vegeta- tional changes in San Antonio Prairie associated with grazing, retirement from grazing and aban- donment from cultivation. Ecol. Mono. 25: 39-57.
LEW, E. I!. AND E. A. MADDEN. 1933. The point method of pasture anal- ysis. New Zealand Jour. Agr. 46: 267-279.
PARKER, K. W. 1954 Application of ecology in the determination of range condition and trend. Jour.
Range Mangt. 7: 14-23.
SAMPSON, A. W. 1919. Plant succes- sion in relation to range manage- ment. U. S. Dept. Agr. Bul. 791. 76 PP.
SMITH, C. C. 1940. The effect of over- grazing and erosion upon the biota of the mixed grass prairie of Okla- homa. Ecol. 21: 381-397.
STEPHENSON, R. E. AND C. E. SCHUS- TER. 1945. Effect of mulches on soil properties. Soil Sci. 59: 219-230. TOMANEK, G. W. AND F. W. ALBERT-
SON. 1953. Some effects of different intensities of grazing on mixed prairies near Hays, Kansas. Jour. Range Mangt. 6: 299-306.
U. S. DEPARTMENT OF COMMERCE, WEATHER BUREAU. Climatological Data, Oklahoma.
U. S. DEPARTMENT OF AGRICULTURE, SOIL CONSERVATION SERVICE. 1961. Oklahoma range site technical de- scriptions.
VOIGHT, J. W. AND J. E. WEAVER. 1951. Range condition classes of mid- western pasture: an ecological analysis. Ecol. Mono. 21: 39-60. WEAVER, J. E. AND G. W. TOMANEK.
1951. Ecological studies in a mid- western range: the vegetation and effects of cattle on its composition and distribution. Nebr. Cons. Bul. 31. 82 pp.
TECHNICAL
REPORTS
Soil Moisture Response To
Range Improvement In The
Northern Great Plains
WALTER R. HOUSTON Research Range Conservationist, Crops Research Division, Agricul- tural Research Service, USDA, Miles City, Montana.1
An understanding of soil moisture regimes and the factors which influ- ence them is basic to improving range productivity in the West. Moisture is no doubt the most im- portant single influence affecting range forage production in the large- ly semi-arid climate. Soil types, grazing systems, and range improve- ment practices are important influ- ences on range forage production, composition, and quality. Other fac- tors such as soil aeration, toxic soil materials, and topography are oc- casionally important, but usually locally. Many of these factors are interrelated in their effects, but com- monly moisture is limiting.
1 Cooperating with Montana Agri- cultural Experiment Station and Animal Husbandry Research Divi- sion.
The results of an investigation into the influences of range pitting, fertilization, and protectiom from grazing on soil moisture (as mois- ture potential or soil moisture stress) in a low rainfall area of the Northern Great Plains, are reported here. Also studied were the effects and interactions of precipitation, soils, and livestock grazing rates. Relationships between soil moisture potential and various components of herbage production, and the influ- ences and interactions of the main factors on these relationships were included.
Range pitting has been shown generally to improve forage produc- tion. It is believed this influence is manifested through reduction of sur- face run-off and moisture accumula- tion in the basins formed (Barnes, 1952; Rauzi and Lang, 1956; Thomas and Young, 1956)) and by increased infiltration into the soil (Barnes, 1952; Lang, 1958). The possible effect on soil moisture from the reduction of plant cover accompanying pitting is little known.
Nitrogen fertilization of rangeland has been found by several investiga- tors to increase forage production and protein content of herbage
(Rogler and Lorenz, 1957; Smika et al. 1960)) but the increase was not
always profitable. Nitrogen also has caused earlier maturity of vegeta- tion and earlier and greater deple- tion of soil moisture (M&e11 et al., 1959; Sneva et al., 1958).
The effects of heavy livestock grazing (a combination of excessive forage utilization and livestock trampling) in reducing forage pro- duction have been shown by many investigators (Johnson, 1953; Klipple and Costello, 1960; Reed and Peter- son, 1961). Some have indicated that heavy grazing reduced soil moisture infiltration rates and accumulation
(Klipple and Costello, 1960; Rauzi and Kuhlman, 1961; Reed and Peter- son, 1961).
Clipping vegetation at various in- tervals and heights to simulate dif- ferent stocking levels has influenced production, forage quality, and soil moisture regimes and depletion curves (Baker and Hunt, 1961; Blais- dell and Pechanec, 1949; McKell et al., 1960).