British Journal of Nutrition
http://journals.cambridge.org/BJNAdditional services for
British Journal of Nutrition:
Email alerts: Click here Subscriptions: Click here Commercial reprints: Click here Terms of use : Click here
Evaluation of a model for total body protein mass based on dualenergy X
ray absorptiometry: comparison with a reference fourcomponent model
N. J. Fuller, J. C. K. Wells and M. Elia
British Journal of Nutrition / Volume 86 / Issue 01 / July 2001, pp 45 52 DOI: 10.1079/BJN2001387, Published online: 09 March 2007
Link to this article: http://journals.cambridge.org/abstract_S0007114501001386
How to cite this article:
N. J. Fuller, J. C. K. Wells and M. Elia (2001). Evaluation of a model for total body protein mass based on dualenergy Xray absorptiometry: comparison with a reference fourcomponent model. British Journal of Nutrition,86, pp 4552 doi:10.1079/ BJN2001387
Request Permissions : Click here
Evaluation of a model for total body protein mass based on
dual-energy X-ray absorptiometry: comparison with a reference
four-component model
N. J. Fuller
1,3*, J. C. K. Wells
1and M. Elia
2,31MRC Childhood Nutrition Research Centre, Institute of Child Health, 30 Guilford Street, London WC1N 1EH, UK 2Addenbrooke’s Hospital, Hills Road, Cambridge CB2 2QQ, UK
3MRC Dunn Clinical Nutrition Centre, Hills Road, Cambridge CB2 2DH, UK
(Received 20 October 2000 – Revised 6 February 2001 – Accepted 28 February 2001)
The aim of the present study was to evaluate a model of body composition for assessing total body protein (TBP) mass using dual-energy X-ray absorptiometry (DXA), with either measured or assumed total body water (TBW); it was intended to provide a less complex or demanding alternative technique to, for example, the four-component model (4-CM). The following measurements were obtained in healthy adults (n46) aged 18 – 62 years, and children (n30) aged 8 – 12 years: body weight (BWt), body volume (BV; under-water weighing), TBW (2H-dilution space or predicted using an assumed hydration fraction of fat-free mass (HFffm)), bone mineral
content (BMC; DXA) and fat-free soft tissue (FFST; DXA). TBP was calculated using the 4-CM ðTBP¼3:050BWt20:290TBW22:734BMC22:747BVÞ and the DXA model ðTBP¼ FFST20:2305BMC2TBWÞ: DXA measurements were obtained using the Lunar DPX (Lunar Radiation Corporation, Madison, WI, USA) or Hologic QDR 1000/W (Hologic, Waltham, MA, USA). Precision of the DXA model for TBP with measured TBW (4:6 – 6:8 % mean TBP) was slightly worse than the 4-CM (4:0 – 5:4 %), whereas that modelled with assumed HFffmwas more precise (2:4 – 5:2 %) because it obviated imprecision associated with measuring
TBW. Agreement between the 4-CM and DXA model with measured TBW was also worse (e.g. bias, 15 % of the mean; 95 % limits of agreement up to^39 % for adults measured on the Lunar DPX) than when a constant for HFffmwas assumed (3:7 % and^21 % respectively). Most of the
variability in agreement between these various models was due to interpretation of biological factors, rather than to measurement imprecision. Therefore, the DXA model, which is less complex and demanding than the 4-CM, is of value for assessing TBP in groups of healthy subjects, but is of less value for individuals in whom there may be substantial differences from reference 4-CM estimates.
Body composition: Bone mineral: Fat-free mass: Total body water
The ability to measure total body protein (TBP) is of major importance in health and disease. TBP mass increases during growth and development, recovery from under-nutrition and after certain types of exercise; TBP falls during starvation and ageing and in a variety of disease states. In human subjects, many physiological functions are severely impaired when TBP levels fall below 80 % of that considered normal in health (Hill, 1992). For example, muscle function, including respiratory muscle, immune function and response to disease are all affected to the detriment of recovery from illness.
The assessment of TBPin vivohas been based on either simple subjective clinical judgements, such as inspection and palpation of certain muscle groups, or complicated and expensive techniques involving in vivo neutron activation analysis for total body N (protein contains 98 % body N) that are associated with substantial exposure to radiation (Cohn, 1992). Despite such factors limiting its availability,
the measurement of TBP by in vivo neutron activation
analysis has been used as a reference for evaluating the utility of fat-free mass (FFM), derived using dual-energy X-ray absorptiometry (DXA), as an index of protein status
*Corresponding author:Dr Nigel J. Fuller, fax +44 (0)20 7831 9903, email [email protected]
Abbreviations:BMC, bone mineral content; BV, body volume; BWt, body weight; DXA, dual-energy X-ray absorptiometry; FFST, fat-free soft tissue; FFM, fat-free mass; HFffm, hydration fraction of fat-free mass; TBP, total body protein; TBV, total body volume; TBW, total body water; 4-CM, four-component
model.
in continual ambulatory peritoneal dialysis patients (Borovnicar et al. 1996). However, estimates of TBP are available using a more accessible four-component model (4-CM) of body composition analysis (fat, protein, water and mineral) that integrates measurements of body weight (BWt), body volume (BV), bone mineral content (BMC) and total body water (TBW) (Heymsfieldet al.1990; Fuller
et al. 1992a). Alternatively, TBP may also be estimated using a model based on whole-body DXA technology that precludes the need for additional complex or demanding technology, such as underwater weighing for BV estimates, which may not be well tolerated.
Measurements of BMC and fat-free soft tissue (FFST), obtained using DXA, form the basis of an assessment of TBP which is potentially more accurate than clinical judgement and is both less expensive and generally more
accessible than in vivo neutron activation analysis.
Conceptually, total body FFST is considered to consist only of TBW, non-osseous mineral and TBP, because other components are quantitatively less significant. Therefore, TBP may be estimated by subtracting TBW and non-osseous mineral from FFST. TBW may be readily assessed independently by techniques for measuring2H- (safe, stable isotope) dilution space, with a correction factor (approxi-mately 1:04) to account for non-aqueous isotope exchange (Pullicino et al.1990; Fuller et al.1992a; Jenningset al.
1999). Alternatively, TBW may be predicted by assuming that FFM (which is equivalent to the sum of DXA measurements of BMC and FFST) has a constant hydration fraction (HFffm), which is sex, age and population specific
and usually considered to be about 0:72 – 0:74 in adults and 0:74 – 0:78 in children ðTBW¼FFMHFffmÞ:
Non-oss-eous mineral may be calculated from BMC, assuming a constant relationship between non-osseous mineral and bone mineral (whole-body ratio 0:1809:0:8191 respect-ively), and that BMC (bone ash) is a constant fraction (0:9582) of hydrated bone mineral (Fulleret al.1992a, from the data of Brozeket al.1963). However, the accuracy and precision for measuring TBP using this DXA model is unknown. Therefore, the purpose of the present study was to use the 4-CM as a reference method with which to assess the value of this DXA model for estimating TBP.
Methods
The characteristics of the seventy-six healthy volunteers used in this evaluation (summarised in Table 1) are available in detail from previous studies with DXA for: (1) adults, assessed using Lunar DPX (Lunar Radiation Corporation, Madison, WI, USA) instrumentation (Fuller
et al.1992a,b); (2) adults, with the Hologic QDR 1000/W (Hologic, Waltham, MA, USA) (Fulleret al.1999a,b); (3) children, with the Hologic QDR 1000/W (Wellset al.1999; Dewitet al.2000).
BWt (kg) was measured using a Sauter Type E1210 electronic scales (Todd Scales, Unit 4, Studlands Park Industrial Estate, Newmarket, Suffolk, UK) and standing height (m) was measured against a wall-mounted stadi-ometer. BMI was determined as Quetelet’s index (kg/m2). BV was obtained using an under-water weighing technique in which weight of the submerged subject was measured concurrently with the assessment of lung volume (Fuller
et al.1992a).
Measurements of whole-body FFST, fat and BMC were obtained using either an Hologic QDR 1000/W (Hologic) or a Lunar DPX (Lunar Radiation Corporation), following manufacturer’s specified instructions.
TBW was obtained: (1) for the adults measured on the Lunar DPX, using an2H-dilution isotope ratio MS method (Pullicinoet al.1990; Fulleret al.1992a); (2) for the adults and children measured with the Hologic QDR 1000/W, using the 2H-dilution i.r. spectrophotometric method, validated against the established MS method (Jennings
et al.1999).
Calculations
TBP was calculated in two ways. (1) A 4-CM (Fulleret al.
1992a):
TBP ðkgÞ ¼BWt2ðTBW1total body mineral
1body fat massÞ;
where total body mineral was assumed to be equal to 1:2741BMC (equivalent to BMC plus non-osseous mineral) and was derived from the non-osseous mineral:bone mineral
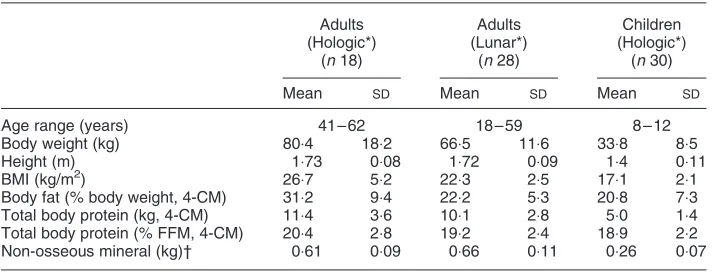
Table 1. Characteristics of subjects
Adults (Hologic*)
(n18)
Adults (Lunar*)
(n28)
Children (Hologic*)
(n30)
Mean SD Mean SD Mean SD
Age range (years) 41 – 62 18 – 59 8 – 12
Body weight (kg) 80:4 18:2 66:5 11:6 33:8 8:5
Height (m) 1:73 0:08 1:72 0:09 1:4 0:11
BMI (kg/m2) 26:7 5:2 22:3 2:5 17:1 2:1
Body fat (% body weight, 4-CM) 31:2 9:4 22:2 5:3 20:8 7:3
Total body protein (kg, 4-CM) 11:4 3:6 10:1 2:8 5:0 1:4
Total body protein (% FFM, 4-CM) 20:4 2:8 19:2 2:4 18:9 2:2
Non-osseous mineral (kg)† 0:61 0:09 0:66 0:11 0:26 0:07
4-CM, the reference four-component model; FFM, fat-free mass (body weight2body fat).
* Dual-energy X-ray absorptiometry instrumentation; Hologic QDR 1000/W (Hologic, Waltham, MA, USA) or Lunar DPX (Lunar Radiation Corporation, Madison, WI, USA).
† Non-osseous mineral = 0:2305bone mineral content.
ratio (0:1809:0:8191 respectively) by taking into account the fraction of hydrated bone mineral comprising BMC or ‘bone ash’; therefore, non-osseous mineral was assumed to be 0:2305BMC (Fulleret al.1992a), and:
fat mass ðkgÞ ¼2:747BV20:710TBW11:460BMC
22:050BWt;
therefore:
TBP ðkgÞ ¼3:050BWt20:290TBW22:734BMC
22:747BV:
(2) DXA estimates of FFST and BMC either with TBW measured using2H2dilution space (1:04TBW):
TBP ðkgÞ ¼FFST2TBW2non-osseous mineral;
or with TBW assumed to constitute a specific constant HFffm:
TBP ðkgÞ ¼FFST2ðFFMHFffmÞ
2non-osseous mineral;
where non-osseous mineral¼0:2305BMC (Fuller et al.
1992a), HFffm for adults¼0:738 (Fuller et al. 1992a) or
0:72 (calculated from the equation presented by Siri, 1961) and HFffmfor children aged 8 – 12 years¼0:753 (Wellset al.
1999) or the age- and sex-specific constants of Lohman (1989).
Statistics
Propagation of errors was calculated from precision of measurements observed for each of the individual techniques involved for the DXA method and the 4-CM for comparison. Appropriate values were applied according to the specific study group (adults or children), instrumentation (e.g. Lunar DPX or Hologic QDR 1000/W for DXA measurements; MS or i.r. spectrophotometry for TBW) and software version (see Fulleret al.(1996) for an example of discrepancies in body composition observed with different software packages from the same manufacturer) used during a particular study. Standard deviations of the differences (SDd) between
duplicate measurements that were used in the calculation of precision for the models are presented in Table 2.
The strengths of relationships between variables were assessed using Pearson’s correlation coefficient (r). The bias and 95 % limits of agreement between estimates of TBP obtained using the reference 4-CM and the DXA model (4-CM minus DXA model) and relationships between the size of estimate and difference between these methods were evaluated (Bland & Altman, 1986).
The contribution of measurement imprecision to the difference between methods for assessing TBP was calculated by estimating precision for the methods combined, calculated as the sum of their individual variances (SD squared), divided by the variance (SDd
squared) between methods.SDdbetween methods is equal to
the 95 % limits of agreement (as earlier; Bland & Altman, 1986) divided by 4.
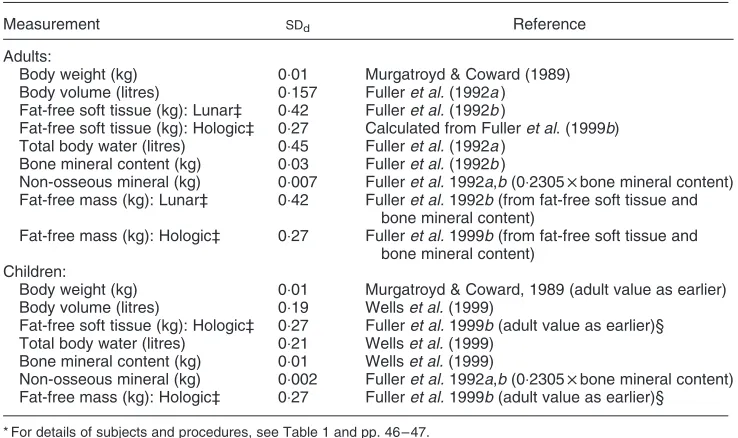
Table 2. Measurement precision for each of the different measurement techniques used in the esti-mation of total body protein*†
(Standard deviations of the differences between duplicate measurements (SDd))
Measurement SDd Reference
Adults:
Body weight (kg) 0:01 Murgatroyd & Coward (1989)
Body volume (litres) 0:157 Fulleret al.(1992a) Fat-free soft tissue (kg): Lunar‡ 0:42 Fulleret al.(1992b)
Fat-free soft tissue (kg): Hologic‡ 0:27 Calculated from Fulleret al. (1999b) Total body water (litres) 0:45 Fulleret al.(1992a)
Bone mineral content (kg) 0:03 Fulleret al.(1992b)
Non-osseous mineral (kg) 0:007 Fulleret al.1992a,b(0:2305bone mineral content) Fat-free mass (kg): Lunar‡ 0:42 Fulleret al.1992b(from fat-free soft tissue and
bone mineral content)
Fat-free mass (kg): Hologic‡ 0:27 Fulleret al.1999b(from fat-free soft tissue and bone mineral content)
Children:
Body weight (kg) 0:01 Murgatroyd & Coward, 1989 (adult value as earlier)
Body volume (litres) 0:19 Wellset al.(1999)
Fat-free soft tissue (kg): Hologic‡ 0:27 Fulleret al.1999b(adult value as earlier)§ Total body water (litres) 0:21 Wellset al.(1999)
Bone mineral content (kg) 0:01 Wellset al.(1999)
Non-osseous mineral (kg) 0:002 Fulleret al.1992a,b(0:2305bone mineral content) Fat-free mass (kg): Hologic‡ 0:27 Fulleret al.1999b(adult value as earlier)§
* For details of subjects and procedures, see Table 1 and pp. 46 – 47.
† Precision of the hydration fraction of fat-free mass (HFffm) is not an entity for these particular calculations as there is no measurement imprecision associated with the use of assumed constant values (even though these may of course be substantially inaccurate, see p. 50).
‡ Dual-energy X-ray absorptiometry instrumentation: Hologic QDR 1000/W (Hologic, Waltham, MA, USA) or Lunar DPX (Lunar Radiation Corporation, Madison, WI, USA).
Ethical Approval
Each of the studies from which data have been obtained for this report (Fulleret al.1992a,b, 1999a,b; Wellset al.1999;
Dewit et al. 2000) were approved by the local Ethical
Committees of either Addenbrooke’s Hospital or the Dunn Clinical Nutrition Centre, Cambridge, UK (both Committees approved the children’s study), informed consent was obtained from each subject or the parents of each child and verbal consent was ascertained from each child.
Results
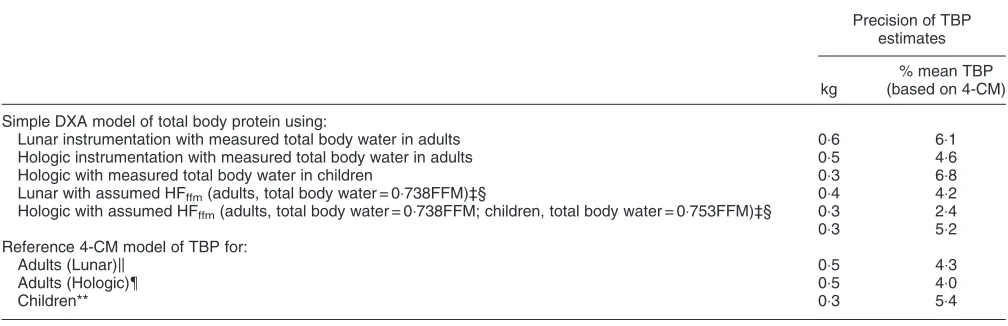
Table 3 shows the propagated measurement precision for the DXA model of TBP estimates obtained from each DXA instrument, for groups of adults and children and using measured or estimated TBW; this precision is relatively good compared with that of the 4-CM, also presented in Table 3. Although estimates of TBP obtained using the DXA model with measured TBW were slightly less precise than the reference 4-CM, DXA model estimates of TBP based on assumed HFffmhad better precision.
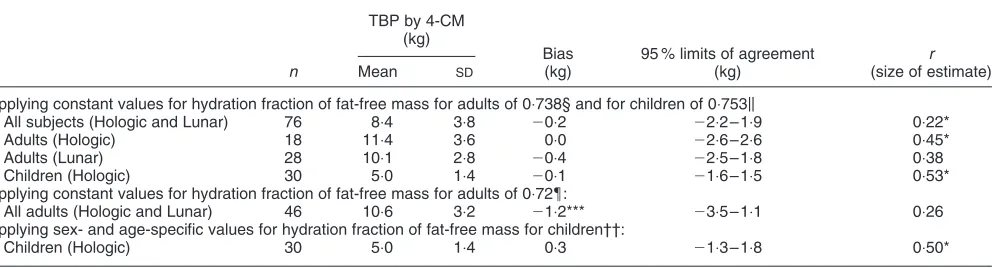
The extent of agreement between estimates of TBP obtained using the 4-CM and the DXA model in which measured values for TBW were applied is presented in Table 4, as bias and 95 % limits of agreement in absolute terms. Included in Table 4 are mean values for each group, to enable comparisons in relative terms, and Pearson’s correlation coefficients (r) regarding possible relationships for differences in estimates between models and the
magnitude of measurements. The value of r indicates
whether or not there was a constant bias with increasing size of measurement between estimates obtained using the different models. A constant bias may be taken into account for using the models interchangeably, if such relationships
were shown not to be significant. However, wherever the difference between models was affected by the size of estimateðP,0:05Þ;the bias cannot be taken into account when estimating the TBP of one model by use of the other. Apparently, the model based on Hologic QDR 1000/W DXA instrumentation (Hologic) had a smaller bias, which was not influenced by the magnitude of measurement, than that based on Lunar DPX instrumentation (Lunar Radiation Corporation), which was influenced by measurement size. The biases appeared to be greater for the men than the women or children (Table 4). However, there were substantial 95 % limits of agreement for the comparison of both models with the 4-CM for all subjects.
The agreement between methods was improved con-siderably if assumed values for TBW were substituted for measured values (Table 5). Generally, the biases were sufficiently small that they could be ignored, except for those obtained when the assumed value for HFffmof 0:72
was applied, indicating the importance of using an appropriate HFffm for particular DXA instrumentation.
When constants for HFffm were applied to DXA models
involving both instruments the observed intervals between the 95 % limits of agreement were smaller than their counterparts based on measured TBW.
Analysis of precision (Table 3) in relation to measured variability in the extent of agreement (95 % limits of agreement) between methods (Tables 4 and 5), indicates that these differences are mostly due to factors other than precision errors (Table 6).
Discussion
Measurements of TBP in vivo can provide important
information regarding healthy growth, development and ageing, and they are of value for monitoring and evaluating
Table 3. Measurement precision for estimates of total body protein (TBP) using variations on a dual-energy X-ray absorptiometry (DXA) model, each of which differs slightly in approach depending on instrumentation, sample group and total body water estimates*†
Precision of TBP estimates
kg
% mean TBP (based on 4-CM)
Simple DXA model of total body protein using:
Lunar instrumentation with measured total body water in adults 0:6 6:1
Hologic instrumentation with measured total body water in adults 0:5 4:6
Hologic with measured total body water in children 0:3 6:8
Lunar with assumed HFffm(adults, total body water = 0:738FFM)ठ0:4 4:2
Hologic with assumed HFffm(adults, total body water = 0:738FFM; children, total body water = 0:753FFM)ठ0:3 2:4
0:3 5:2
Reference 4-CM model of TBP for:
Adults (Lunar)k 0:5 4:3
Adults (Hologic){ 0:5 4:0
Children** 0:3 5:4
4-CM, the reference four-component model; FFM, fat-free mass; HFffm, hydration fraction of FFM. * For details of subjects and procedures, see Table 1 and pp. 46 – 47.
† DXA instrumentation: Hologic QDR 1000/W (Hologic, Waltham, MA, USA) or Lunar DPX (Lunar Radiation Corporation, Madison, WI, USA).
‡ For the purposes of these calculations, the use of assumed constant values for HFffmobviates the need to consider the precision for total body water when estimating total body protein.
§ The DXA estimate of FFM is equal to the sum of DXA estimates of fat-free soft tissue and bone mineral content. kFulleret al.(1992a).
{Fulleret al.(1999b). ** Wellset al.(1999).
the effects of treatment on body composition. However, several of the techniques used to obtain such measurements are less than perfect, being constrained by the assumptions of each, its acceptability and technical limitations. In addition to its good precision (Table 3), the DXA model evaluated here provides acceptable estimates of TBP for groups of healthy subjects, at least when mean values are compared to the reference 4-CM. However, the extent of agreement between TBP estimates obtained using the 4-CM and predicted with the DXA model is considerably more variable when assessing individuals. The integration of
appropriate constants for HFffmin this DXA model not only
appears to improve its precision (Table 3) and accuracy (smaller bias against the 4-CM; Table 5), compared with measured TBW values (Table 4), but also reduces its variability in predicting TBP for individuals (95 % limits of agreement; Table 5v.Table 4).
The 4-CM model was chosen as an appropriate reference method against which to evaluate the DXA model of TBP. The relative accuracy of the 4-CM stems from the inclusion of measured values for TBW and BMC, which serves to eliminate uncertainties associated with the
Table 4. Agreement between the reference four-component model (4-CM) and the dual-energy X-ray absorptiometry model, incorporating
measured total body water, for estimates of total body protein (TBP)†‡
TBP by 4-CM (kg)
Bias (kg)
95 % limits of agreement (kg)
r
(differencev.size of estimate)*
n Mean SD
Male and female
All subjects (Hologic and Lunar) 76 8:4 3:8 20:8** 24:7 – 3:2 0:47*
Adults (Hologic) 18 11:4 3:6 20:9 25:6 – 3:7 0:27
Adults (Lunar) 28 10:1 2:8 21:6*** 25:5 – 2:4 0:56*
Children (Hologic) 30 5:0 1:4 0:1 22:6 – 2:8 0:10
Female
All subjects (Hologic and Lunar) 34 6:8 2:1 20:2 23:2 – 2:9 0:23
Adults (Hologic) 8 8:4 2:1 20:6 23:1 – 1:9 0:12
Adults (Lunar) 12 7:6 1:0 20:3 23:0 – 2:4 0:68*
Children (Hologic) 14 5:1 1:6 0:2 21:8 – 3:8 0:17
Male
All subjects (Hologic and Lunar) 42 9:7 4:3 21:3*** 25:5 – 3:0 0:45*
Adults (Hologic) 10 13:8 2:6 21:2 27:1 – 4:7 0:36
Adults (Lunar) 16 11:9 2:2 22:5*** 26:2 – 1:2 0:05
Children (Hologic) 16 5:0 1:1 20:0 21:8 – 1:7 0:03
Straight-line relationship was significant: *P,0:05:(see p. 47 for details). In no case was it necessary to convert the data to logarithm (Bland & Altman, 1986). † For details of subjects and procedures, see Table 1 and pp. 46 – 47.
‡ Dual-energy X-ray absorptiometry instrumentation; Hologic QDR 1000/W (Hologic, Waltham, MA, USA) or Lunar DPX (Lunar Radiation Corporation, Madison, WI, USA).
Bias was significantly different from zero: **P,0:01;***P,0:001:
Table 5. Agreement between the reference four-component model (4-CM) and the dual-energy X-ray absorptiometry model, incorporating
total body water predicted from fat-free mass, for estimates of total body protein (TBP)†‡
TBP by 4-CM (kg)
Bias (kg)
95 % limits of agreement (kg)
r
(size of estimate)
n Mean SD
Applying constant values for hydration fraction of fat-free mass for adults of 0:738§ and for children of 0:753k
All subjects (Hologic and Lunar) 76 8:4 3:8 20:2 22:2 – 1:9 0:22*
Adults (Hologic) 18 11:4 3:6 0:0 22:6 – 2:6 0:45*
Adults (Lunar) 28 10:1 2:8 20:4 22:5 – 1:8 0:38
Children (Hologic) 30 5:0 1:4 20:1 21:6 – 1:5 0:53*
Applying constant values for hydration fraction of fat-free mass for adults of 0:72{:
All adults (Hologic and Lunar) 46 10:6 3:2 21:2*** 23:5 – 1:1 0:26
Applying sex- and age-specific values for hydration fraction of fat-free mass for children††:
Children (Hologic) 30 5:0 1:4 0:3 21:3 – 1:8 0:50*
Straight-line relationship was significant: *P,0:05 (see p. 47 for details). In no case was it necessary to convert the data to logarithm (Bland & Altman, 1986).
† For details of subjects and procedures, see Table 1 and pp. 46 – 47.
‡ Dual-energy X-ray absorptiometry instrumentation: Hologic QDR 1000/W (Hologic, Waltham, MA, USA) or Lunar DPX (Lunar Radiation Corporation, Madison, WI, USA).
§ Fulleret al.(1992a). kWellset al.(1999). {Siri (1961). †† Lohman (1989).
assumptions necessary for less complex models (e.g. two-component models) of body-composition assessment (Heymsfield et al. 1990; Fuller et al. 1992a; Wells et al.
1999). However, this accuracy is confounded systematically by the presence of other body components not taken into account by the 4-CM, such as glycogen, free amino acids, nucleic acids and urea. Such components are mostly included in the estimate of TBP because their mean densities (e.g. glycogen 1:52 kg/l) are more closely akin to that of protein (1:34 kg/l) than the other major components of the body (fat 0:9 kg/l, water 0:99371 kg/l; mineral 3:0375 kg/l). The extent of potential errors from such sources has been considered previously (e.g. Heymsfield
et al. 1990; Fuller et al. 1992a); glycogen, for example, constitutes about 44 g/kg TBP (Borovnicaret al.1996), but is variable according to factors such as nutritional status and exercise. Such errors also apply to the DXA model for estimating TBP because components that are not either measured or predicted (e.g. glycogen, free amino acids) are included with the estimate of TBP.
It is generally accepted that DXA estimates of fat and FFST are fairly precise, but may be less accurate than, for example, the DXA estimate of BMC or fat and FFM assessed using the 4-CM. This is partly because DXA estimates of fat and FFST are assumed to be in the same proportions in pixels containing bone as they are in pixels with no bone, and partly due to the confounding effects of tissue thickness (Roubenoff et al. 1993; Jebb et al.1995; Tothill, 1995; Laskey, 1996). Likewise, assessments of TBP by the DXA method are marginally less precise than those for the reference 4-CM when measured TBW is taken into account, but slightly more precise when an assumed
constant for HFffm is applied (Tables 2 and 3), because
imprecision in TBW measurements is not then involved. However, the accuracy of predicting the reference 4-CM assessment of TBP varies according to DXA instrumenta-tion, and apparently also improves significantly when estimated TBW, rather than measured TBW, is integrated into the DXA model (Tables 4 and 5). For adults, and men in particular, there is substantial bias between the DXA model with measured TBW, for both Hologic QDR 1000/W and Lunar DPX instrumentation, and the 4-CM (up to about 21 % for men using the Lunar DPX instrument, Table 4), and also wide 95 % limits of agreement (Table 4). Therefore, this DXA model and the 4-CM should not be used interchangeably for adults, even if the constant bias between them is taken into account when using the Hologic QDR 1000/W. Furthermore, estimates obtained using the Lunar DPX in adults are further confounded by the significant relationship between the differences in measure-ments and the size of estimate (Table 4).
A possible explanation for the improvement in predicting TBP using estimated TBW is that, when an individual HFffm
deviates from the assumed population-specific constant, discrepant measurements of FFST would be obtained (the magnitude of error depends on the extent of this deviation). Under such circumstances, discrepant FFST assessments would lead to erroneous estimates of TBP when measured TBW is then integrated into the DXA model (i.e. although TBW is correct, the difference between FFST and TBW is incorrect and it is by difference that TBP is calculated, see equation on p. 47). However, more ‘correct’ estimates of TBP would be obtained if an assumed TBW, based on discrepant FFST estimates due to inappropriate use of a constant for HFffm, were to be integrated into this model
instead. This is because, although TBW and FFST are now ‘erroneous’, both errors are related to the extent of deviation of the individual HFffm, from the assumed constant value
(i.e. the true individual TBW:FFM ratio remains intact) and, therefore, would be effectively cancelled out by difference when calculating TBP. It should be noted that the difference between FFST and TBW would increase (i.e. increasing the error for calculating TBP) as the individual HFffmdeviates
further from the assumed constant for HFffm, because as the
TBW:FFM ratio increases, the absolute difference between TBW and FFM also increases. However, in health or in populations where there is little variability in HFffm,
conclusive evidence of this difference may not be observable as it would be at least partially masked by other factors such as measurement imprecision.
Moreover, a similar circumstance was reported for the estimation of FFM using DXA as an index of protein status
(Borovnicar et al. 1996), in which TBP (FFM) was
increasingly overestimated in individuals with increasing levels of over-hydration. In our study, it was only the technique based on Lunar DPX instrumentation that showed this trend, possibly due to the use of assumptions that differed from those of the Hologic QDR 1000/W technology. Although this apparent circularity of logic is of concern, it was not confirmed by analysis of the algorithms used, which are usually not released by the different manufacturers of DXA instruments (see later for further deliberations).
Table 6.The relative impact of method imprecision on differences between the dual-energy X-ray and four-component models of total
body protein*†‡
Percentage of difference between models due to measurement imprecision, based on: Measured total body water Assumed HFffm % SDd (kg) % SDd (kg)
DXA model using:
Lunar instrumentation in adults 16:1 2:0 36:7 1:1 Hologic instrumentation in adults 8:9 2:3 16:9 1:3 Hologic instrumentation in children 10:6 1:4 26:3 0:8
HFffm, hydration fraction of the fat-free mass;SDd, standard deviation of the difference between methods; DXA, dual-energy X-ray absorptiometry. * For details of subjects and procedures, see Table 1 and pp. 46 – 47. † DXA instrumentation: Hologic QDR 1000/W (Hologic, Waltham, MA, USA)
or Lunar DPX (Lunar Radiation Corporation, Madison, WI, USA). ‡ The contribution of measurement imprecision to differences between
methods for assessing total body protein was calculated by estimating precision for the methods combined, calculated as the sum of their indi-vidual variances (SDsquared), divided by the variance (SDdsquared) between methods.SDdbetween methods is equal to the 95 % limits of agreement (Bland & Altman, 1986) divided by 4. For further details of cal-culations, see pp. 47 – 48.
The small contribution of measurement precision to the difference between methods indicates that other factors are responsible for the bulk of this difference. Biological changes are not responsible for most of the variance as the same subjects were assessed by the different techniques over very short periods of time (usually within about 2 h). Therefore, it is probably due to the way in which biological variables are measured and interpreted by the different techniques. This depends on the applied assumptions and algorithms used by the software employed in the DXA instrumentation. Despite support for this contention from the observation that biases between the 4-CM and DXA models are different when measurements from the Hologic QDR 1000/W and Lunar DPX instruments are applied, other plausible explanations are possible.
Such explanations could include: (1) the use of slightly different TBW measurement technologies for each of the studies; or perhaps (2) variation in anthropometric characteristics between the groups. First, although two techniques for TBW estimation were used in this study (isotope ratio MS v. i.r. spectrophotometry, see p. 47), differences in agreement between the 4-CM and DXA
model of TBP using Hologic QDR 1000/W estimates v.
Lunar DPX estimates were not considered attributable to differences between these techniques, because no signifi-cant difference was observed when estimates of enrichment of the same body fluids were assessed by the two methods in a recent comparative study (Jenningset al.1999). Second, such discrepancies were also probably less attributable to the anthropometric and body composition differences between the groups of subjects than to inconsistent or inappropriate assumptions or algorithms applied within the different types of DXA instrumentation, as may be illustrated by adjusting measured values obtained from the Hologic QDR 1000/W DXA instrumentation to those that might have been obtained if Lunar DPX instrumentation had been used to assess the same subjects.
In addition to the assumptions concerning TBW and HFffm (considered earlier), the contention that significant
variability between DXA estimates occurs due to the use of different assumptions or algorithms is supported by the observation that mean estimates of BMC may be lower by about 15 % with the Hologic QDR 1000/W compared with the Lunar DPX technology (Tothill et al. 1994b; Laskey, 1996). This is illustrated by adjusting the group mean value of BMC obtained with the Hologic QDR 1000/W DXA (2:65 kg) instrument to that which might supposedly have been obtained with the Lunar DXA (3:05 kg, 15 % higher). Measurements by the other techniques (from Table 1) and the FFST estimate incorporated into the 4-CM and DXA models were kept constant and assumed to be the following: BWt 80:4 kg, TBW 40:2 kg, BV 78:3 litres, FFST 53:1 kg. Based on the Hologic QDR 1000/W estimate of BMC, TBP calculated using the 4-CM was 11:2 kg and by the DXA model it was 12:3 kg, a difference of21:1 kg; using Lunar DPX estimates, TBP calculated by the 4-CM was 10:1 kg
and with the DXA model was 12:2 kg, a difference of
22:1 kg (compare with Table 4).
There are also differences between Hologic QDR 1000/W and Lunar DPX instruments when estimating % body fat, the mean value of which may be lower by about 3:7 % using
Hologic QDR 1000/W instrumentation (Tothill et al.
1994a), that could further compromise TBP assessments through the use of discrepant estimates of FFST incorporated into the DXA models of TBP (see equations on p. 47). In contrast, the 4-CM is minimally affected by such differences between DXA instruments as it is only BMC which is incorporated in the model which has a relatively low contribution (small factor for the BMC term in the equation) to the model compared with the other measurements.
In view of possible pitfalls identified here, both reference 4-CM and DXA model estimates of TBP should be treated with caution. However, such models do have potential to improve clinical practice (beyond muscle palpation) and research, especially for longitudinal and group studies, even if absolute estimates for individuals are less certain. Furthermore, developments in TBW estimation, such as i.r. spectrophotometry (Jenningset al.1999) used in place of time-consuming and costly MS, and in body density, such as the Bodpod (Body Composition System; Life Measurement Instruments, Concord, CA, USA) instead of under-water weighing in both adults (McCroryet al.1995) and children (Dewit et al. 2000), make these models more accessible generally.
References
Bland JM & Altman DG (1986) Statistical methods for assessing agreement between two methods of clinical measurement. Lanceti, 307 – 310.
Borovnicar DJ, Wong KC, Kerr PG, Stroud DB, Xiong DW, Strauss BJG & Atkins RC (1996) Total body protein status assessed by different estimates of fat-free mass in adult peritoneal dialysis patients. European Journal of Clinical Nutrition50, 607 – 616.
Brozek J, Grande F, Anderson JT & Keys A (1963) Densitometric analysis of body composition: revision of some quantitative assumptions. Annals of New York Academy of Sciences110, 113 – 140.
Cohn SH (1992) In vivo neutron activation analysis; a new technique in nutritional research. Journal of Nutritional Biochemistry3, 378 – 386.
Dewit O, Fuller NJ, Fewtrell MS, Elia M & Wells JCK (2000) Whole body air displacement plethysmography compared with hydrodensitometry for body composition analysis.Archives of Disease in Childhood82, 159 – 164.
Fuller NJ, Hardingham CR, Graves M, Screaton N, Dixon AK, Ward LC & Elia M (1999a) Predicting composition of leg sections with anthropometry and bioelectrical impedance analysis, using magnetic resonance imaging as reference. Clinical Science96, 647 – 657.
Fuller NJ, Hardingham CR, Graves M, Screaton N, Dixon AK, Ward LC & Elia M (1999b) Assessment of limb muscle and adipose tissue by dual-energy X-ray absorptiometry using magnetic resonance imaging for comparison. International Journal of Obesity23, 1295 – 1302.
Fuller NJ, Jebb SA, Laskey MA, Coward WA & Elia M (1992a) Four-component model for the assessment of body composition in humans: comparison with alternative methods, and evaluation of the density and hydration of fat-free mass.Clinical Science 82, 687 – 693.
absorptiometry (DEXA), with special reference to limb muscle mass.Clinical Physiology12, 253 – 266.
Fuller NJ, Sawyer MB, Laskey MA, Paxton P & Elia M (1996) Prediction of body composition in elderly men over 75 years of age.Annals of Human Biology23, 127 – 147.
Heymsfield SB, Lichtman S, Baumgartner RN, Wang J, Kamen Y, Aliprantis A & Pierson RN Jr (1990) Body composition of humans: comparison of two improved four-compartment models that differ in expense, technical complexity, and radiation exposure.American Journal of Clinical Nutrition52, 52 – 58. Hill GL (1992) Body composition research: implications for the
practice of clinical nutrition.Journal of Parenteral and Enteral Nutrition16, 197 – 218.
Jebb SA, Goldberg GR, Jennings G & Elia M (1995) Dual-energy X-ray absorptiometry measurements of body composition: effects of depth and tissue thickness, including comparisons with direct analysis.Clinical Science88, 319 – 324.
Jennings G, Bluck LJC, Wright A & Elia M (1999) The use of infra-red spectrophotometry for measuring body water spaces. Clinical Chemistry45, 1077 – 1081.
Laskey MA (1996) Dual-energy X-ray absorptiometry and body composition.Nutrition12, 45 – 51.
Lohman TG (1989) Assessment of body composition in children. Pediatric Exercise Science1, 19 – 30.
McCrory MA, Gomez TD, Bernauer EM & Mole´ PA (1995) Evaluation of a new air displacement plethysmograph for measuring human body composition.Medicine and Science in Sports and Exercise27, 1686 – 1691.
Murgatroyd PR & Coward WA (1989) An improved method for estimating changes in whole-body fat and protein mass in man. British Journal of Nutrition62, 311 – 314.
Pullicino E, Coward WA, Stubbs RJ & Elia M (1990) Bedside and field methods for assessing body composition: comparison with the deuterium dilution technique.European Journal of Clinical Nutrition44, 753 – 762.
Roubenoff R, Kehayias JJ, Dawson-Hughes B & Heymsfield SB (1993) Use of dual-energy X-ray absorptiometry in body composition studies: not yet a “gold standard”. American Journal of Clinical Nutrition58, 589 – 591.
Siri WE (1961) Body composition from fluid spaces and density: analysis of methods. In Techniques for Measuring Body Composition, pp. 223 – 244 [J Brozek and A Henschel, editors]. Washington, DC: National Academy of Sciences – NRC. Tothill P (1995) Dual-energy X-ray absorptiometry for the
measurement of bone and soft tissue composition. Clinical Nutrition14, 263 – 268.
Tothill P, Avenell A, Love J & Reid DM (1994a) Comparisons between Hologic, Lunar and Norland dual-energy X-ray absorptiometers and other techniques used for whole-body soft tissue measurements. European Journal of Clinical Nutrition 48, 781 – 794.
Tothill P, Avenell A & Reid DM (1994b) Precision and accuracy of measurements of whole-body bone mineral: comparisons between Hologic, Lunar and Norland dual-energy X-ray absorptiometers.British Journal of Radiology67, 1210 – 1217. Wells JCK, Fuller NJ, Dewit O, Fewtrell MS, Elia M & Cole TJ
(1999) Four-component model of body composition in children: density and hydration of fat-free mass and comparison with simpler models. American Journal of Clinical Nutrition 69, 904 – 912.