Available online:
http://edupediapublications.org/journals/index.php/IJR/
P a g e | 277Comparison Study between Experimental and ANFIS
Results for Material Removal Rate in EDM Process
Riyadh J. Fahad
1, and Dr. Shukry H. Aghdeab
21,2
Department of Production Engineering and Metallurgy, University of Technology,
Baghdad, Iraq
Abstract:
This work is a comparison study between experimental and ANFIS results focuses on studying the material removal rate (MRR) for five shapes under different conditions of pulse on time (T-on), current (I) and the shape of work piece (Shw). The major
purpose of this study is to obtain the best MRR, by using a flat electrode of copper when machining five shapes (A,B,C,D,E). Experiment is carried out by using AISI 304 stainless steel specimens of thickness (2 mm). Different values of (T-on) (100,150 and 200) µs, and different currents of (10, 20 and 30) A were used. The experimental results reveal that the MRR enhances by an increase in the current values. Also the results show that the MRR improves with an
increase in the (T-on). From the
comparison between experimental and ANFIS results, the min. error is (0.0006) was obtained in shape (B), the max. error is (-0.0252) was obtained in shape (C).
Keywords
Material Removal Rate, Electrode Wear Rate, EDM, ANFIS.
1.
Introduction
Electrical Discharge Machining (EDM) is an important manufacturing process for machining alloys and hard metals irrespective of the hardness, such as, graphite, metallic alloys, or even some conductive ceramic materials. This process is widely used for producing molds, dies, and finishing parts for automotive, surgical components, and aerospace. The process is capable of getting surface finish and required accuracy by
controlling the process parameters. EDM performance is generally evaluated on the basis of MRR, OC, SR and EWR. The important EDM parameters affecting to the performance measures of the process are (I), (T-on), (T-off), gap between the electrod and the w.p, and (τ) [1]. EDM has been replacing the almost all machining operations, and is capable of machining complex shapes or hard material components, that are precise and difficult-to-machine such as heat treated tool steels, composites, super alloys, ceramics, carbides, heat resistant steels etc. being widely used in die and mold, aerospace, medical and surgical, optical, automotive and nuclear industries [2,3].
2. Principle of EDM Process
Available online:
http://edupediapublications.org/journals/index.php/IJR/
P a g e | 278material from both the electrod and w.p, which increases the distance between the electrod and w.p at that point. This causes the next spark to occur at the next-closest points between the electrod and w.p. The MRR is usually between (2-400 mm3/min) [2,3].
Figure (1): EDM spark description [6].
This study aims to achieve the best MRR by make a comparison study between experimental and ANFIS results, by using a flat copper electrode with dimensions (6×5 mm) when machining five shapes of AISI 304 SS specimens of thickness (2 mm) by using an EDM process.
3. Experimental Work
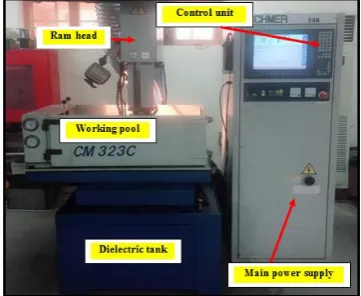
The experiments were done on the EDM machine as in Figure (2), called CHMER of model (CM 323C) at the University of Technology-Training and Workshops Center. Copper electrode used to machine a w.p of AISI 304 SS, and transformer oil was used as a dielectric.
Figure (2): CHMER EDM machine.
The electrode material selected in this study is copper. The shape of electrode is rectangular with dimensions (6×5 mm) as shown in Figure (3).
Figure (3): The dimensions of electrode after cutting by WEDM.
4. Design of experiments
The process parameters, selected for this study were the Shw, (I) and (T-on) as shown in Table
(1).
Table (1)shows the factors and their levels with coded and actual values.
5. Material Removal Rate (MRR)
MRR is the rate at which the material is removed the w.p. The MRR is defined also, as the ratio of the difference in weight of the w.p before and after machining to the density of the material and the machining time [7].
Coded/ Actual levels
Machining
Parameters
Sym
bol
Un
it
1
2
3
4
5
Workpiece
shape
Sh
w-
A
B
C
D E
Discharge
current
I
A
10 20 30
Pulse on
time
T-on
µs
10
0
15
0
20
Available online:
http://edupediapublications.org/journals/index.php/IJR/
P a g e | 279MRR is calculated by using formula (1) [8]
(mm3.min-1)
Where:
W𝑖𝑤 = Initial w.p weight (gm). W𝑓𝑤= Final w.p weight (gm).
ρw= W.p density (gm.mm-3). t = Period machining time (min).
6. Results and Discussion
The effects of main process variables like the (Shw), (I) and (T-on), have been analyzed to obtain
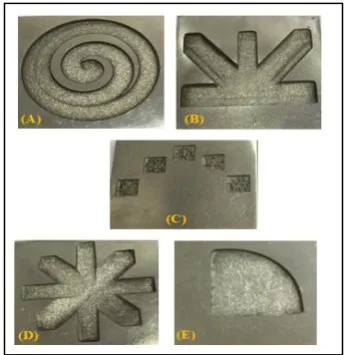
the optimal machining performance. Five shapes (A, B, C, D and E) of AISI 304 SS w.p after machining by EDM are shown in Figure (4).
Figure (4): Five shapes of 304 SS workpiece: A- Spiral cone shape, B- Plane radial square 3D shape, C- Arc shape, D- Plane radial circle 3D shape, and E-
Quadrant shape.
6.1 Comparison MRR for A Shape
Figure (5)
shows the comparison between theexperimental and predicted values obtained by ANFIS model. The ANFIS predicted MRR values show a good agreement with those obtained experimentally. The prediction error ( - 0.0077), it is evident that the ANFIS technique can help to get better prediction of the experimental data. The max. value of MRR was (25.804 mm3.min-1) getting with a
higher (I) of (30A) and high (T-on) of (200 µs). While the min. MRR was (9.995 mm3.min-1) get with
a low (I) of (10A), and low (T-on) of (100 µs).
Figure (5): Comparison MRR between experimental and ANFIS for A shape.
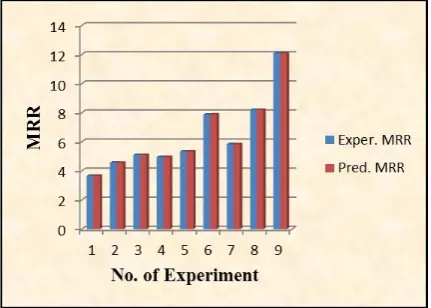
6.2 Comparison MRR for B Shape
Figure (6) shows the compared and predicted values obtained by ANFIS model with those obtained and estimated from the experiment. The ANFIS predicted MRR values show a good agreement with those obtained experimentally. The prediction error is (0.0006). The max. value of MRR was (21.9803 mm3.min-1) getting with a higher (I) of (30A) and
high (T-on) value of (200 µs). While the min. MRR was (5.7951 mm3.min-1) got with a low (I) of (10A),
and low (T-on) of (100 µs).
Figure (6): Comparison MRR between experimental and ANFIS for B shape.
6.3 Comparison MRR for C Shape
Available online:
http://edupediapublications.org/journals/index.php/IJR/
P a g e | 280value of (30A) and high (T-on) value of (200 µs). While the min. MRR was (17.182 mm3.min-1) got
with a low (I) of (10A), and low (T-on) of (100 µs).
Figure (7): Comparison MRR between experimental and ANFIS for C shape.
6.4 Comparison MRR for D Shape
Figure (8) shows the compared and predicted values obtained by ANFIS model with those obtained and estimated from the experiment. The prediction error (0.0022). The maximum value of MRR was (12.1049 mm3.min-1) getting with a
higher (I) of (30A) and high (T-on) of (200 µs). While the min. MRR was (3.6624 mm3.min-1) got
with a low (I) of (10A), and low (T-on) of (100 µs).
Figure (8): Comparison MRR between experimental and ANFIS for D shape.
6.5 Comparison MRR for E Shape
Figure (9) shows the compared and predicted values obtained by ANFIS model with those obtained and estimated from the experiment. The prediction error (0.0085). The max. of MRR was (18.797 mm3.min-1) getting with a higher (I) of (30A)
and high (T-on) of (200 µs). While the min. MRR
was (95.8351 mm3.min-1) got with a low (I) of (10A),
and low (T-on) of (100 µs).
Figure (9): Comparison MRR between experimental and ANFIS for E shape.
7.Conclusions
The important conclusions which can be noted
from this work can be summarized as follows:1. From the experiments, the max. MRR got (31.5648 mm3.min-1) with a higher current
value of (30A) and high (T-on) of (200 µs) at the (C) shape.
2. From the experiments, the min. MRR was (3.6624 mm3.min-1) get with a low current
value of (10A), and low (T-on) of (100 µs) at the (D) shape.
3. From the comparison between experimental and ANFIS results, the min. error is (0.0006) was obtained in shape (B).
4. From the comparison between experimental and ANFIS results, the max. error is (-0.0252) was obtained in shape (C).
References
1.
Rahulkumar B. Chaudhary, V. D. Patel and Priyesh N. Santoki," A Review – Comparative Study and Optimization of Different Tool Material on AISI 2136 (Plastic Mould Steel) in EDM ", International Journal for ScientificResearch and Development,Vol. 3, pp.
225–227, 2016.
Available online:
http://edupediapublications.org/journals/index.php/IJR/
P a g e | 281Journal of Engineering Sciences and Research Technology, Vol. 6, pp. 640– 647, 2017.
3.
C. R. Sanghani and G. D. Acharya, " A Review of Research on Improvement and Optimization of Performance Measures for Electrical Discharge Machining ", Journal of Engineering Research and Applications, Vol.4, pp. 433–450, 2014.4.
Niray G. Patei and Naresh D. Chauhan, " A Review on Techniques for Modeling and Optimizing Process Parameters for Electro Discharge Machining, International Journal for Innovative Research in Science and Technology, Vol. 1, pp. 217 – 221, 2015.5.
Hardikkumar Prakashbhai Patel and Rajat Dave, "A Review on Influence of Process Parameters and Electrodes Materials in EDM Process", International Journal for Innovative Research in Science and Technology, Vol. 3, pp. 98-100, 2017.6.
El-Hofy, H.A.G., "Advanced Machining Processes; Non Traditional and Hybrid Machining Processes", McGraw-Hill, New York, 2005.7.
Rahul Singh and Lokendra Pal Singh,"Analytical Investigation of Variable Parameters on Cutting Effect of Stainless Steel in EDM", International Journal of Engineering Sciences and Research Technology, Vol.6, pp.304-308, 2017.
8.
Shailesh Dewangan, Soumya Gangopadhyay and Chandan Kumar Biswas, "Multi-response optimization of surface integrity characteristics of EDM process using grey-fuzzy logic-based hybrid approach", EngineeringScience and Technology, an