Strengthening the Evidence that Attack Surfaces Can Be
Approximated with Stack Traces
Christopher Theisen, Rahul Krishna, Laurie WIlliams
Department of Computer Science North Carolina State University
{crtheise, rkrish11, lawilli3 }@ncsu.edu
ABSTRACT
Proactive security review and test efforts are a necessary component of the software development lifecycle. Resource limitations often preclude reviewing the entire code base. Making informed decisions on what code to review can improve a team’s ability to find and remove more vulnerabilities. Automated attack surface approximation is a technique that uses crash dump stack traces to predict what code may contain exploitable vulnerabilities. The goal of this research is to help software development teams prioritize security efforts by approximating the attack surface of a software system via stack trace analysis. We explore the attack surface approximation approach using Firefox stack traces. We also generate a vulnerability prediction model using metrics such as frequency of appearance, code churn, and unique authors. We create an attack surface approximation at the file level, in which the 8.4% of the files that were part of the attack surface approximation contained 72.1% of the vulnerabilities seen for the Firefox product. We observed a recall for vulnerability prediction of 0.8 and a precision of 0.04. We generate a decision tree based on churn, author count, and our attack surface approximation metric to guide practitioners in prioritizing code for security review. These results corroborate previous work that showed crash dump stack traces can be used as a metric to prioritize security efforts.
Categories and Subject Descriptors
D.2.8 [Software Engineering]: Metrics – Process Metrics, Product Metrics.
General Terms
Management, Measurement, Documentation, Experimentation, Security.
Keywords
stack traces, attack surface, prediction models
1.
INTRODUCTION
The attack surface of a system can be used for determining which parts of a system could have exploitable vulnerabilities. If data cannot be passed to a vulnerability from outside a system, perhaps precious engineering hours working on finding and fixing vulnerabilities should be spent elsewhere. The Open Web Application Security Project (OWASP) defines the attack surface
of a system as the paths in and out of a system, the data that travels those paths, and the code that protects the paths and the data.1 Items not on the attack surface of a system are unreachable
by outside input, and therefore less likely to be exploited [1]. Vulnerability detection and removal techniques, such as security reviews and penetration testing, can then be prioritized to the attack surface rather than the entire codebase. Reducing the amount of code to be inspected may help improve the economics of security assessments and allow for more proactive reviews of potentially vulnerable code. Previous efforts to determine the attack surface of a system have used API scanning techniques [41], but these techniques require a large amount of manual effort from practitioners.
Automated attack surface approximation (ASA) [1] is an approach to identifying code in a software system that is contained on the attack surface through crash dump stack trace analysis. Depending upon the granularity of the analysis, these units could be binaries, files, or methods. In ASA, all code found in the stack traces from crash dumps is classified as being on the attack surfaced of a system. By definition, code that appears in stack traces caused by outside activity is on the attack surface. Crash dumps may be a useful metric for determining where security vulnerabilities might be in code, because they represent code that has been involved in a failure. Crash dumps are sometimes used by attackers to determine where security vulnerabilities might be and/or to create a denial of service. Using crash dump stack traces as a metric for proactive security hardening efforts may help security professionals find them before the attackers do.
The goal of this research is to help software development teams prioritize security efforts by approximating the attack surface of a software system via stack trace analysis. In this work, we look at two methods of approximating the attack surface of a system. The first is a binary classification (on/off) as performed in previous work [1]. The second counts the number of occurrences of code in stack traces, allowing for a priority system for performing security reviews. Furthermore, we also developed a Vulnerability Prediction Model (VPM) to guide practitioners in these prioritization efforts. Finally, we generate a decision tree based on code metrics and stack trace appearances from ASA to help guide prioritization efforts when deciding what code to review.
We explore the following research questions:
RQ1: How effective is the attack surface approximation approach in predicting the location of vulnerabilities?
1https://www.owasp.org/index.php?title=Attack_Surface_Analysis_
RQ2 How can we improve Vulnerability Prediction Model performance with attack surface approximation?
RQ3: How could a decision tree with attack surface approximation be used to prioritize security efforts?
In this paper, we build an ASA for Firefox, based on stack traces from the Firefox historical crash dump stack trace defect repository2. A set of scripts parses the information in the traces. To assess ASA, we compared the set of known security vulnerabilities from Mozilla’s bug database3 during the same time period against the files identified as part of the approximation. We replicate the Windows 8 ASA [1] and apply it to Mozilla Firefox.
We include the following as contributions in this paper:
• An evaluation of the effectiveness of attack surface approximation for an open source application that corroborates with an earlier attack surface approximation study on a proprietary product.
• A vulnerability prediction model that uses the attack surface approximation
• A decision tree approach for aiding in the selection of which files to inspect and/or test.
The rest of the paper is organized as follows: Section 2 discusses background and related work, Section 3 presents our research methodology, Section 4 presents our case study, Section 5 discusses the results and the meaning of each, Section 6 presents limitations and threats to validity, and Section 7 summarizes and discusses future work.
2.
BACKGROUND AND RELATED WORK
In this section, we provide a brief overview of related work and the previous study done in the area of attack surfaces and defect prediction.
2.1
Attack Surface
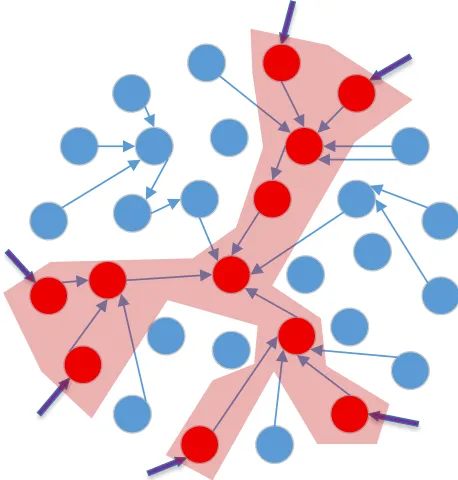
As mentioned previously, The Open Web Application Security Project (OWASP) defines the attack surface of a system as the paths into and out of a system, the data that travels those paths, and the code that protects the paths and the data. The attack surface definition also includes “the sum of all paths for data/commands into and out of the application.” Howard et al. [17] provided a definition of attack surface using three dimensions: 1) targets and enablers, 2) channels and protocols, and 3) access rights. Not all areas of a system may be directly or indirectly exposed to the outside. Some parts of a complex software system, e.g. Windows OS, may not be reachable or exploitable by an attacker. In Figure 1, we present a graphical representation of what the attack surface of a system is. The nodes with the thick dark arrows pointing at them are the entry points into a system, showing where an outsider can pass input into a system. The remaining shaded nodes and arrows represent the path outside input takes through the system, with data eventually terminating in the center of the system. These central nodes are typically crash handlers in our analysis due to inspecting stack traces.
Manadhata et al. [32] describe how an attack surface might be approximated by looking at Application Program Interface (API)
2 https://crash-analysis.mozilla.com/crash_analysis 3 https://bugzilla.mozilla.org/
entry points. However, the Manadhata approach does not cover all exposed code, as the authors mention. Specifically, internal flow of data through a system could not be identified. While the external points of a system are a useful place to start, they do not encompass the entirety of exposed code in the system. Internal points within the system could also contain security vulnerabilities that the reviewer should be aware of. Further, their approach to measuring attack surfaces required expert judgment of security professionals to determine if code is security relevant.
In a previous ASA study [1], researchers found a correlation between binaries that appear on stack traces generated by the system and historical vulnerabilities discovered by security professionals have been fixed in code. The correlation could be useful to security professionals when targeting security reviews of codebases. By targeting security efforts to binaries in the ASA instead of the entire codebase, security professionals could save engineering hours. The researchers created the ASA by parsing stack traces from Windows 8 OS, and including any binaries involved in a stack trace in their approximation. They evaluated the effectiveness of their approach by comparing the approximation against the location of historical vulnerabilities in Windows 8 OS. In that study, 48.4% of shipped binaries seen in at least one crash dump stack trace in Windows 8 OS contained 94.8% of the vulnerabilities seen over the same time period [1]. However, the industrial study has a few limitations. First, the approximation was only performed at the binary level of the application. A single binary could contain thousands of files, making the metric difficult to act on. Second, The industrial study only looked at an operating system. To address these concerns, we construct an ASA using stack traces at the file level instead of the binary level. We also perform the approximation on an open source application instead of an operating system.
2.2
Exploiting Crash Dumps
The use of crash dumps, including stack traces from the crashes, is becoming used more frequently for identifying defects and vulnerabilities4 [22][24]. Liblit and Aiken [18] introduced a technique automatically reconstructing complete execution paths using stack traces and execution profiles. Later, Manevich et al. [19] added data flow analysis information on Liblit and Aiken’s approach to explain program failures. Other studies use stack traces to localize the exact fault location [20][21][22]. An increasing number of empirical studies use bug reports and crash dumps to cluster bug reports according to their similarity and diversity, e.g. Podgurski et al. [23] were among the first to take this approach. Other studies followed [24][25]. Not all crash dumps are precise enough to allow for clustering. Guo et al. [26] used crash dump information to predict which bugs will get fixed. Bettenburg et al. [27] assessed the quality of bug reports to suggest better and more accurate information for helping developers to fix the bug.
With respect to vulnerabilities, Huang et al. [28] used crash dumps to generate new exploits while Holler et al. [29] used historic crashes reports to mutate corresponding input data to find incomplete fixes. Kim et al. [30] analyzed security bug reports to predict “top crashes”—those few crashes that account for the majority of crash dumps—before new software releases.
2.3
Defect and Vulnerability Prediction
Models
The goal of defect prediction models (DPMs) is to identify code that is most likely to contain defects. For example, Nagappan and Ball [3] showed that code churn metrics can be used to predict defect density, the number of defects per line of code. Later, Zimmermann et al. [4] used code dependency information and network metrics to classify defect prone code. Other studies used change-related [1], developer-related [5], organizational [6], process [7], change dependency [8], and test [9] metrics to build DPMs. Hall et al. [10] presented a systematic literature review of DPMs and showed that model-building methodology impacts prediction accuracy.
Vulnerability Prediction Models (VPMs) predict code with the highest chance of containing vulnerabilities. Studying VPMs for Microsoft Windows, Zimmermann et al. [11] concluded that vulnerabilities are not as simple to predict as defects. A study on Mozilla’s Firefox web browser showed that, on Firefox, fault prediction model and the vulnerability prediction model provided similar prediction performance [12]. In general, many VPMs presented in the literature are based on the same basic principles as DPMs, with adjustments to account for the relative rarity of security vulnerabilities. Transferring the concept of DPMs to VPMs, many studies use complexity, code churn, or static-alert measurements to predict vulnerabilities [13][14][15]. Published VPMs [16] have had challenges achieving precision and recall rates that DPMs have been able to achieve, presumably due to the relative rarity of vulnerabilities. As a result, VPMs may not be considered for practical use.
Another limitation of VPM’s is the number of metrics found in the models, many which are unreasonable to collect for open source projects or smaller development shops. The Zimmermann
4
http://www.crashlytics.com/blog/its-finally-here-announcing-crashlytics-for android/
VPM used in the 2014 study used 29 metrics in 6 categories [1]. Many of these metrics, such as McCabe complexity metrics, security reset metrics, and number of paths through a system are not collected by many teams.
In the previous ASA study [1], a Vulnerability Prediction Model (VPM) was also constructed using the files identified as being on the attack surface of Windows 8 OS. The VPM showed statistically significant improvements over a control setup with all files considered potentially vulnerable. The researchers found that it could predict vulnerabilities with a precision of .69 and recall of .05 for source files [1]. While the model has a high precision, and therefore high likelihood of an identified vulnerability being a true positive, only 5% of the total number of vulnerabilities were predicted by the VPM. For a prediction model to have a practical impact for practitioners, the recall figures must improve.
2.4
Defect Prediction and SMOTE
A study conducted by Lessmann et al. [37] compared 21 different learners for software defect prediction. They found Random Forest to be the best classifier. Random Forest is a form of ensemble learning scheme. It works by constructing a number of decision trees at the training time.
Random Forests, like other predictors, tend to perform poorly if there is an imbalance in classes during the training phase. When dealing with highly imbalanced datasets, prediction models tend to fail. For these imbalanced datasets, prediction models will tend to predict that everything falls on the majority side of the dataset. For example, if vulnerabilities only occur in 1% of the codebase, 99% of the code therefore doesn’t have a vulnerability. The prediction model can then declare that there are no vulnerabilities in the code and have a 99% success rate. While that may be a “good” statistical result, it is not a useful result for the user of the model if they are interested in the minority set of the data – in that case, the searcher wants to find minority part of the dataset, and does not care about predicting the majority set at all.
Sampling schemes are commonly used to adapt machine learning tools to handle the class imbalance and to prevent misclassification of items in the dataset. Pelayo and Dick [38] found that the Synthetic Minority Over-sampling Technique (SMOTE) [35] can be used to improve the recognition of defect prone modules in a software system.
3.
RESEARCH METHODOLOGY
In this section, we discuss our research methodology to answer our three research questions.
3.1
Attack Surface Approximation (ASA)
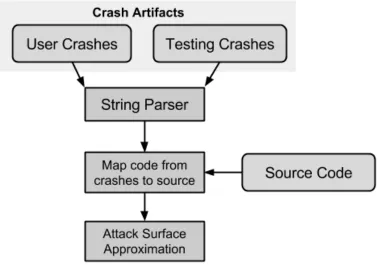
stack traces were chosen from. Vulnerability data is gathered for the entire product, not just those in code found in stack traces. For stack trace parsing, we isolate the binary, file, or function that is seen on each line of each stack trace, recording each one that was seen and how many times it has been seen in a stack trace. To accomplish this task, we created a toolset to parse each individual stack trace in sequence, and extract the individual code elements that appear on each line. The tool then outputs the frequency in which each unique code element appears in a stack trace from the parsed set. To tie stack trace appearances to the codebase, we generate a list of all source code files from the system under inspection and combine that list with the list of appearances in stack traces. This process is visualized in Figure 2. We collect several pieces of data for use in the evaluation of our ASA. We first identify all unique files present in the codebase under evaluation. We then identify all files in the codebase, and count each reference to a file in each stack trace we parse. Files are identified via source code analysis first, such as pulling the master repository for the project.
In addition to the list of files on the ASA, We count the number of those files that have security vulnerabilities. After we have these two counts, we can calculate the percentage of files that are considered to be on the ASA at that point, along with the percentage of files with security vulnerabilities on the ASA.
3.2
Practical Prioritization
Narrowing down the number of decisions to be made when selecting files for review is beneficial. Decision trees can help practitioners make these decisions by providing a visualization of best splits of the data based on the given metrics. By limiting the space that security reviewers need to handle, they can make better use of their limited time to find vulnerabilities.
We construct a decision tree for files based on three metrics: (1) number of appearances in stack traces, (2) number of times a file was changed (code churn), and (3) the number of unique authors
that changed that file. These metrics were chosen because they are readily available for most organizations. If an organization is using source control, these metrics will be available. By performing a series of best splits on the dataset when trying to predict vulnerabilities, we can generate a decision tree that practitioners can use when trying to decide what files to inspect or test. The goal is to find splits that provide a set of files with a high percentage of vulnerabilities, giving practitioners a place to start.
The decision trees were generated in JMP Pro 11 by SAS5 using
the decision tree package. We made use of the “Best Split” functionality within JMP, which has the decision tree split on the highest G^2 score for a split of a specific table. The G^2 score is a representation of how good the split point is in creating two distinct datasets with the greatest difference in density of the dependent variable. Best splits were used to find the highest densities of vulnerabilities in the system.
3.3
VPM Construction
As discussed in Section 2.4, we have used Random Forests with SMOTE as our vulnerability prediction model. For our model, the independent variables were the classification of code as having a vulnerability, while the dependent variables are code churn, number of unique authors, and ASA. The Random Forest Classifier was taken from the SciKit Learn toolkit [40]. Our Random Forest used 10 trees to build the forest. As a criterion to measure the quality of split, the Gini impurity measure was used. The Gini impurity is defined as how often a randomly chosen element would be incorrectly labeled if it were done randomly. As previously mentioned, the SMOTE technique was used in conjunction with Random forests. SMOTE is an over and under sampling technique which over samples the minority class and under samples the majority class.
5 http://www.jmp.com/en_us/software/jmp-pro.html
In SMOTE, over sampling works by introducing synthetic examples for each minority class. We choose a sample (say a) and finding its N nearest neighbors. For this study we used N = 5 because choosing one nearest neighbor limits the diversity of the synthetic samples. Another sample is then randomly picked from among those 5 nearest neighbors (say b). Then a new instance, c, is generated by an interpolation between samples a and b. This process is repeated until a desired amount of samples are obtained. For under sampling, existing samples are randomly removed from the majority class population until there are equal numbers of majority and minority class samples.
4.
FIREFOX CASE STUDY
In this section, we discuss the choice of data sources for this study along with domain-specific methodology concerns.
4.1
Data Collection
To perform our study, we needed to collect stack traces from a software system. We chose to use Mozilla’s Firefox product as our data source, due to the availability of stack traces and security vulnerability history for the system. Mozilla only makes security vulnerability details available once the vulnerability has passed out of public use in all versions of Firefox. Because of that policy, vulnerability information is only available from before 2012. Therefore, we could not make use of Mozilla’s primary stack trace data website, Mozilla Crash Reports6, as it only keeps full
stack traces from crashes for approximately 6-7 months. Instead, we made use of the historical dumps at https://crash-analysis.mozilla.com/crash_analysis/. The historical dataset contains approximately 10% of the crashes seen by the crash reporting system, sorted by day. Storing 10% of the crashes seen each day in the historical database keeps data storage requirements lower for the company. We performed our analysis on crashes occurring from May 2010 to March 2012 due to the available security data. Crash dumps from the historical dataset do not contain the entirety of the stack trace. Only the topmost filename is included in each trace. While the Firefox stack traces provide less detail than the Windows stack traces, observing only
6 https://crash-stats.mozilla.com/home/products/Firefox
the last file seen on the stack trace may be another approximation technique that eliminates more files from the attack surface. We explore the impact on the completeness of ASA, with the metric for completeness being the number of vulnerabilities seen on the approximation.
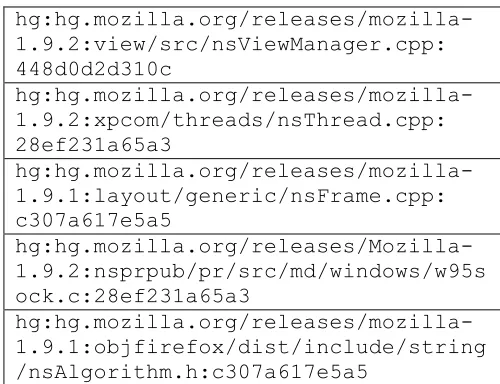
We further pruned the dataset to only crashes on the first day of every month in the time period to reduce the dataset. In the end, 1,013,770 occurrences of files in stack traces were recorded. Examples of the file format seen in the historical dumps can be seen in Figure 3.
To collect our security data, we parsed security reports from Mozilla’s security advisory blog from the same May 2010 to March 2012 period. Each security report presented by Mozilla has an associated diff or bug report, indicating what files were changed as part of the security fix. As mentioned previously, part of the reasoning behind selecting this time period was the availability of these security reports. Mozilla does not always release security bug details for newer vulnerabilities for a variety of reasons, such preventing the exploit from becoming more widespread. Mozilla makes vulnerability details available later after they are confident the issue has been resolved for their users.
Code churn and unique authors data were obtained from the Mozilla source code. Mozilla uses Mercurial7 to manage their
source code, which also maintains a change history and a historical information for the codebase. We pulled a snapshot of the codebase at the end of our study period (March 2012). We then extracted the history of each individual file seen in the codebase via the following command:
$ hg log -‐d "may 2010 to mar 2012" <path_to_firefox> + <file_path>
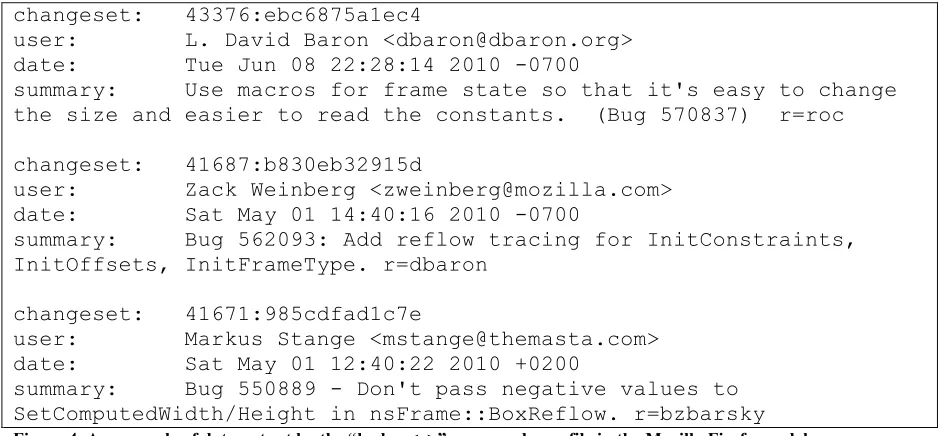
After extracting these statistics, we see a list of historical change information, as seen in Figure 4. We counted the total number of occurrences of changes to create our Churn metric, and the total number of unique email addresses and names for our Unique
metric. These metrics were included in our results, an example of which can be seen in Figure 5.
4.2
Analysis
We construct a decision tree based on our collected metrics: the number of times a file was seen in a stack trace, the number of unique authors, and the number of times a file was changed, as seen in Figure 4. Using SAS’s JMP Pro 11, a series of best splits on the dataset when trying to predict vulnerabilities, we can generate a decision tree that practitioners can use when trying to decide what files to inspect. The goal is to find splits that provide a set of files with a high percentage of vulnerabilities, giving practitioners a place to start. CrashAmount, Unique, and Churn were our independent variables for the decision tree, while Security, or whether there was a vulnerability seen historically in that file, was the dependent variable.
7 https://www.mercurial-scm.org/
hg:hg.mozilla.org/releases/mozilla-1.9.2:view/src/nsViewManager.cpp:
448d0d2d310c
hg:hg.mozilla.org/releases/mozilla-1.9.2:xpcom/threads/nsThread.cpp:
28ef231a65a3
hg:hg.mozilla.org/releases/mozilla-1.9.1:layout/generic/nsFrame.cpp:
c307a617e5a5
hg:hg.mozilla.org/releases/Mozilla-1.9.2:nsprpub/pr/src/md/windows/w95s
ock.c:28ef231a65a3
hg:hg.mozilla.org/releases/mozilla-1.9.1:objfirefox/dist/include/string
/nsAlgorithm.h:c307a617e5a5
In the version of SMOTE for this study, we over sample the minority class in the training data to have at least 500 samples. Likewise, we under sample the majority class so that only 500 samples remain. The set number of samples ensures an equal distribution of classes in training dataset. The purpose of the distribution is to improve learning on the training sets and improve the predictive power of the prediction model in terms of recall, or coverage of the vulnerabilities in the dataset.
5.
RESULTS AND DISCUSSION
In this section, we present our results and discuss what each of the results means for security professionals.
5.1
Attack Surface Approximation (RQ1)
RQ1: How effective is the attack surface approximation approach in predicting the attack surface of a new system, as measured by recall and precision?Our attack surface approximation results for the Mozilla Firefox product can be seen in Table 1. After applying ASA, we see that 8.4% of files (predicted by ASA as attack surface) contain 72.1% of the historical vulnerabilities seen over the same period of time
as the time period from which the stack traces are analyzed. The initial study on Windows 8 found that 48.4% of binaries contained 94.8% of historical vulnerabilities when filtering on binaries with a minimum of one appearance on a stack trace.
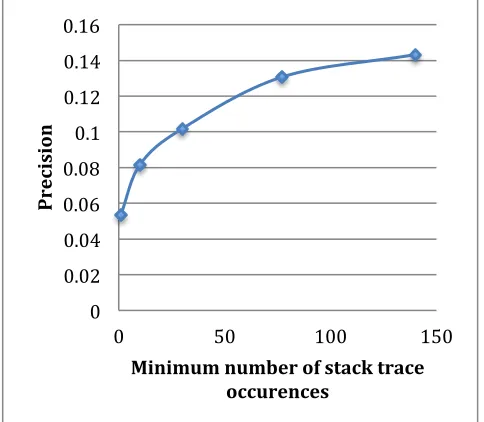
In addition to our baseline threshold of one occurrence on a stack trace, we explore other minimum thresholds for inclusion on the attack surface approximation. Table 1 shows that the precision of our approximation increases as we increase minimum thresholds. We split the analysis into five different sections: a simple on/off metric if any stack trace contains that file, and several cutoffs for minimum number of appearances at 10, 30, 77, and 140. As the number of times code appears on a stack trace increases, the likelihood that that code contains vulnerabilities increases. A graph representation of the correlation is presented in Figure 6.
These results suggest that code that appears frequently in stack traces is not only more likely to have defects, but is also more likely to have vulnerabilities as well. When we consider how crashes occur, it may make sense. If the program is crashing, that means that unexpected events or input has taken place within a system and is not being handled properly. From the result, we conclude that the automated attack surface approximation
changeset: 43376:ebc6875a1ec4
user: L. David Baron <[email protected]>
date: Tue Jun 08 22:28:14 2010 -0700
summary: Use macros for frame state so that it's easy to change
the size and easier to read the constants. (Bug 570837) r=roc
changeset: 41687:b830eb32915d
user: Zack Weinberg <[email protected]>
date: Sat May 01 14:40:16 2010 -0700
summary: Bug 562093: Add reflow tracing for InitConstraints,
InitOffsets, InitFrameType. r=dbaron
changeset: 41671:985cdfad1c7e
user: Markus Stange <[email protected]>
date: Sat May 01 12:40:22 2010 +0200
summary: Bug 550889 - Don't pass negative values to
SetComputedWidth/Height in nsFrame::BoxReflow. r=bzbarsky
Figure 4. An example of data output by the “hg log <x>” command on a file in the Mozilla Firefox codebase
Name
CrashAmount Churn Unique Security
js/src/jsgc.cpp 79705 708 49 1
layout/generic/nsFrame.cpp 73405 291 55 1
js/src/jsobj.cpp 71040 1041 62 1
js/src/xpconnect/src/xpcnative.cpp 51309 161 28 1
xpcom/io/nsLocalFileWin.cpp 41783 59 22 1
layout/generic/nsObjectFrame.cpp 39853 276 58 1
modules/plugin/base/src/ns.cpp 37226 31 14 1
js/src/jstracer.cpp 36076 855 56 1
js/src/jsapi.cpp 35671 1019 82 1
js/src/jsinterp.cpp 28912 993 55 1
approach may be useful in limiting the scope of code that developers need to review while missing a minimal number of potentially flawed areas.
We have also improved the granularity of attack surface approximation compared to the previous study [1], in addition to the quantitative improvements in coverage and specificity. By performing attack surface approximation at the file level, we provide more actionable results for practitioners. While a single binary file could contain thousands of individual files for developers to review, files are typically a more manageable workload for a developer, depending on the development practices of the organization using attack surface approximation.
Attack surface approximation on Mozilla’s Firefox
product identified 8.4% of the files in the
codebase, which contained 72.1% of the
vulnerabilities
seen.
These
results
show
improvement over the Windows 8 study, which
identified 48.4% of the binaries that contained
94.8% of the vulnerabilities.
5.2
Decision Trees (RQ2)
RQ2: How could a decision tree constructed from the attack surface approximation be used to prioritize security efforts?
Individual decision trees could provide practical direction to testers. A decision tree modeling the properties of security vulnerabilities in a software system could be useful for prioritizing security assessment efforts. The splits in a decision tree would represent properties that indicate where security vulnerabilities appear more frequently. By focusing on branches where vulnerability density is higher, security professionals can use their time more efficiently.
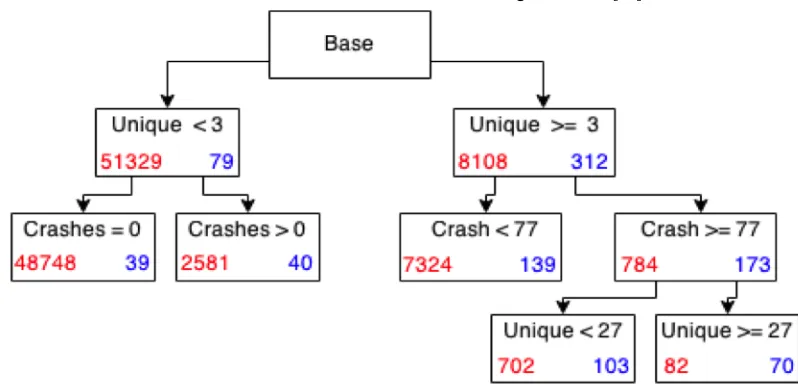
Figure 7 represents a decision tree generated by SAS’s JMP Pro 11, with splits created on the “best” split possible. In the figure, the number on the left is the number of files not containing vulnerabilities, while the number on the right is the number of files with at least one vulnerability.
In the decision tree, we can make several observations. The first split is not done on our stack trace metric, but rather on unique developers who modified the file over our time period. We hypothesize that the first unique split is created because of the number of files that were not modified or did not have historical data in source control. By splitting off at less than three unique
authors, he decision tree is creating an “active file” partition that had several unique authors making modifications over the time period.
The second split in each branch is our stack trace frequency metric. Here we see two splits, one at 1, and one at 77. The split at 1 stack trace appearance is consistent with previous studies. The split on code seen in at least 77 unique stack traces (along with additional minor splits not shown in the figure for space considerations) indicates that as stack trace appearances increase, so does the likelihood of a vulnerability being present, as shown in Table 1.
The third split is on unique developers who modified a file. The 27 Unique split supports an earlier experiment by Meneely and Williams [36] that many developers changing the same code can have a negative effect on code quality from a security perspective. Supporting existing research is a good indication of the quality of ASA.
The churn metric is also noticeably absent from our splits. While previous studies have cited code churn as a key metric for defect and vulnerability prediction, it does not appear to make a
Table 1. Results of our attack surface approximation analysis
Stack Traces files
flaws
%files
%flaws Precision Recall
>= 1
4998
282
8.4%
72.1%
0.056
0.721
>= 10
2691
239
4.5%
61.1%
0.089
0.611
>= 30
1853
210
3.1%
53.7%
0.113
0.537
>= 77
1244
187
2.1%
47.8%
0.150
0.478
>= 140
969
162
1.6%
41.4%
0.167
0.414
All
59437
391
-
-
-
-
Figure 6. Graph of precision (Y-Axis) vs. minimum number of stack trace occurrences to be included in the attack surface approximation (X-Axis)
0
0.02
0.04
0.06
0.08
0.1
0.12
0.14
0.16
0
50
100
150
P
re
ci
si
on
difference when generating a single best tree when stack traces are involved. Stack trace count may be a better metric when considering vulnerabilities.
As we move to the right on our decision tree, we see an increasing density of vulnerabilities in the remaining splits. For practitioners, moving from right to left on the tree gives them a place to start when performing inspections. Practitioners can start at the far right child of the tree, and then iteratively move left step-by-step, stopping to inspect files at each terminating leaf. In summary, we have provided an automated prioritization scheme for security inspections for teams working on software in the field. In our example, files that would be looked at first are those that were involved in more than 77 crashes and changed by 27 or more
unique authors. The next set of code to be evaluated would be those that were involved in more than 77 crashes and changed by more than 3 but less than 27 unique authors, et cetera.
Decision trees could help software developers
prioritize their security efforts.
5.3
VPM PERFORMANCE O (RQ3)
RQ3: Do over-sampling and under-sampling techniques improve Vulnerability Prediction Model performance when restricted to the attack surface approximation?
To verify the performance of Random Forest with and without sampling, a 10-way cross validation study was conducted. Table 2 shows the results of using oversampling and undersampling to handle class imbalance in the vulnerability space.
We observe a significant improvement in recall rates after preprocessing the data with SMOTE. Specifically, recall improved by an order of magnitude from 0.08 to 0.80 after SMOTEing. However, the precision scores decreased from 0.24 to 0.04. Recall measures the probability that the classifier predicts a vulnerability, given that there is indeed a vulnerability present. Precision depends on the prevalence of vulnerabilities in the dataset. Due the lack of sufficient vulnerabilities in the test samples, precision is usually quite low. Therefore, with regards to our application, recall is a more meaningful measure and the efficacy of the classifier can be evaluated using the recall rate.
Recall is the better metric to use when working in the vulnerability prediction space. Menzies et al. showed that in software engineering datasets with large negative/positive ratios, like the vulnerability space, “it is often required to lower precision to achieve higher recall” [39]. Because of the value of finding
Figure 7. The decision tree generated by our best splits for vulnerabilities. The left number is the number of files without security vulnerabilities, the right number is the files with security vulnerabilities.
Table 2. Results of the application of the SMOTE technique to our dataset
Before Sampling
After Sampling
Measure
Median IQR
Measure
Median IQR
Precision
0.26
0.25 Precision
0.04
0.02
Sensitivity (Recall)
0.08
0.07 Sensitivity (Recall)
0.8
0.07
Accuracy
0.99
0 Accuracy
0.87
0.01
Specificity
1
0 Specificity
0.87
0.01
F
0.12
0.1 F
0.08
0.03
vulnerabilities, with a single flaw possibly costing organizations significant amounts of money, coverage of vulnerabilities is far more important than accuracy. While limiting the set of code to be inspected is good, our goal should be to limit the amount of vulnerabilities that are missed when restricting the set of code to be looked at, otherwise our model will not be practical for practitioners.
Our VPM performs well when optimizing for
vulnerability coverage, with a recall of 0.80
and precision of 0.04.
6.
LIMITATIONS
One of the limitations of our previous work was that the ASA approach was only tested on Microsoft Windows and that the approach may not have been generalizable. We have demonstrated the value of ASA on Mozilla Firefox, but smaller software systems with fewer stack traces may not work as well with the approach. Both ASA studies have been done on industry leading codebases. Future studies could determine how ASA performs on smaller codebases.
In the absence of an oracle for the complete attack surface, we cannot assess the completeness of our approximation. Our determination of accuracy currently is based only on known vulnerabilities, which may introduce a bias towards code previously seen to be vulnerable. While basing our effectiveness on historical vulnerabilities may be a good assumption, further exploration is needed. ASA outputs, as expected, an approximation, and it cannot identify latent vulnerabilities directly.
While previous studies with VPMs [11][12] have analyzed software at multiple levels, this work focuses on the file level based on practitioner feedback and the availability of data. We cannot claim that attach surface approximation’s effectiveness will remain the same as the level of granularity changes.
7.
SUMMARY
In this study, we have shown that ASA with stack traces works for Firefox. We add the results of this study to our prior results that the approach is effective for commercial operating systems. As a result, we have shown that this approach is generalizable. We can address concerns about ASA overfitting for certain types of software systems by adding additional studies on different types
of systems.
By moving granularity to file level in this study, we have made the approximation more actionable for developers. Files are more efficient for locating potentially vulnerable when compared with binaries. We have improved on the state of the art in VPM’s with recall increasing tenfold after using oversampling and undersampling techniques. Additionally, we explored decision trees as a visualization technique of the important metrics in vulnerability prediction.
8.
FUTURE WORK
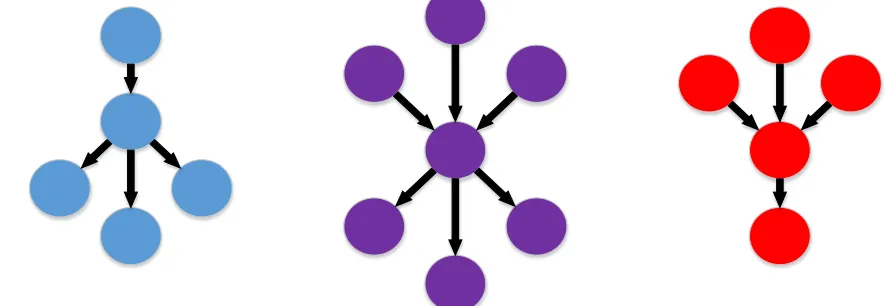
In the previous study [1], we had explored graph representations of stack traces using the order of appearance of code in the trace. For future work, we would like to construct similar graph representations of the trace. A standalone tool or plugin integrated with a modern IDE such as Eclipse is one method for making this representation useful to practitioners.
Mock examples of the types of graph representations we could create are in Figure 8. In these examples the single central node is the file the developer is currently viewing, while the surrounding nodes are the files (with names) that are seen on stack traces immediately before or following the currently viewed file. By showing these known failing data paths to the developer, they can focus their triaging efforts on these paths, excluding any paths that crashes were not seen on. By following the visualization, the developer focuses their effort on code that has a higher probability of containing security defects.
In addition to the simple visualization of the graph representation of the stack traces, graph shape analysis is another methodology we plan to explore to further narrow our scope of code that could contain security vulnerabilities. In particular, do certain shapes of incoming and outgoing nodes result in more frequent sightings of vulnerabilities? We hypothesize that certain shapes, such as many files calling into one file but that file only calling out to few files, may exhibit more vulnerabilities than other areas.
ASA currently looks at the code entities themselves as possible locations for security vulnerabilities. The code entities themselves may not the interesting metric from a security perspective. The relationships between code entities may do a better job of pointing out potential vulnerabilities. Many common vulnerability types are the result of bad data handling, including SQL injection attacks and buffer overflow attacks. Future work may be prudent to examine the relationships between files (or other code entities
at various levels of granularity) and determine which relationships appear in crashes most frequently. These bad handoffs may point us towards where vulnerable code lives.
Currently, our approach for the VPM is to use a simple weighting scheme on counts of vulnerabilities, along with a few easily collected metrics for the codebase. By finding additional metrics within the stack traces, such as variable contents, register contents, etc. we may find additional ways to narrow our set of attack surface entities.
9.
ACKNOWLEDGEMENTS
Any opinions expressed in this report are those of the author(s) and do not necessarily reflect the views of North Carolina State University. We also thank the Realsearch research group for
providing helpful feedback on this work. We also thank Rahul
Pandita and Patrick Morrison for sharing research into security defect locations in the Mozilla Firefox product.
10.
REFERENCES
[1] C. Theisen, K. Herzig, P. Morrison, B. Murphy, and L. Williams, “Approximating Attack Surfaces with Stack Traces”, in Companion Proceedings of 37th
ICSE, 2015.
[2] R. Moser, W. Pedrycz and G. Succi, "A comparative analysis of the efficiency of change metrics and static code attributes for defect prediction," in Proceedings of the 30th ICSE, 2008.
[3] N. Nagappan and T. Ball, "Use of relative code churn measures to predict system defect density," in. Proceedings of the 27th ICSE, 2005.
[4] T. Zimmermann and N. Nagappan, "Predicting defects using network analysis on dependency graphs," in Proceedings of the 30th ICSE, 2008. [5] M. Pinzger, N. Nagappan and B. Murphy, "Can
developer-module networks predict failures?," in Proceedings of the 16th ACM SIGSOFT FSE, 2008. [6] N. Nagappan, B. Murphy and V. Basili, "The
Influence of Organizational Structure on Software Quality: An Empirical Case Study," in Proceedings of the 30th ICSE, 2008.
[7] A. E. Hassan, "Predicting faults using the complexity of code changes," in Proceedings of the 31st ICSE, 2009. [8] K. Herzig, S. Just, A. Rau and A. Zeller, "Predicting
Defects Using Change Genealogies," in Proceedings of the 24th IEEE ISSRE, 2013.
[9] K. Herzig, "Using Pre-Release Test Failures to Build Early Post-Release Defect Prediction Models," in Proceedings of the 25th IEEE ISSRE, Neaples, 2014. [10]T. Hall, S. Beecham, D. Bowes, D. Gray and S.
Counsell, "A Systematic Literature Review on Fault Prediction Performance in Software Engineering,", IEEE Transactions on Software Engineering, vol. 38, pp. 1276--1304, 2012.
[11]T. Zimmermann, N. Nagappan and L. Williams, "Searching for a Needle in a Haystack: Predicting Security Vulnerabilities for Windows Vista," in Proceedings of the 3rdICST, 2010.
[12]Y. Shin and L. Williams, "Can traditional fault prediction models be used for vulnerability prediction?," Empirical Software Engineering, vol. 18, pp. 25--59, 2013.
[13]M. Gegick, L. Williams, J. Osborne and M. Vouk, "Prioritizing software security fortification throughcode-level metrics," in Proceedings of the 4th ACM workshop on Quality of protection, 2008.
[14]Y. Shin, A. Meneely, L. Williams and J. Osborne, "Evaluating Complexity, Code Churn, and Developer Activity Metrics as Indicators of Software Vulnerabilities," Software Engineering, IEEE Transactions on, vol. 37, pp. 772--787, 2011.
[15]I. Chowdhury and M. Zulkernine, "Using complexity, coupling, and cohesion metrics as early indicators of vulnerabilities," Journal of Systems Architecture, vol. 57, pp. 294--313, 2011.
[16]S. Neuhaus, T. Zimmermann, C. Holler and A. Zeller, "Predicting vulnerable software components," in Proceedings of the 14th ACM conference on Computer and communications security, 2007.
[17]M. Howard, J. Pincus and J. M. Wing, "Measuring Relative Attack Surfaces," in Computer Security in the 21st Century, Springer US, 2005, pp. 109-137.
[18]B. Liblit and A. Aiken, "Building a Better Backtrace: Techniques for Postmortem Program Analysis," University of California, Berkeley, Berkeley, 2002. [19]R. Manevich, M. Sridharan, S. Adams, M. Das and Z.
Yang, "PSE: Explaining Program Failures via Postmortem Static Analysis," in Proceedings of the 12th ACM SIGSOFT Twelfth International Symposium on Foundations of Software Engineering, Newport Beach, CA, USA, 2004.
[20]W. Jin and A. Orso, "F3: Fault Localization for Field Failures," in Proceedings of the 2013 International Symposium on Software Testing and Analysis, 2013. [21]R. Wu, H. Zhang, S.-C. Cheung and S. Kim,
"CrashLocator: Locating Crashing Faults Based on Crash Stacks," in Proceedings of the 2014 International Symposium on Software Testing and Analysis, 2014. [22]S. Wang, F. Khomh and Y. Zou, "Improving bug
localization using correlations in crash reports," in Mining Software Repositories (MSR), 2013 10th IEEE Working Conference on, 2013.
[23]A. Podgurski, D. Leon, P. Francis, W. Masri, M. Minch, J. Sun and B. Wang, "Automated support for classifying software failure reports," in Software Engineering, 2003. Proceedings. 25th International Conference on, 2003.
[24]Y. Dang, R. Wu, H. Zhang, D. Zhang and P. Nobel, "ReBucket: A Method for Clustering Duplicate Crash Reports Based on Call Stack Similarity," in Proceedings of the 34th International Conference on Software Engineering, 2012.
improve crash triage," in Dependable Systems Networks (DSN), 2011 IEEE/IFIP 41st International Conference on, 2011.
[26]P. J. Guo, T. Zimmermann, N. Nagappan and B. Murphy, "Characterizing and Predicting Which Bugs Get Fixed: An Empirical Study of Microsoft Windows," in Proceedings of the 32th International Conference on Software Engineering, 2010.
[27]N. Bettenburg, S. Just, A. Schröter, C. Weiss, R. Premraj and T. Zimmermann, "What makes a good bug report?," in SIGSOFT '08/FSE-16: Proceedings of the 16th ACM SIGSOFT International Symposium on Foundations of software engineering, 2008.
[28]S.-K. Huang, M.-H. Huang, P.-Y. Huang, H.-L. Lu and C.-W. Lai, "Software Crash Analysis for Automatic Exploit Generation on Binary Programs," Reliability, IEEE Transactions on, vol. 63, pp. 270-289, March 2014.
[29]C. Holler, K. Herzig and A. Zeller, "Fuzzing with Code Fragments," in Proceedings of the 21st USENIX Conference on Security Symposium acmid = 2362831, 2012.
[30]D. Kim, X. Wang, S. Kim, A. Zeller, S. Cheung and S. Park, "Which Crashes Should I Fix First?: Predicting Top Crashes at an Early Stage to Prioritize Debugging Efforts," Software Engineering, IEEE Transactions on, vol. 37, no. 3, pp. 430-447, 2011.
[31]Building Security In Maturity Model (BSIMM)
[32]Manadhata, P., Wing, J., Flynn, M., & McQueen, M. (2006, October). Measuring the attack surfaces of two
FTP daemons. In Proceedings of the 2nd ACM
workshop on Quality of protection (pp. 3-10). ACM.
[33]Younis, A.A., Malaiya, Y.K., Ray, I., “Using Attack Surface Entry Points and Reachability Analysis to Assess the Risk of Software Vulnerability Exploitability” In Proc. of IEEE 15th International Symposium on High-Assurance Systems Engineering, p. 1-8, 2014
[34]Shin, Y. and Williams, L., Can Fault Prediction Models and Metrics be Used for Vulnerability Prediction?, Empirical Software Engineering, Vol. 18, No. 1, pp. 25-59, 2013.
[35]N. Chawla, V. Nitesh, et al. "SMOTE: synthetic
minority over-sampling technique."Journal of artificial
intelligence research 16.1 (2002): 321-357.
[36]A. Meneely, and L. Williams. "Secure open source
collaboration: an empirical study of linus'
law." Proceedings of the 16th ACM conference on
Computer and communications security. ACM, 2009
[37]S. Lessmann, B. Baesens, C. Mues and S. Pietsch, “Benchmarking classification models for software defect prediction: A proposed framework and novel findings.” in IEEE Transactions on Software Engineering, 34(4), 485-496, 2008.
[38]L. Pelayo and S. Dick, “Applying novel resampling strategies to software defect prediction.” Annual Conference of the North American Fuzzy Information Processing Society - NAFIPS, 69-12, 2007.
[39]T. Menzies, A. Dekhtyar, J. Distefano, and J. Greenwald, “Problems with Precision: A Response to "Comments on 'Data Mining Static Code Attributes to Learn Defect Predictors.'"” IEEE Trans. Softw. Eng. 33, 9 (September 2007), 637-640. 2007
[40]Scikit-learn: Machine Learning in Python, Pedregosa et al., JMLR 12, pp. 2825-2830, 2011.