Rapid assessment of wood density of live trees
using the Resistograph for selection in tree
improvement programs
Fikret Isik and Bailian Li
Abstract:Wood density is traditionally determined by a volumetric method that is accurate but expensive for large-scale sampling. A new device called the Resistograph was investigated for rapid assessment of relative wood density of live trees in progeny trials. Fourteen full-sib families of loblolly pine (Pinus taedaL.) produced by a six-parent half-diallel mating design were tested at four sites. For each family, wood density was measured with the traditional volu-metric method and then compared with the Resistograph readings (amplitude). Amplitude had weak (0.29) to moderate (0.65) phenotypic correlations with wood density on an individual-tree basis over the four sites. The family mean cor-relation between the two measurements, however, was much stronger (0.92). The additive genetic corcor-relation between the two measures was also high (0.95). Individual-tree breeding values of amplitude yielded more accurate rankings than phenotypic values. The rankings of the parental, general-combining abilities were identical for the two measures. Both wood density and amplitude were under strong genetic control at the family level (full-sib family heritability (h2fs) = 0.95 for wood density and h
fs
2 = 0.85 for amplitude). The efficiency of using the Resistograph as a means of
in-direct selection for improvement of wood density was 87% at the family level. Results from this study suggest that the Resistograph could be used reliably and efficiently to assess relative wood density of live trees for selection in tree im-provement programs. The method is rapid, nondestructive, and much cheaper than the traditional volumetric method.
Résumé :La densité du bois a traditionnellement été déterminée par une méthode volumétrique qui est précise mais coûteuse pour un échantillonnage à grande échelle. Un nouvel appareil appelé Resistogrpah a été évalué pour estimer rapidement la densité relative du bois chez les arbres vivants dans des tests de descendance. Quatorze familles biparen-tales de pin à encens (Pinus taedaL.) issues d’un plan de croisement demi-diallèle de six parents ont été testées dans quatre sites. Pour chaque famille, la densité du bois a été mesurée avec la méthode volumétrique traditionnelle et com-parée aux lectures du Resistogrpah (amplitude). La corrélation phénotypique entre l’amplitude et la densité du bois était faible (0,29) à modérée (0,65) chez les individus dans l’ensemble des quatre sites. Cependant, la corrélation entre les deux mesures était beaucoup plus forte (0,92) avec les valeurs moyennes par famille. La corrélation génétique addi-tive entre les deux mesures était également élevée (0,95). Les valeurs en croisement individuelles basées sur l’ampli-tude ont fourni un classement plus juste que les valeurs phénotypiques. Le classement des aptil’ampli-tudes générales à la combinaison des parents était identique avec les deux mesures. La densité du bois élevé sous contrôle génétique et l’amplitude étaient au niveau de la famille (l’héritabilité biparentale (h2fs) = 0,95 pour la densité du bois eth
fs 2 = 0,85
pour l’amplitude. Au niveau de la famille, l’efficacité du Resistogrpah comme outils indirect de sélection pour amélio-rer la densité du bois était de 87 %. Les résultats de cette étude indiquent que le Resistograph est un outils fiable et efficace pour évaluer la densité du bois chez les arbres vivants en vue d’une sélection dans les programmes
d’amélioration. Cette méthode est rapide, non destructive et beaucoup moins coûteuse que la méthode volumétrique tra-ditionnelle.
[Traduit par la Rédaction] Isik and Li 2435
Introduction
Density is one of the most important determinants of wood quality from pine plantations. It affects various prod-ucts of wood, such as pulp and paper properties (Blair et al. 1976), wood strength, and structural wood quality (Megraw 1985; Zobel and van Buijtenen 1989). Wood density has been a desirable trait to include in tree improvement
pro-grams because of its economic value and high degree of ge-netic control (Sprague et al. 1983). As the forest industry is increasingly dependent on the use of wood from fast grow-ing plantations in the world, an increasgrow-ing proportion of wood that is harvested is juvenile wood. Juvenile wood is primarily composed of earlywood with low specific gravity, less strength, high lignin content, thinner cell walls, and short tracheids (Blair et al. 1976; Zobel and van Buijtenen
Received 14 August 2002. Accepted 29 July 2003. Published on the NRC Research Press Web site at http://cjfr.nrc.ca on 9 December 2003.
1989). Thus, improving the quality of wood produced from these fast growing, young plantations has become especially important for tree improvement programs.
Wood density is traditionally determined by a volumetric method, which requires extracting increment cores from trees and measuring the volume and mass of dry wood in the laboratory (ASTM 1985). Although this method is generally accurate, it is both time consuming and expensive for a tree improvement program because potentially thousands of trees must be screened for wood density in genetic field tests. A rapid, reliable, and economical wood density assessment has become an increasingly important goal for tree improvement programs and forest industries.
Several new methods and instruments, including the Pilo-dyn wood tester, torsiometer, extraction of nails driven into trees, and electronic microdensitometry, have been proposed to replace the standard method (Cown 1978; Taylor 1981; Gough and Barnes 1984; Nicholss 1985; Moura et al. 1987). Among these methods, the Pilodyn is commonly used to es-timate relative density of live trees (Sprague et al. 1983; Yanchuk and Kiss 1993; Koch and Fins 2000; Costa-e-Silva et al. 2000). High correlations between Pilodyn readings and wood density were reported for loblolly pine (Pinus taeda L.) (Taylor 1981; Sprague et al. 1983), radiata pine (Pinus radiata D. Don), and Norway spruce (Picea abies
(L.) Karst.) (Cown 1979).
Despite the common use of the Pilodyn for measuring wood density, it has drawbacks. The Pilodyn was not recom-mended for through-the-bark measurements because of vari-ation in bark thickness among trees (Koch and Fins 2000). Multiple readings of the Pilodyn around the stem of standing trees were suggested to reduce the variation between and within trees (Greaves et al. 1996). Moreover, the instrument was unreliable for screening density at the individual-tree level (Moura et al. 1987). Inconsistent and low individual-tree correlations were reported for slash pine (Pinus elliottii
var.elliotiiEngelm.) (Gough and Barnes 1984). Because the tool penetrates only into the first few rings of the tree (from 7 to 20 mm), it does not measure the juvenile wood near the center of the tree (Cown 1978; Moura et al. 1987). This can be misleading for measuring the wood density of young pine trees because a large proportion of the wood of young pine trees (6–10 years old) is juvenile wood. Sprague et al. (1983) reported indirect selection efficiencies of 9.5%– 83.3% using the Pilodyn compared with direct selection of volumetric wood density for mature loblolly pine trees. They obtained different efficiencies for different Pilodyn needle types and suggested that additional testing of the Pilodyn would be needed before it could be reliably used to measure relative wood density of young trees.
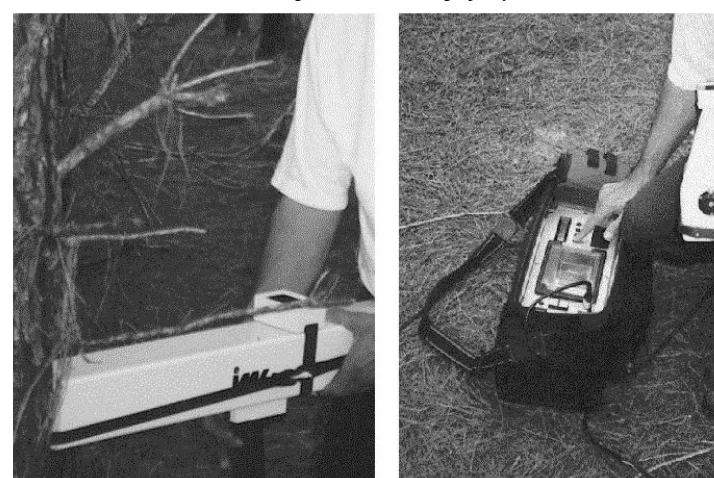
A new device called the Resistograph may be valuable for studying the wood characteristics among and within tree rings (Rinn et al. 1996). The Resistograph has been designed to meet the special requirements of practical examination of standing trees, structural timbers, and poles (Winistorfer et al. 1995). The Resistograph is composed of an electronic unit and a drilling unit (Fig. 1). The electronic unit contains a rechargeable battery, a control panel, and a thermal printer. The method is based on measuring the drilling resistance along a small needle path when a needle is driven into a tree with a constant force. The power consumption of the drilling device is measured electronically as well as the amplitude of drilling resistance (Fig. 2). The amplitude readings are re-corded in relation to the penetration depth of the needle (from bark to bark). This reveals the variation in the density of earlywood, latewood, and tree rings.
Several studies showed that there is a significant correla-tion between the mean level of the Resistograph resistance and gross density of dry timber (Rinn et al. 1996). Winistorfer et al. (1995) measured the vertical density pro-files of medium density fiberboard, particleboard, and ori-ented strandboard by a drill-resistance technique and
compared the vertical density profiles of the same specimen measured with a scanning gamma ray method. The drilling resistance technique provided a good measure of vertical density profiles of the panel materials. Chantre and Rozenberg (1997) compared 42 radial, x-ray densitometry and Resistograph profiles from a 25-year-old Douglas-fir (Pseudotsuga menziesii(Mirb.) Franco var.menziesii) stand. They reported a moderate but significant correlation (0.62) for the profile mean density. They concluded that the Resistograph can be an effective tool for measuring the den-sity of a whole trunk but not for measuring the denden-sity varia-tion within the trunk (among or within rings). Mattheck et al. (1997) reported similar drilling profiles for dry wood and green wood sampled from six different species. Moreover, the drilling resistance was the same magnitude for dry and green wood. To our knowledge, there is no study that
evalu-ates the Resistograph for measuring wood density of standing trees in large progeny tests for selection.
We evaluated the usefulness of the Resistograph for mea-suring the relative wood density of live trees and for estimat-ing family and individual-tree breedestimat-ing values. The main objective of this study was to develop a rapid, nondestruc-tive, and efficient method to screen large numbers of prog-eny in genetic field tests by examining relationships between the Resistograph readings and volumetric wood density of the same trees. If the Resistograph is reliable for ranking families and individual trees for their wood density breeding values, then it may be an effective tool for screening large numbers of progeny in tree improvement programs.
Materials and methods
Fourteen full-sib families of loblolly pine produced by a six-parent disconnected half-diallel mating design were sam-pled from four test sites in South Carolina, U.S.A. Families were selected from the piedmont breeding population of the North Carolina State University–Industry Cooperative Tree Improvement Program. A randomized complete block design with six replications was used at each site. Each full-sib family was laid out in six-tree row plots in each replication. When the trees were 11 years old, 12-mm increment cores were taken from each tree at breast height (about 1.30 m above ground level) using an electrical drill. In total, 1477 trees were sampled across the four test sites. The number of increment cores per family ranged from 75 to 123 across the sites, depending on the survival rates. All samples were at least 3 cm long so that they would be large enough to obtain an accurate mass for measuring volumetric wood density (Harding 1995). Increment cores with visible limbs, curves, resin pockets, brakes, and rust infection were avoided and new samples were taken. The samples were then put into sealed plastic bags and kept in coolers to keep them fresh during the material collection phase. The bark-to-bark core of each tree was divided in half at the pith, and the specific gravity of each half-core was determined by the volumetric method (ASTM 1985). The specific gravity was then con-verted to wood density (kg/m3). A subsample of cores (158)
were scanned using an x-ray densitometer to measure the re-lationship between volumetric and x-ray densitometry read-ings.
The same trees were drilled using the Resistograph B-400 Pro manufactured by IML (Instrumenta Mechanik Labor GmbH, Wiesloch, Germany; http://www.iml.de) (Fig. 1). The drilling speed was set to 30 cm/min (level 5) during all measurements. Trees were drilled about 3 cm above the hole of the increment core to reduce variation between the two measurements. One bark-to-bark measurement was taken from each tree. The data produced by the Resistograph were stored in the electronic unit. The graphic file of each tree was converted to a text file using the B-Tools Pro software that was provided with the Resistograph (Fig. 2a). Each drilling file included information about the identity of the sample, drilling depth measured to the nearest 0.04 mm, and the amplitude (%). Resistograph profiles were processed by using centered moving averages (CMOVAVE) and centered moving minimum averages (CMOVMIN) functions to obtain
smoothed profiles Sm_Amp and Min_Amp, respectively (Fig. 2b). The procedures were repeated 30 times by apply-ing the EXPAND procedure of the SAS software and usapply-ing a SAS macro code (SAS Institute Inc. 1996). The mean am-plitude (%), weighted mean amam-plitude, adjusted amam-plitude (Adj_Amp), bark thickness (mm), radius (mm), and diame-ter inside bark (DIB) (mm) were derived for each tree. Weighted mean amplitude was calculated as the ratio of the amplitude average to the drilling depth. Adjusted amplitude was calculated by adding the mean of centered moving mini-mum averages to the difference between two smoothed pro-files (Sm_Amp and Min_Amp) (Fig. 2b).
Statistical analysis
Linear regression models were evaluated to examine rela-tionships between wood density and the Resistograph-generated variables. In choosing the subset of the models, maximum coefficient of determination (R2) was used as a
se-lection criterion. Product-moment (phenotypic) correlations were estimated between wood density and amplitude on both individual-tree and family mean bases. Genetic analyses of wood density, amplitude, and DIB were carried out using an individual-tree mixed model as outlined in a matrix form.
[1] Y =X+Z␥ ⑀+
where Y is the vector of individual observations;  is the vector of fixed-effects parameters (overall mean, site, and replication within site);␥is the vector of random-effects pa-rameters, including general combining ability (GCA) for fe-male and fe-male, specific combining ability (SCA), GCA × site interaction, SCA × site interaction, plot, and within-plot error. ⑀is an unknown random error vector. Random effects were assumed to be independent.XandZare known design matrices for fixed and random effects, respectively. ⑀and␥ are assumed to have normal distributions with zero mean (E) and variances (Var) (eq. 2) (Littell et al. 1996).
[2] E ␥
⑀ ␥ ⑀ = = 0
0 , Var
0 0 G
R
The variance of the Y vector is V = V(Y) = ZGZ′ + R (Littell et al. 1996). It is also assumed thatGis the diagonal variance–covariance matrix of random effects and R is the variance–covariance matrix of random errors (R=σ2I
n). The
diallel genetic analyses were carried out using a SAS PROC MIXED approach (Xiang and Li 2001). Individual-tree (hi2),
half-sib family mean (hhs2), full-sib family mean (hfs2), and
within-full-sib family (hwf2 ) heritabilities were estimated for
density, amplitude, and DIB using observed variance compo-nents as described in eqs. 3–6:
[3] hi G
G S GT ST Plot E
2 2
2 2 2 2 2 2
4 2 2 = + + + + + σ σ σ σ σ σ σ [4] h p p
t t tb tbn
hs G
G S GT ST Plot E = + + + + + σ σ σ σ σ σ σ 2
2 2 2 2 2 2 1
1
p−
[5] h
t t tb tbn
fs G
G S GT ST Plot E =
+ + + +
2
2 2
2
2 2 2 2 2 2
σ σ σ σ σ σ σ [6] h t t b b bn bn wf G
GT ST Plot E
2 2
2 2 2 2
2 1
2 1 1
= − + + − + − σ σ σ ( )σ ( )σ
whereσG2 is the GCA variance;σ
S2 is the SCA variance;σGT2
andσST2 are the GCA × site and SCA × site interactions,
re-spectively;σPlot2 is the plot variance;σ E
2 is the within-plot
variance;tis number of sites (t= 4);bis the number of rep-lications within sites (b= 6);pis the number of parents (p= 6); andn is the harmonic mean number of trees within plot (n = 4.23). Standard errors of heritabilities were estimated by the Delta Method (Lynch and Walsh 1998). Best linear unbiased prediction (BLUP) of parental breeding values (2 × GCA) and genetic values of full-sib families for wood den-sity and amplitude were estimated as described in eq. 7.
[7] GV = GCA + GCAfs f m + SCA
where GVfs is the genetic value of a full-sib family; GCAf and GCAm are the general combining abilities of females
and males, respectively; and SCA is the specific combining ability of the cross between the two parents. To examine whether the Resistograph amplitude can be used for wood density selection, we calculated BLUP individual-tree breed-ing values (BVi) by adding parental GCA estimates to the estimated within-family value (Aw) (Xiang and Li 2001).
[8] BVi =GCA + GCAf m+ Aw
where
Aw G
E
=2 2 − −
2 σ
σ (Y X Z␥$)
Adjusted breeding values were used for both amplitude and density by adding the grand mean of each trait to the es-timates for meaningful comparisons. Individual-tree breed-ing values from all four sites were ranked and grouped into three equal wood density groups as high, middle, and low. The same ranking and grouping were also followed for am-plitude BVi. Then, percentages of the BVis placed in each group by amplitude were calculated using the SAS RANK and FREQ procedures (SAS Institute Inc. 1996). Correct classification occurred when the high-ranking trees for am-plitude were also placed in the high group for wood density. Serious misclassification was defined as when the trees from the high amplitude group were placed in the low wood den-sity group. Efficiency of the Resistograph for family and within-family selection was estimated by the ratio of direct and indirect selection, assuming the same selection intensi-ties (id = ia) for two traits (Falconer and Mackay 1996).
[9] CRd
d a G d R h r h =
where CRd is the correlated response of density resulting
herit-abilities (family or within-full-sib family) for density and amplitude, respectively; andrGis the additive genetic corre-lation between the two traits, estimated according to Fal-coner and Mackay (1996). Environmental correlations (rE) were estimated among density, amplitude, and DIB using genetic (rG) and phenotypic (rP) correlations among the traits (Falconer and Mackay 1996).
[10] rE(d,a) = rP (d,a) −h h rd a G (d,a)冫 (1−hd2) (1−ha2) wherehd2andh
a2are individual-tree heritabilities, andhdand haare square roots of individual-tree heritabilities of density
and amplitude, respectively.
Results
Relationships between wood density and amplitude
Wood density and amplitude had weak to moderate phenotypic linear relationships at the individual-tree level (Table 1). Mean amplitude of each tree was positively re-lated to its wood density in the regression analysis, with R2
values ranging from 0.21 to 0.44 for the four test sites. Phenotypic correlations of individual trees between the two traits at each site ranged from 0.29 to 0.65. The combined correlation over the four sites between the two traits was weak (0.12) (Table 2). Smoothing the Resistograph profiles using the minimum center averages (SAS Institute Inc. 1996) slightly improved the relationships. Other independent variables, including weighted average amplitude and drilling depth, only slightly improved the regression R2 (data not presented).
When the phenotypic correlation was further partitioned into its components (Table 2), a strong, additive genetic cor-relation (rG = 0.95) was detected between amplitude and
wood density. Environmental factors had reverse effects on density and the amplitude, as shown by a high, negative
en-vironmental correlation (–0.63). Density and amplitude had the same negative, moderate genetic correlation with DIB (−0.47), whereas the phenotypic and environmental correla-tions of the two traits with DIB were positive. Amplitude had a higher phenotypic correlation with DIB (0.46) than with density (0.12).
On a family-mean basis, the phenotypic relationship be-tween density and amplitude was considerably higher than individual-tree-based correlations (Fig. 3, Table 2). The full-sib family-mean phenotypic correlation between wood den-sity and amplitude was 0.92 versus the individual-tree phenotypic correlation (0.12). Using the genetic values (GVfs) of the same families for wood density and amplitude,
the R2 between the two traits increased from 0.85 to 0.94
(Fig. 3), and the correlation coefficient was increased from 0.92 to 0.97.
Genetic parameters
Additive genetic effects explained a considerable propor-tion of total variance for both wood density (15.8%) and am-plitude (7.4%) (Table 3). When expressed as a percentage of total variance, GCA variance for density was about two times greater than the GCA for amplitude. SCA genetic ef-fects for all traits were negligible and explained less than 1% of total phenotypic variance. These estimates were
associ-Site rP ModelR2 Regression equation Na Prb
1 0.65 0.44 wd = 267.7568 + 8.154722 × amplitude 387 <0.0001
2 0.29 0.31 wd = 282.5823 + 6.517111 × amplitude 316 <0.0001
3 0.46 0.21 wd = 288.9329 + 9.348172 × amplitude 399 <0.0001
4 0.50 0.24 wd = 308.0527 + 4.476494 × amplitude 375 <0.0001
aNumber of observations.
bRegression model probability level.
Table 1.Individual-tree phenotypic correlations (rP) and linear regression models to predict wood density (wd) using the Resistograph readings (amplitude) at four test sites.
Pair of traits rG±SE rP Pr <rPa r
E
Density–amplitude 0.95±0.040 0.12 <0.0001 –0.63
Amplitude–DIB –0.47±0.448 0.46 <0.0001 0.54
Density–DIB –0.47±0.382 0.03 0.2753 0.18
aPhenotypic correlation probability level. The correlation coefficient is
significantly different from zero if Pr < 0.05. Number of observations used in the estimation of correlations was 1477.
Table 2.Additive genetic (rG) (± standard error), phenotypic (rP), and environmental (rE) correlations among wood density, Resistograph amplitude, and diameter inside bark (DIB) when all sites are combined.
ated with high standard errors. For density, the GCA × site interaction explained 0.8% of the variance, whereas this component was more than three times higher for amplitude (3.1%). Both traits had similar percentages of within-plot variances with small standard errors. However, amplitude had a surprisingly high plot variance compared with density (16.1% vs. 6.9%). Phenotypic variation at the full-sib family level was similar for density and amplitude as shown by their coefficients of phenotypic variation (CVσfs2) (Table 3).
In contrast, the within-family phenotypic variation for am-plitude was considerably greater than that for density (CVσwf2 = 10.6% vs. 5.6%).
The individual-tree heritability for wood density was about two times greater than that for amplitude (Table 3). Full-sib family heritabilities of density and amplitude were 0.95 and 0.81, respectively. The within full-sib family herit-ability of density was more than two times greater than that of amplitude. Diameter inside bark had weak individual and moderately high half-sib and full-sib family heritabilities.
The efficiency of indirect full-sib family selection using the Resistograph values compared with direct selection for density (eq. 9) was high (87%). The efficiency of combined family and within-family selection using the Resistograph to select for density was smaller (74%) because of the smaller within full-sib family heritability.
Ranking and classification of genotypes
The Resistograph reading was reliable for ranking parents, full-sib families, and individual trees. BLUP breeding values of genotypes considerably improved the relationship be-tween density and amplitude compared with phenotypic ob-servations. The ranking of half-sib parents for wood density GCA values was identical to that of amplitude GCA values (Fig. 4). For example, parent P5 had the greatest GCA
val-ues for both wood density and amplitude, and parent P4 had the lowest GCA value for wood density and amplitude. The ranking of full-sib families was generally the same, except for some rank changes among the middle range families.
The strength of the relationship between density and am-plitude at the individual-tree level increased dramatically when BLUP individual-tree breeding values were used (Figs. 5a and 5b). By removing the environmental effects, the variation among individual trees was reduced (Fig. 5b). Trees were grouped into three classes based on their ampli-tude and density values. About 80% of the trees in the high amplitude group were also in the high density group (Ta-ble 4). Only 0.8% of the trees were seriously misclassified
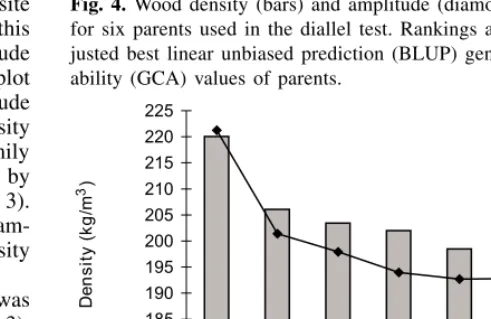
Fig. 4.Wood density (bars) and amplitude (diamonds) rankings for six parents used in the diallel test. Rankings are based on ad-justed best linear unbiased prediction (BLUP) general combining ability (GCA) values of parents.
Density Amplitude DIB
Sourcea Estimate (±SE) % Estimate (±SE) % Estimate (±SE) %
GCA 100.78±66.001 15.8 0.2747±0.2052 7.4 9.096±8.975 1.4
SCA 2.1674±4.5612 0.3 0.0247±0.0411 0.7 0.0±0.0 0
GCA × Site 5.0567±4.6272 0.8 0.1162±0.0644 3.1 8.983±7.408 1.4
SCA × Site 0.0±0.0 0.0 0.0±0.0 0.0 14.363±9.945 2.3
Plot 45.268±14.028 6.9 0.6000±0.1048 16.1 15.822±13.851 2.5 Error 503.38±20.773 76.7 2.7179±0.1120 72.8 589.93±24.301 92.4
hi2 0.61±0.341 0.29±0.198 0.06±0.056
hhs2 0.81±0.018 0.79±0.038 0.58±0.204
hfs2 0.95±0.041 0.81±0.129 0.55±0.263
hwf2 0.37±0.241 0.16±0.122 0.03±0.029
CVσfs2 3.5 4.7 4.1
CVσwf2 5.6 10.6 17.9
aGCA, general combining ability; SCA, specific combining ability;h
i2,hhs2,hfs2, andhwf2 , individual-tree, half-sib family, full-sib family, and within full-sib family heritabilities, respectively; CVσfs2 and CVσwf2 are the full-sib family and within full-sib family coefficients of phenotypic variance, respec-tively, that were calculated as the square root of the full-sib family or within-family phenotypic variance divided by the overall mean.
(trees in the high amplitude group placed in the low density group).
Discussion
Relationships between density and amplitude
The Resistograph amplitude had weak to moderate corre-lations with wood density based on individual-tree pheno-typic values (Tables 1 and 2). Site differences, replication effects, and other microenvironmental factors may have caused poor correlations. Site and replication effects were highly significant (P < 0.0001) for both density and ampli-tude (data not shown). Moisture content has been shown to affect Resistograph readings (Rinn et al. 1996). In this study, wood density was determined from conditioned specimens, i.e., saturated and oven-dried increment cores, whereas the Resistograph readings were obtained from live trees and could have been affected by differing moisture contents.
Low phenotypic correlations between a target trait and a trait measured on an individual-tree basis are common in progeny tests of forest trees, because the phenotypic co-variance between two traits is influenced by both genetic
and environmental factors. Erratic correlations were reported between basic density and Pilodyn readings for Eucalyptus camaldulensis at the individual-tree level (Moura et al. 1987) and forPinus elliottii(Gough and Barnes 1984). En-vironmental factors, genotype × environment interactions, and genetic effects may have different effects on the phenotypic covariance. A high and negative environmental correlation (–0.67) between amplitude and density could partially explain the weak phenotypic correlation (0.12) be-tween these traits. The environmental correlation (rE) can be caused by nonadditive genetic variance, environmental vari-ance, and covariance of the two traits and by genotype × en-vironment interaction (Falconer and Mackay 1996). The environmental effects may influence trees in different ways for different traits. For example, the negative rE between
wood density and Resistograph readings could be caused by differences in moisture content. There is often large varia-tion in moisture content among live trees in field tests dur-ing the time of Resistograph measurements, while wood density measurement was done with dry wood with constant moisture content. We observed a weak but negative phenotypic correlation between Resistograph readings and the moisture content in a subset of the trees (data not shown). This may have contributed to the negative environ-mental correlation between the two traits. The stronger ge-notype × environment interaction variance observed for amplitude than for wood density may have also contributed to this weak phenotypic correlation (Table 3). In a simula-tion study, rank correlasimula-tions of family performance were only moderately high when the actual underlying correlation was perfect (r = 1.0) (Lambeth 1983).
Specific gravity or density is a complex trait determined by several wood characteristics (Zobel and van Buijtenen 1989). This complexity makes it difficult to measure. Often, different estimates of specific gravity have been reported for different measurements of the same samples. We found a phenotypic correlation of 0.85 between wood density mea-sured by the volumetric and x-ray densitometric methods on the same 158 trees from one site. Product–moment correla-tions between two halves of the same cores for density were also not perfect (rp= 0.72 to 0.97 among sites), indicating a measurement error and variation between two halves of the cores.
A high family mean correlation between density and am-plitude indicated that the Resistograph could be used to rank loblolly pine families for wood density. As expected, the en-vironmental variation was reduced by averaging large num-bers of trees for each family. The family mean correlation between two traits is considered a conservative estimate of additive genetic correlation (Yamada 1962; Li et al. 1992) and can be partitioned into genetic and nongenetic compo-nents (Falconer and Mackay 1996; Lynch and Walsh 1998). The amount of divergence from the genetic correlation is the nongenetic portion and depends on heritabilities of traits, number of individuals measured for each, and the ratio of genetic and phenotypic correlation. If two characters have low heritabilities, their phenotypic correlation is primarily determined by environmental factors. In this study, the num-ber of trees per family ranged from 75 to 123 and the full-sib family heritabilities were high (Table 3). The reliability
of amplitude family means was supported by a strong addi-tive genetic correlation between the two traits. A full-sib family mean correlation of 0.92 between amplitude and den-sity is encouraging for ranking families for wood denden-sity us-ing family mean correlations. In a previous loblolly pine genetic testing study, juvenile–mature family mean correla-tions in the range of 0.4–0.6 were strong enough to be used for ranking families for height growth (Li et al. 1992). Neg-ative genetic correlations were observed between DIB and both density and amplitude. However, these genetic correla-tions were associated with high standard errors, which makes it difficult to draw conclusions.
Ranking and classification of genotypes
Amplitude breeding values adjusted for environmental ef-fects yield a more accurate ranking of families for wood density than do phenotypic values. The improvement in rankings was much higher when rankings were based on individual-tree breeding values as compared with phenotypic values (Fig. 5). The correct classification by the Resisto-graph (percent of trees in the higher group of both traits) was 80%, while serious misclassification was negligible (0.8%). Although middle-level misclassification was moder-ate (about 1 in 5), rank change among middle group trees may be less important when ranking genotypes for selection in a tree improvement program (Carter et al. 1990). From the selection perspective, correct and serious misclassifi-cations are the most critical, since selection or culling would be applied on the tails of the distribution. Thus, breeding values of Resistograph amplitude could be used to rank trees for wood density accurately in a tree improvement program of loblolly pine.
Selection efficiency
The relatively high genetic gain from indirect selection using the Resistograph vs. direct selection for wood density suggests that the Resistograph could be an effective tool for wood density selection in loblolly pine. Density and ampli-tude appeared to be under similar degrees of strong genetic control at the family level, and genetic gains from combined family and within family for the two traits were also similar. In practice, screening large number of trees for wood density is expensive. When the costs of the two methods are taken into consideration, use of the Resistograph may yield more gain per unit of cost than direct measurement of density. It takes only 45–60 s to drill an 11-year-old loblolly pine tree.
Using the software provided by the Resistograph system, the conversion of the Resistograph graphic files to text files for analysis may take some time. Wood core collection from a tree with a gas-powered drill may take the same amount of time as drilling with the Resistograph. However, the wood density determination by the volumetric method requires time-consuming laboratory procedures, including cleaning of the cores, saturation, weighing, and drying procedures (ASTM 1985).
The Resistograph could be used in a tree improvement program to screen large numbers of progeny for selection and early assessment of wood density. The Resistograph can be used alone or in conjunction with the volumetric assess-ment method. A conservative strategy might be to cull the lower-ranking genotypes based on amplitude values from the breeding population before progeny testing. By eliminating these genotypes, the efficiency of tree improvement pro-grams would be improved. An alternative approach could be to use the Resistograph to screen the entire breeding popula-tion, then select the top-ranked genotypes for forward selec-tion or deployment.
Comparison of the Resistograph method with other methods
The Resistograph seems to have advantages over other tools used to measure relative wood density of live trees. Compared with the Pilodyn, Resistograph values do not vary from one operator to another. The needle is driven into the tree constantly with a fixed drill speed. The drilling does not require the bark to be removed. The Pilodyn may damage young trees, because multiple measurements are required and this could result in removal of a significant portion of the bark from around the tree (Greaves et al. 1996). The Pilodyn needle penetrates only the first few outer rings and does not measure the inner juvenile wood core (Sprague et al. 1983). In contrast, the Resistograph method measures all the wood from bark to bark and the approach is less destruc-tive. When a tree is drilled, a thin needle leaves a 1.5 mm wide hole in the tree that is barely visible. Another benefit is that Resistograph measurements also yield measurements of diameter inside bark. The Resistograph is portable and is easy to handle in the field and in the lab. Compared with the volumetric method, data collection and analysis is cheaper and more rapid.
Resistograph profiles from young loblolly pine trees can be quite irregular. In general, the ring boundaries are not
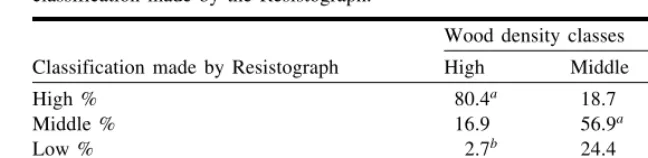
Wood density classes
Classification made by Resistograph High Middle Low
High % 80.4a 18.7 0.8b
Middle % 16.9 56.9a 26.4
Low % 2.7b 24.4 72.8a
Frequency of trees in each density class 479 482 481 aData are correct classification made by Resistograph for each wood density class.
bData are serious misclassifications made by Resistograph for each wood density class. Serious
clear, particularly in the inner part of the tree. Smoothing the Resistograph profiles using the centered moving minimum averages may improve the relationships between Resisto-graph readings and wood density. Superimposition of Resistograph profiles on x-ray densitometry profiles in-volves certain challenges. Profiles from the Resistograph and from the x-ray densitometry can have different resolu-tions (0.04 vs. 0.06 mm). They also do not have the same scale depth. With the further development of drilling and an-alytical techniques, it may be possible to use the Resistograph to study within-tree variation in relative den-sity, juvenile–mature wood transition zones, as well as earlywood and latewood traits.
The general application of the Resistograph for different species and trees of different ages may need to be tested. Larger family sizes may be required to verify the family ranking and correlations from this study. One of the poten-tial drawbacks of the Resistograph is that the moisture con-tent of live trees affects estimates of density. Decay, compression wood, resin pockets, and limbs are other poten-tial factors that affect relationships between wood density and the Resistograph readings. Distortion of the drilling pro-files from the vertical axis, as well as curved and meander-ing contours can also be a source of error (Rinn et al. 1996; Chantre and Rozenberg 1997).
In conclusion, the Resistograph has a great deal of poten-tial to rapidly assess the relative wood density of genotypes from progeny trials and to select for wood density in loblolly pine. Breeding values for amplitude would yield more accu-rate rankings and better selection than by simply using phenotypic values alone. The lower-ranking genotypes can be culled, or the top-ranking genotypes can be selected to make progress in tree breeding and deployment programs. The Resistograph system is easy to use in the field, rela-tively nondestructive, and rapid. The profiles produced by drilling allow estimation of diameter inside bark and, with further refinement, might provide information on within-tree variation in wood density.
Acknowledgements
The study was funded by North Carolina State University–Industry Cooperative Tree Improvement Program and grants from the Department of Energy and USDA – Ini-tiative for Future Agriculture and Food Systems (IFAFS). We thank J.B. Jett, Barry Goldfarb, the associate editor of the Journal, and two anonymous reviewers for suggestions for the improvement of the manuscript. We especially thank Bowater Inc. for providing progeny tests and data for this study.
References
ASTM (American Society for Testing and Materials), D2395-02. 1985. Standard test methods for specific gravity of wood and wood-based materials. Annual book of ASTM standards, vol-ume 4.09, wood. ASTM International, Philadelphia, Pa. Blair, R.B., Zobel, B., Hitchings, R.C., and Jett, J.B. 1976. Pulp
yield and physical properties of young loblolly pine with high-density juvenile wood. Appl. Polym. Symp.28: 435–444.
Carter, K.K., Adams, G.W., Greenwood, M.S., and Nitschke, P. 1990. Early family selection in jack pine. Can. J. For. Res.20: 285–291.
Chantre, G., and Rozenberg, P. 1997. Can drill resistance profiles (Resistograph) lead to within-profile and within-ring density pa-rameters in Douglas-fir wood?In Proceedings of CTIA – Inter-national Union of Forest Research Organizations (IUFRO) International Wood Quality Workshop: Timber Management To-ward Wood Quality and End-Product Value, Québec, Qué., 18– 22 August 1997. Edited by S.Y. Zhang, R. Gosselin, and G. Chauret. Forintek Canada Corp., Sainte-Foy, Que. pp. 41–47. Costa-e-Silva, J., Borralho, N.M.G., and Wellendorf, H. 2000.
Ge-netic parameter estimates for diameter growth, Pilodyn penetra-tion and spiral grain inPicea abies(L.) Karst. Silvae Genet.49: 29–36.
Cown, D.J. 1978. Comparison of the Pilodyn and torsiometer methods for the rapid assessment of wood density in living trees. N.Z. J. For. Sci.8: 384–391.
Cown, D.J. 1979. Use of the Pilodyn wood tester for the assess-ment of wood density in standing trees — influence of site and tree age. N.Z. For. Serv. For. Res. Inst. Bull. 13.
Falconer, D.S., and Mackay, T.F.C. 1996. Introduction to quantita-tive genetics. Fourth ed. Longman Group Ltd., Harlow, U.K. Greaves, B.L., Borallho, N.M.G., Raymond, C.A., and Farrington,
A. 1996. Use of a Pilodyn for the indirect selection of basic den-sity inEucalyptus nitens. Can. J. For. Res.26: 1643–1650. Gough, G., and Barnes, R.D. 1984. A comparison of three methods
of wood density assessment in a Pinus elliottii progeny test. South. Afr. For. J. 128: 22–25.
Harding, K.J. 1995. Age trends of genetic parameters for wood properties of loblolly pine. Ph.D. thesis. North Carolina State University, Department of Forestry, Raleigh, N.C.
Koch, L., and Fins, L. 2000. Genetic variation in wood specific gravity from progeny tests of ponderosa pine (Pinus ponderosa
Laws.) in northern Idaho and Western Montana. Silvae Genet. 49: 174–181.
Lambeth, C.C. 1983. Early testing. An overview with emphasis on loblolly pine. In Proceedings of 17th Southern Tree Improve-ment Conference, 7–9 June, 1983, Athens, Georgia. National Technical Information Services, Springfield, Va. pp. 297–311. Li, B., Williams, C.G., Carlson, W.C., Harrington, C.A., and
Lambeth, C.C. 1992. Gain efficiency in short-term testing: ex-perimental results. Can. J. For. Res.22: 290–297.
Littell, R.C., Milliken, G.A., Stroup, W.W., and Wolfinger, R.D. 1996. SAS system for mixed models. SAS Institute Inc., Cary, N.C.
Lynch, M., and Walsh, B. 1998. Genetics and analysis of quantita-tive traits. Sinauer Associates, Inc., Sunderland, Mass. Mattheck, C., Bethge, K., and Albrecth, W. 1997. How to read the
results of resistograph M. Arboric. J.21: 331–346.
Megraw, R.A. 1985. Wood quality factors in loblolly pine. The in-fluence of tree age, position in tree, and cultural practice on wood specific gravity, fiber length and fibril angle. Tappi Press, Norcross, Ga.
Moura, V.P.G., Barnes, R.D., and Birks, J.S. 1987. A comparison of three methods of assessing wood density in provenance of
Eucalyptus camaldulensisDehnh., and other Eucalyptus species in Brazil. Aust. For. Res. 17: 83–90.
Nicholss, J.M.P. 1985. A new method for determining wood den-sity in the standing tree. Aust. For. Res. 15: 195–206.
resistance profiles and X-ray density charts of different wood species. Holzforschung,50: 303–311.
SAS Institute Inc. 1996. SAS/STAT software: changes and en-hancements through Release 6.11. SAS Institute Inc., Cary, N.C. Sprague, J.R., Talbert, J.T., Jett, J.B., and Bryant, R.L. 1983. Util-ity of the Pilodyn in selection for mature wood specific gravUtil-ity in loblolly pine. For. Sci.29: 696–701.
Taylor, F.W. 1981. Rapid determination of southern pine specific gravity with a Pilodyn tester. For. Sci.27: 59–61.
Winistorfer, P.M., Xli, W., and Wimmer, R. 1995. Application of drill resistance technique for density profile measurement in wood composite panels. For. Prod. J.45: 50–53.
Xiang, B., and Li, B. 2001. A new mixed analytical method for ge-netic analysis of diallel data. Can. J. For. Res.31: 2252–2259. Yamada, Y. 1962. Genotype by environment interaction and
ge-netic correlation of the same trait under different environments. Jpn. J. Genet.6: 498–509.
Yanchuk, A.D., and Kiss, G.K. 1993. Genetic variation in growth and wood specific gravity and its utility in the improvement of interior spruce in British Columbia. Silvae Genet.42: 141–148. Zobel, B.J., and van Buijtenen, J.P. 1989. Wood variation its causes