Copyright 0 1988 by the Genetics Society of America
Discrepancies in the Estimation of Gene Flow in Partula
Michael S. Johnson,* Bryan Clarket and James
Murrag
*Department of Zoology, University
of
Western Australia, Nedlands, W. A., Australia 6009, tDepartment of Genetics, University of Nottingham, Nottingham NG7 2RD, England, and *Department of Biology, University of Virginia, Charlottesoille, Virginia 22901Manuscript received December 5 , 1987 Revised copy accepted May 6, 1988
ABSTRACT
Methods for estimating gene flow (Nm) from genetic data should provide important insights into the dynamics of natural populations. If they are to be used with confidence, however, the methods must be shown to produce valid results. Estimates of Nm have been obtained for the snails Partula taeniata and Partula suturalis, based on FST and on the frequencies of private alleles,
p(
1). Jackknifing was used to reduce the bias of estimates and to obtain confidence limits. The estimates derived fromFsr are consistent with the low vagility of snails, and with direct field studies of gene flow in P . taeniata. In contrast, the estimates derived from p(1) were up to seven times as large, less precise and less consistent. Although the underlying causes of these discrepancies are not clear, the results suggest that Fsr is the more reliable indirect estimator of gene flow, at least for Partula.
I
N order to study the nature of genetic divergence among populations and to investigate the condi- tions leading to speculation, it is important to under- stand the effects of gene flow. We do not know whether gene flow ensures the cohesiveness of species (MAYR 1963; STANLEY 1979) or whether local selec- tion can easily overcome the effects of gene flow (EHRLICH and RAVEN 1969; ENDLER 1977). The com- bined effects of population size(N)
and the rate of genetic migration ( m ) determine the ease with which natural selection or genetic drift can bring about genetic divergence. UnlessN m
<
1, approximately, genetic drift will be overwhelmed by the homogeniz- ing effects of gene flow, while selection may be ex- pected to cause divergence only if selection coeffi- cients are greater than the migration rate (SLATKIN1985a, 1987).
Although gene flow is fundamentally important, it is not easy to measure in natural populations. For most species, monitoring migration over a full gener- ation poses serious practical problems. Even under the best of circumstances, interpretations are difficult, because the movement of individuals is not the same as gene flow, the movement of genes. Furthermore, intermittent gene flow and occasional long-distance dispersal are especially difficult to detect, but can be important in evolution.
An alternative strategy is the indirect estimation of gene flow from indices of genetic differentiation (see the summary by SLATKIN 1985a). One method em- ploys the theoretical relationship between population structure and FST, the standardized variance of allelic frequencies (WRIGHT 1943, 1969). A more recent method is based on conditional average frequencies, the average frequencies of alleles in those populations in which they occur (SLATKIN 1981). Of special inter-
Genetics 1 2 0 233-238 (September, 1988)
est is the use of uprivaten alleles to quantify gene flow (NEEL 1973, SLATKIN 1985b). These methods pro- duce estimates of
Nm.
Because they can easily be applied to data on allozyme frequencies, they should be of use in cases where direct estimation of gene flow is not possible. Furthermore, because the indirect genetic methods integrate the effects of gene flow over relatively long periods of time, they ought to provide estimates that are more relevant to evolution- ary studies than those obtainable by direct methods. Because they are indirect, however, the validity of the estimates of N m from genetic data depends upon the applicability or robustness of the underlying models. Several empirical studies have given encouraging re- sults from indirect estimation of gene flow (SLATKIN1981, 1985b; LARSON, WAKE and YANEV 1984; CAC-
CONE 1985; SINGH and RHOMBERG 1987; WAPLES
1987), but discrepancies between estimates derived from
FsT
and those derived from private alleles have been found (WAPLES 1987). Further tests and com- parisons of the methods are necessary. Of special importance are cases in which inferences about gene flow can be compared with direct experimental evi- dence.MATERIALS AND METHODS
We examined the geographic variation in allozyme fre- quencies among 22 samples of P. taeniata and 23 samples of P . suturalis. These samples, each consisting of approximately 20 snails, were drawn from the entire range of each species.
The average distance between samples was 4.7 km (range,
0.5-12.5). The allozyme data were taken from our earlier
study (JOHNSON, MURRAY and CLARKE 1986). The full set
of data has been deposited in the library of the Royal Society, London, and is available from any of the authors. In both P. taeniata and P. suturalis, the two samples from
Mount Ahutau, at the southern end of Moorea, are so
divergent allozymically that phenetic clustering separates them not only from their nonspecifics, but also from all the
other species on Moorea (JOHNSON, MURRAY and CLARKE
1986, 1987). Consequently, we have analyzed the geo- graphic variation both with and without these populations.
FST was calculated for each polymorphic locus and was averaged across loci according to the methods of WEIR and COCKERHAM ( 1 9 8 4 ) . A locus was considered to be polymor- phic if the average frequency of its most common allele did not exceed 0 . 9 9 . The average of FsT across loci was used to estimate Nm as
(Nm),, = ( 1 f l S T
-
1 ) / 4 *Earlier users of this method have not attempted to place confidence limits on (Nm),,. However, faced with a similar
problem, estimating genetic distance from FST, REYNOLDS,
WEIR and COCKERHAM ( 1 9 8 3 ) found that the jackknife
procedure (MOSTELLER and TUKEY 1977) gave a satisfactory
estimate of the variance. We have used the same approach to place confidence limits on (Nm)e,t. The variance was calculated as
S b = [(k
-
l)/k]ZINmi-
(l/k)ZNmi]*where Nmi is (Nm)elf based on all loci except locus i , and k is the number of loci. This is the variance due to our sampling, and does not include the effects of finite size of the actual populations. The jackknife procedure also provides a less biased estimator of Nm, which was calculated as
Nm* = k(Nm),
-
[(k-
l)/k]ZNmiwhere ( N m ) , , is calculated from the entire set of loci.
When using the second method of estimating Nm, we
calculated the conditional frequency of each allele, p(i), at the 2 3 loci for each set of comparisons. The conditional frequency is the average frequency of the allele in those samples in which the allele was found. These values were averaged among alleles with the same incidence, i / d , where i is the number of samples in which the allele was found, and d is the total number of samples ( 2 2 or 20 for P. taeniata, 23 or 21 for P. suturalis). A rough estimate of Nm was obtained by comparing a graph of p(i) against i / d with the results of SLATKIN’S ( 1 9 8 1 , p. 3 2 7 ) simulations for the island
model. A more precise estimate of Nm was obtained from
the average frequency of “private” alleles, those found in
only one sample (SLATKIN 1985b), using the formula
log(Nm)est = [log $ ( l )
-
b]/a.The values of a and b depend upon the sample size (BARTON
and SLATKIN 1986). We used a = -0.547 and b = - 1 . 0 6 ,
which were obtained by interpolation between BARTON and
SLATKIN’S values for n = 15 and n = 2 5 , to give appropriate values for our n = 2 0 . T o obtain a less-biased estimate of
N m and its confidence limits, we again used the jackknife procedure.
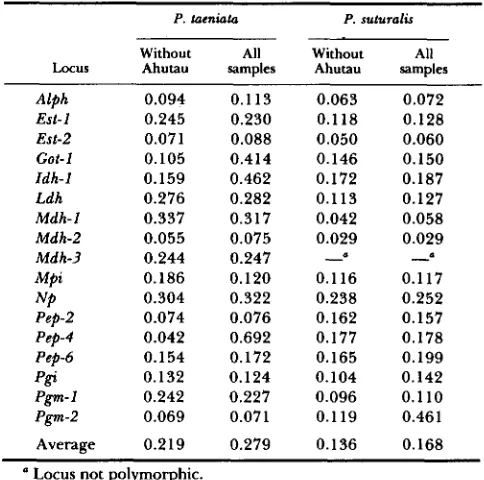
TABLE 1
Fs, for polymorphic loci in comparisons within P. taeniata and P. sutumlis
P. tacniata P. suturalis Without All Without All
Locus Ahutau samples Ahutau samples Alph 0.094 0.1 13 0.063 0.072
Est-1 0.245 0.230 0.118 0.128
Est-2 0.071 0.088 0.050 0.060
Got-1 0.105 0.414 0.146 0.150
Idh-I 0.159 0.462 0.172 0.187
Ldh 0.276 0.282 0.113 0.127
Mdh-1 0.337 0.317 0.042 0.058
Mdh-2 0.055 0.075 0.029 0.029
Mdh-3 0.244 0.247
-
Mpi 0.186 0.120 0.116 0.117
Pep-2 0.074 0.076 0.162 0.157 Pep-4 0.042 0.692 0.177 0.178 Pep-6 0.154 0.172 0.165 0.199
-
NP 0.304 0.322 0.238 0.252
p f f 0.132 0.124 0.104 0.142 Pgm-1 0.242 0.227 0.096 0.1 10
Pgm-2 0.069 0.071 0.119 0.461
Average 0.219 0.279 0.136 0.168
Locus not polymorphic.
RESULTS
Excluding the populations from Mount Ahutau,
FST
in P. taeniata is 0.219 and in P . suturalis is 0.136 (Table 1). T h e inclusion of the Ahutau samples in-
creases these values to 0.279 and 0.168, respectively.
Based on these averages, the jackknifed estimates of
N m (excluding Ahutau) were 0.99 for P . taeniata a n d
1.8 1 for P . suturalis (Table 2). These estimates were slightly higher than those based directly on FST, which
were 0.89 and 1.60, respectively. As expected, the
inclusion of the Ahutau populations decreases Nm*,
to 0.76 in P. taeniata and 1.38 in P. suturalis, and the
95% confidence limits of these values do not overlap
those for the complete sets of populations. Again, the
jackknifed estimates a r e slightly higher than the direct
estimates (Table 2). Both with and without the Ahutau
populations, estimates of gene flow a r e lower for P. taeniata than for P. suturalis.
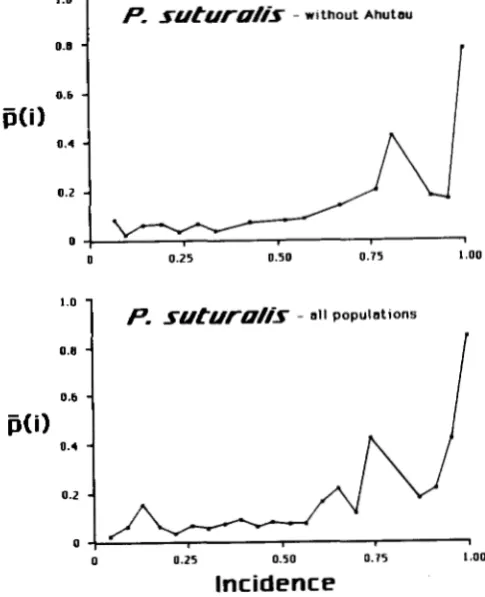
The conditional average frequencies in P. taeniata
a n d P. suturalis produce similar results, but with a few
notable differences. T h e conditional frequencies of
alleles are low over a wide range of incidences (Figures
1 and 2), a pattern typical of fairly high gene flow.
For both species, the graphs of T ( i ) against i / d a r e most similar to Slatkin’s simulations for
N m
= 1.25. Inclusion of the Ahutau populations increases P ( i ) a t low incidence, placing the graphs somewhere betweenSlatkin’s simulations for Nm of 0.25 and 1.25.
For P. taeniata, quantitative estimates of
N m
basedon the average frequency of private alleles (Table 3)
produce a similar result. T h e jackknifed estimates are
1.34 without the Ahutau populations and 1.09 when
Gene Flow in Partula 235
TABLE 2
Estimates of Nm derived using F s ~ , j(l), and j ( i ) . Values in parentheses are 95% confidence limits for jackknifed estimates
P. tumiata P. suturalis
Method Without Ahutau All samples Without Ahutau All samples
FsT-Direct 0.89 0.65 1.60 1.24
Fsr-Jackknife 0.99 0.76 1.81 1.38
$( 1)-Direct 1.76 1.92 1
.oo
9.12$( 1)-Jackknife 1.34 1.09 - 9.34
$(+-Graphical -1.25 0.25-1.25 -1.25 0.25-1.25 (0.92-1.07) (0.70-0.81) (1.69-1.92) (1.26-1.51)
(1.18-1.49) (0.73-1.44) - (8.19-10.50)
Not calculated, because of highly skewed distribution of allelic frequencies.
1 .o
0.8
0.6
P(i)
0.4
0.2
0
p. - w i t h o u t A h u t a u
1
+
0 0.25 0.50 0.75 1.00
I .o
0.0
0.6
b(i)
0.4
0.2
0
1
1
1
+
0 0.25 0.50 0.75 1.00
0 ; 1
Incidence
0 0.25 0.50 0.75 1.00
FIGURE 1 .-Conditional average frequencies for Perula taeniata, with and without the populations from Mount Ahutau.
similar to the results obtained from FsT, these esti- mates differ from them in three ways. First, they are significantly higher, by about 40%. Second, they have larger confidence intervals. Third, they reflect a much greater effect of jackknifing, which reduces the esti- mates of Nm in P. taeniata by 24 to 88%, compared with an increase of 10 to 15% for estimates based on
FST.
For P. taeniata ( N m ) , , was based on 15 or 18 private alleles. For P. suturalis, only 5 or 6 private alleles were detected, and the discrepancies in the estimation of
Nm are much greater. Excluding the Ahutau popula- tions, the direct estimate of Nm from
p(
1) is 1 .OO. It was not possible to obtain a jackknifed estimate, be- cause of the presence of the Pgm-2*’ allele at a fre-0 0.25 0.50 0.75 1.00
Incidence
FIGURE 2.-Conditional average frequencies for Partula sutur- alis, with and without the populations from Mount Ahutau.
quency of 0.39 in a single population outside of Ahu- tau, while the other private alleles have frequencies of 0.03 or less. Such a highly skewed distribution makes jackknifing inappropriate (MOSTELLER and
Tu-
KEY 1977). Inclusion of the Ahutau populations re- moves P g ~ a - 2 ~ ’ as a private allele. In this case, how- ever, the estimate of N m is very large, 9.34 with jackknifing and 9.12 by direct calculation.
DISCUSSION
TABLE 3
Frequencies of private alleles in P. tueniata and P. suturalis
P. facniata P. suturalis Allele Frequency Allele Frequency
Est-1 l Z 6 0.21 Est-1 'Os 0.03
E ~ t - 2 " ~ 0.05 Est-2" 0.03
" E ~ t - 2 ~ ' 0.02 Id h- 1 IO6 0.02
Got-1 71 0.15 Mdh-3200 0.03
Got-1 0.03 Mdh-4" 0.02
"Mdh-1 0.06 b ~ g m - 2 8 7 0.39
Mdh-1 0.02
Mdh-4" 0.02
Mpig8 0.21
Pep-6"' 0.05
Pgd 'Os 0.02
Pgd " 0.03
Pgi" 0.02
Pgm-1 ' I 3 0.02
*pgm-1 104 0.05
Pgm-2"Z 0.02 pgm-295 0.08
Sod 130 0.03
Average 2 SE
All populations 0.061 f 0.015 0.026 f 0.002 No Ahutau 0.064 f 0.018 0.087 f 0.061
a Allele present in an Ahutau population only.
Allele in Ahutau plus one other population.
tween methods, are indirect estimates of gene flow biologically informative? In most studies reported so
far, FST and conditional average frequencies have yielded similar results and have been consistent with the more direct measures of gene flow (SLATKIN
1985a). In the present study, however, there is a combination of encouraging consistency and discon- certing discrepancies.
The values of FST in P. taeniata and P. suturalis are consistent. with the low vagility of snails, and are similar to values observed in comparable species. For example, on a geographical scale similar to that of Moorea, FST in Cepaea nemoralis is 0.190 (JOHNSON
1976), close to the values for P. taeniata. Among cities in France, Helix aspersa has an FST of 0.130 (SELANDER and KAUFMAN 1975), which is close to that found for
P. suturalis. The estimates of N m in the two species of
Partula are also internally consistent in reflecting the peculiarity of the Ahutau populations, which probably have a history of isolation from other populations. The estimate of N m from FST in P. taeniata is also consistent with direct studies of gene flow. The neigh- borhood of P. taeniata has been estimated from mark- recapture experiments to be approximately 200 m2 (MURRAY and CLARKE 1984). Furthermore, over a period of 13 yr the mean displacement of introduced genes was only about 10 m, with a maximum recorded displacement of 27 m (MURRAY and CLARKE 1984). These observations confirm the low vagility of the snails, but they do not preclude occasional long-dis- tance dispersal. In particular, the potential for disper-
sal through human activities cannot be ignored. The large FST, however, confirms that genetic divergence has occurred, and that gene flow has not been large enough to prevent it. Thus, we feel safe in concluding that present-day gene flow in Partula is low. The estimates of N m imply a level of gene flow that would restrict the effects of genetic drift in most populations, but would not overwhelm the effects of any substantial local selection.
The graphical analysis of conditional average fre- quencies is consistent with this conclusion, but it pro- duces very rough estimates of Nm. The more precise estimates provided by
p(
1) are also generally consistent for P. tueniuta, but give rise to striking discrepancies for P. suturalis. These discrepancies are an apparent increase in gene flow when the Ahutau populations are included, and a large value of Nm for the full setof populations. The latter value is similar to that seen for several species of fish with planktonic dispersal (SLATKIN 1985b; WAPLES 1987)) and makes no clear biological sense.
Although the results for P. suturalis are odd, they are not the only oddities that come from the use of
p(
1). There are three obvious differences between the results from p(1) and those from FsT. First,p(
1) gave higher estimates of Nm. The increase was relatively small for P. taeniata, but was about sevenfold for the complete set of populations of P. suturalis. This change is opposite in direction from those seen in other cases where conditional average frequencies have estimates that differ from those derived fromFST (LARSON, WAKE and YANEV 1984; WAPLES 1987). Second, FST gave more precise estimates of Nm, as indicated by the smaller confidence intervals. Finally,
FST gave estimates that were more consistent with biological expectations. For example, including the Ahutau populations decreased (Nm),,, from FST. With
p(l),
however, it had conflicting effects, the most dramatic of which was the greatly increased estimate of N m in P. suturalis. Although this increase was due to only one allele, P P - ~ ~ ' , it suggests that sampling problems were greater for p(l) than for FST. For P. taeniuta, the inclusion of the Ahutau populations pro-duced a nonsignificant increase in (Nm),, calculated directly from p(l), but a nonsignificant decrease in the jackknifed estimate. The effect of jackknifing on estimates of N m is another way in which p(1) gives confusing results. For P. taeniata, jackknifing had a much greater effect on p(1) than on FST. Thus, jack- knifing not only provided confidence intervals and less biased estimates, but also revealed hidden differ- ences between the two methods of estimating gene flow.
The implication of these differences is that, at least for Partula, FST gives more reliable estimates. A recent study of marine fishes, which have very large N m ,
Gene Flow in Partula 237
cies can occur over a wide range of values. It is important to understand the basis for these discrep ancies.
A fundamental difference between FST and p(1) is that the former is most affected by common alleles, whereas the latter is derived from the frequencies of uncommon alleles. As a result, estimates of
N m
from p(1) will often be based on smaller samples. In the case of Partula, the results for P. taeniutu from p(1) were roughly consistent with those from FST, and were based on 15 or 18 private alleles. The odd results forP. suturalis, however, were based on only 5 or 6 private alleles. Although it should be difficult to find private alleles in species with high gene flow (e.g., WAPLES 1987), the present study shows that it can be difficult even in species with low to moderate gene flow. Statistically, it is important to distinguish be- tween the accuracy of an estimate and the precision of that estimate (SOKAL and ROHLF 1969). A small number of private alleles is expected to reduce both the accuracy and the precision of estimates of
Nm.
The large jackknifed estimate of
N m
for the whole set of P. suturalis populations, however, did not have a particularly large confidence interval. It is reasonably “precise,” despite its apparent inaccuracy. This implies that the size of the sample is not the only source of difficulty.A problem that may arise with both estimators of
N m
is that the underlying models may not be appli- cable. Both methods are based on equilibrium in an island model with no selection. The low vagility of snails renders them inconsistent with the assumptions of the island model. Furthermore, in both P. taeniataand P. suturalis genetic similarities decrease with geo-
graphical distance (JOHNSON, MURRAY and CLARKE
1986), a pattern which is also inconsistent with the island model. Simulations have shown, however, that estimation of
N m
by either FST or p(1) is not strongly affected if populations correspond to other models of spatial organization, including the more appropriate two-dimensional stepping stone model (SLATKIN 1985a,b). Unless common and uncommon alleles are differentially affected by the particular spatial orga- nization of Partula populations, this factor will not explain the discrepancies between the two methods.Nor are they likely to be explained by failure to reach equilibrium, because both FsT and
p(
1) approach equi- librium quickly (CROW 1985; SLATKIN 1985b).An assumption of both approaches is that diver- gence is due to genetic drift. Although
p(i)
is insensi- tive to some types of selection (SLATKIN 198 1, 1985b), selective forces that act differentially on common and uncommon alleles, or that vary geographically, could have different effects on the two estimators ofNm.
Some sort of balancing selection (such as frequency dependence) might preserve combinations of electro- morphs, whereas geographically variable selection
could increase the divergence between populations in the frequencies of common alleles, or produce locally high frequencies of private alleles.
The operation of balancing selection on electro- morphic combinations over many loci seems very un- likely. Geographically variable selection, on the other hand, does not require novel mechanisms. Some evi- dence of geographically variable selection is found in the distribution of frequencies of private alleles (Table
3). As SLATKIN (1 985b) argued, such selection should result in a large variance in the frequency of private alleles. It was the absence of such variation in the cases he analyzed which led him to reject this source of bias in his estimates of gene flow. In contrast, the modal p(1) in P. taenhtu is 0.02, but 3 of the 21 private alleles have frequencies of 0.15 or greater. One of the 7 private alleles in P. suturalis also stands out sharply from the others, with a frequency of 0.39.
Geographically variable selection may also explain the large-scale patterns of geographic variation in these species (JOHNSON, MURRAY and CLARKE 1986,1987). Only if p(1) is more affected than FST by geographi- cally variable selection, however, can this explain the discrepancies between estimates based on FST and p ( i ) . Careful modeling will be required to discover whether such discrepancies are to be expected. Regardless of the underlying causes, however, our results indicate that p(1) is a less reliable indirect estimator of gene flow than FsT.
This work was supported by the Australian Research Grants Scheme, the United StatesAustralia Cooperative Science Program (NSF: 2AS-30), and the Science and Engineering Research Council, U.K. We thank W. J. BARENDSE and N. H. BARTON for comments on early versions of the manuscript.
LITERATURE CITED
BARTON, N. H., and M. SLATKIN, 1986 A quasi-equilibrium theory of the distribution of rare alleles in a subdivided population. Heredity 5 6 409-4 15.
CACCONE, A., 1985 Gene flow in cave arthropods: a qualitative and quantitative approach. Evolution 3 9 1223-1 235. CROW, J. F., 1985 The neutrality-selection controversy in the
history of evolution and population genetics. pp. 1-18. In:
Population Genetics and Molecular Evolution, Edited by T. OHTA and K. AOKI. Japan Science Society Press, Tokyo.
EHRLICH, P. R., and P. H. RAVEN, 1969 Differentiation of popu- lations. Science 1 8 8 221-228.
ENDLER, J. A., 1977 Geographic Variation, Speciation, and Clines. Princeton University Press, Princeton, N.J.
JOHNSON, M. S., 1976 Allozymes and area effects in Cepaea ne-
moralis on the western Berkshire Downs. Heredity 36: 105- 121.
JOHNSON, M. S., J. MURRAY and B. CLARKE, 1986 Allozymic similarities among species of Partula on Moorea. Heredity 5 6
JOHNSON, M. S., J. MURRAY and B. CLARKE, 1987 Independence of genetic subdivision and variation for coil in Partula saturalis. Heredity 5 8 307-313.
LARSON, A., D. B. WAKE and K. P. YANEV, 1984 Measuring gene flow among populations having high levels of genetic fragmen- tation. Genetics 1 0 6 293-308.
MAYR, E., 1963 Animal Species and Evolution. Harvard University Press, Cambridge, Mass.
MOSTELLER, F., and J. W. TUKEY, 1977 Data Analysis and Regres-
sion. Addison-Wesley, Reading, Mass.
MURRAY, J., and B. CLARKE, 1984 Movement and gene flow in
Partula laeniuta. Malacologia 25: 343-348.
NEEL, J. V . , 1973 “Private” genetic variants and the frequency of mutation among South American Indians. Proc. Natl. Acad. Sci. USA 7 0 3311-3315.
REYNOLDS, J., B. S . WEIR and C. C. COCKERHAM, 1983 Estimation
of the coancestry coefficient: basis for a short-term genetic distance. Genetics 105: 767-779.
SELANDER, R. K., and D. W. KAUFMAN, 1975 Genetic population structure and breeding systems. pp. 27-48. In: Isozymes, Vol. 4, Edited by C. L. MARKERT. Academic Press, New York. SINGH, R. S . , and L. R. RHOMBERG, 1987 A comprehensive study
of genic variation in natural populations of Drosophila melano- gaster. 1. Estimates of gene flow from rare alleles. Genetics 115:
SLATKIN, M., 1981 Estimating levels of gene flow in natural pop- 313-322.
ulations. Genetics 9 9 323-335.
SLATKIN, M., 1985a Gene flow in natural populations. Ann. Rev. Ecol. Syst. 16: 393-430.
SLATKIN, M., 1985b Rare alleles as indicators of gene flow. Evo- lution 3 9 53-65.
SLATKIN, M., 1987 Gene flow and the geographic structure of natural populations. Science 236 787-792.
SOKAL, R., and J. ROHLF, 1969 Biometry. W. H. Freeman, San Francisco.
STANLEY, S. M., 1979 Macroevolution: Pattern and Process. W. H. Freeman, San Francisco.
WAPLES, R. S., 1987 A multispecies approach to the analysis of gene flow in marine shore fishes. Evolution 41: 385-400. WEIR, B. S., and C . C . COCKERHAM, 1984 Estimating F-statistics
for the analysis of population structure. Evolution 3 8 1358- 1370.
WRIGHT, S., 1943 Isolation by distance. Genetics 28: 114-1 38. WRIGHT, S., 1969 Evolution and the Genetics of Populations. Vol. 2.
The Theory of Gene Frequencies. University of Chicago Press, Chicago.