*
Corresponding author: [email protected]
Precise calculation of neutron-capture reactions contribution in
energy release for different types of VVER-1000 fuel assemblies
Georgy Tikhomirov*, Rynat Bahdanovich, and Phu Pham
National Nuclear Research University MEPhI (Moscow Engineering Physics Institute), Department of Theoretical and Experimental Physics of Nuclear Reactors, 115409 Kashirskoe shosse 31, Moscow, Russia
Abstract. Precise calculation of energy release in a nuclear reactor is necessary to obtain the correct spatial power distribution and predict characteristics of burned nuclear fuel. In this work, previously developed method for calculation neutron-capture reactions – capture component – contribution in effective energy release in a fuel core of nuclear reactor is discussed. The method was improved and implemented to the different models of VVER-1000 reactor developed for MCU 5 and MCNP 4 computer codes. Different models of equivalent cell and fuel assembly in the beginning of fuel cycle were calculated. These models differ by the geometry, fuel enrichment and presence of burnable absorbers. It is shown, that capture component depends on fuel enrichment and presence of burnable absorbers. Its value varies for different types of hot fuel assemblies from 3.35% to 3.85% of effective energy release. Average capture component contribution in effective energy release for typical serial fresh fuel of VVER-1000 is 3.5%, which is 7 MeV/fission. The method will be used in future to estimate the dependency of capture energy on fuel density, burn-up, etc.
1 Introduction
Calculation of energy release in fuel core of nuclear reactor plays an important role both at the stage of design and during the operation. As of today the majority of energy release estimations leave out of account capture component of energy release, which is connected with neutron-capture reactions ((n,), (n,), etc.). This component is defined by the nuclide composition of fuel core and neutron spectrum. That is why it varies for different burn-ups, fuel designs and is hard to calculate.
Use of underestimated value of energy release by engineering programs could produce considerable error in distribution of energy release in a fuel core and in characteristics of spent nuclear fuel. The precision of energy release calculation is important for prediction of reactor’s antineutrino spectrum [1].
Different fuel assembly models of VVER-1000 were calculated in order to estimate the influence of several factors on capture component. An equivalent cell model was considered in order to test the developed method. After that, different types of fuel assembly models were calculated to confirm the obtained results and to examine the influence of fuel enrichment and presence of burnable absorbers on the capture component of energy release.
On the first stage of effective energy release calculation, we used MCNP 4 and MCU 5 codes to
obtain nuclear reaction rates for each isotope in the developed model (equivalent cell model, fuel assemblies 13ZS and 30ZSV). Results obtained by two codes showed good agreement. Further, we used only MCU code to calculate other types of fuel assemblies (16ZS, 24ZS, 24ZSV, 24ZSW, 35ZS, 35ZSU).
It is important to note, that all the calculations using MCNP code were performed in the past and discussed in [2, 3]. The temperatures of materials were specified by accessible cross-section libraries. In this work, we re-examined the results using improved method for the effective energy release calculation.
2 Calculation of effective energy release
components
Average energy released after one fission (fission energy yield, Ef)could be represented as:
Ef = Ek + En + EȖ inst + EȖ del + Eȕ + EȞ (1) Ek – kinetic energy of fission products, En – kinetic energy of instant and delayed fission neutrons,EȖ instand
EȖ del – energy of instant and delayed gamma rays, E – kinetic energy of delayed beta particles, EȞ – kinetic
energy of antineutrinos.
Part of a fission energy, which dissipates in a fuel core, is called effective fission energy (Eeff):
ǻEn – adjustment, which takes into account loss of fission neutrons kinetic energy after absorption, which leads to fission, ǻEȕȖ– adjustment for delayed energy, which considers that beta decays of fission products are incomplete and shows how much energy will be radiated in future.
Considering that some energy is also released in neutron-capture reactions (capture energy), effective energy release (Eefe) is:
Eefe = Ef- EȞ -ǻEn - ǻEȕȖ+ Ecapt (3)
Ecapt = Ecapt inst + Ecapt. del (4) Ecapt – energy released in neutron-capture reactions, sum of instant capture energy (Ecapt inst) and delayed capture energy (Ecapt. del), released during decay of products of neutron-capture reactions. The main contributors to capture energy in fuel core are (n,) and (n,) reactions [1, 4-7].
Developed method for calculation of effective energy release is based on the use of high-precision neutron codes (MCNP, MCU, SCALE, SERPENT, etc.) for reaction rates estimations in a fuel core. Using these codes allow conducting precise calculations and obtaining results close to the experimental ones. The precision of such codes is defined by the used evaluated nuclear data libraries.
Calculation of energy release in a nuclear reactor was divided into three stages:
1. Development of reactor’s mathematical model and selection of important nuclear reactions and isotopes. Complexity of the model and its detailing could considerably influence the results.
2. Computation of fission and capture reaction rates in developed model with the use of high-precision neutron codes.
3. Calculation of effective energy release components with the use of obtained reaction rates and fission, neutron-capture ((n,), (n,), etc.) and decay energy yields table values based on data from Nubase2012 and ENDF/B-VII.I [8, 9].
In order to obtain the correct results the neutron multiplication factor (Keff) in the developed model should be equal unity. Otherwise, one could get the wrong neutron balance.
3 Calculated models and results
3.1 Equivalent cell model
In order to test the developed method for calculation of capture reactions contribution in effective energy release we calculated an equivalent cell model of VVER-1000 with neutron reflection on the boarders (Figure 1, Table 1).
As in a nuclear reactor, the multiplication factor in this model is equal unity (10B put into the moderator, equal to 21.7 and 17.8 g (H3BO3) / kg (H2O) for cold and hot states). Calculation of energy release was conducted only for cold and hot fresh fuel. The concentration of fission products was assumed much lower than their equilibrium concentration (negligible).
In order to calculate the delayed beta and gamma energy we used an adjustment ǻEȕȖ. After 0.5 day from the reactor start-up ǻEȕȖ=1.38 MeV/fission (for uranium fuel, according to formulas from [1]). The same value of ǻEȕȖ we obtatined for all models presented in the paper.
This amount of energy should be substracted from the table fission energy yield, the same as the energy of antineutrinos.
Fig. 1. Dimensions of the equivalent cell model (mm).
Capture energy which is given in the results contains instant capture energy and delayed capture energy calculated for 0.5 days from the reactor start-up (Table 2). We should note, that the delayed capture energy is approximately 5.5% of capture energy and it is defined by the decay of 239U. This contribution could increase for burned fuel.
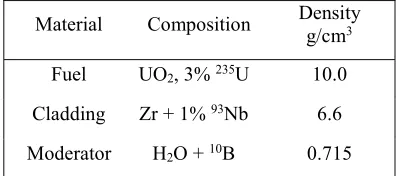
Table 1. Material characteristics of the equivalent cell model.
Material Composition Density g/cm3
Fuel UO2, 3% 235U 10.0
Cladding Zr + 1% 93Nb 6.6
Moderator H2O + 10B 0.715
The difference in the functionals calculated using MCU and MCNP codes is small. It exists mostly because of the difference in the evaluated nuclear data libraries.
Code MCU uses continuous temperature dependent cross-section library VESTA in the thermal energy range and 26-group BNAB data library in the intermediate energy range. However, resolved resonances are calculated using Breit-Wigner or Adler-Adler formalism. For the fast energy range (higher than 100 KeV) we used continuous cross-section library at 300 based on ENDF/B-VII.0. MCNP uses continuous cross-section libraries for all energy ranges and temperatures. That could be the reason why the difference for hot state is more that for cold state.
neutron capture (n,c) as (n,) reaction for all nuclides except 10B and 16O for which (n,) is dominant. According to our estimations, such simplification could cause 0.3% decrease in capture energy value for the hot state and 0.4% for the cold state.
Table 2. Results of the equivalent cell model calculation (energy in MeV/fiss.).
Functional MCNP MCU
MCNP MCU -MCNP
Cold state: Tfuel=293.6 , Tcladding=293.6 , Tmoderator=293.6
Ʉeff 1.0161 1.0171 -0.10%
ǻEn 0.07 0.07 0.00%
ȿcapt. 6.15 6.19 -0.65%
Eefe 198.4 198.4 0.00%
ȿcapt / Eefe 3.10% 3.12% -0.65% Hot state: Tfuel=1200 , Tcladding=900 ,
Tmoderator=600
Ʉeff 1.0075 1.0027 0.48%
ǻEn 0.08 0.08 0.00%
ȿcapt. 6.69 6.77 -1.20%
Eefe 199.0 199.0 0.00%
ȿcapt / Eefe 3.36% 3.40% -1.22%
Capture energy for the hot fresh fuel is 6.7 MeV/fiss., that is 3.4% of the effective energy release; for the cold fresh fuel is 6.2 MeV/fiss., that is 3.1% of the effective energy release. The difference is caused by the Doppler resonance broadening of 238U after heating of the fuel. Neutron capture on 238U increases by 12%, on 10B decreases by 10% and on hydrogen decreases by 3%, effect for other isotopes is small. Energy release in (n,) reaction on 238U is higher than in (n,) on 10B that is why the capture energy increases. Boron concentration is lower in hot state because of the Doppler resonance broadening (238U).
3.2 Modified serial fuel assemblies
Models of modified 13ZS and 30ZSV fuel assemblies with neutron reflection on the boarders were calculated in order to estimate influence of complex geometry and presence of burnable absorbers on capture energy component (Figure 2). Dimensions of the fuel rods are the same as for equivalent cell model (Figure 3, 4). Material compositions are in Table 3. Fuel assembly’s pitch is 236 mm.
The results are presented in Table 4. Difference in the results obtained by MCU and MCNP is small and it is the same order of magnitude as for equivalent cell model.
Capture energy component contribution in effective energy release for hot state of fuel assembly without gadolinium (type 13ZS) is 3.4%, and for fuel assembly with gadolinium (type 30ZSV) is 3.9%. The results demonstrate that effective energy release increases by 0.9 MeV/fiss. (or 0.5%) for fuel with gadolinium. It is because the energy release in (n,) reaction on gadolinium is three times higher than in (n,) reaction on boron.
Table 3. Characteristics of modified serial fuel assemblies’ materials.
Material Composition Density
g/cm3
Fuel UO2, 3% 235U 9.5
Fuel with gadolinium
UO2 (2.4% 235U) + 6.4% 157Gd
2O3 9.34
Cladding
93.33% Zr + 1% 93Nb + 4% Fe + 0.6% Ni + 1% Cr
+ 0.06% Ti + 0.01% C
6.6
Steel (08X18H10T)
69.9% Fe+2% + 18.5 % 52Cr+10.5 % Ni + 1% Ti +
0.1% C
7.7
Moderator H2O + x% H3BO3 0.715
Fig. 2. Fuel assembly 13ZS (considering all fuel rods the same) and fuel assembly 30ZSV with gadolinium. 1 – fuel rod (3%
235U), 2 – fuel rod with gadolinium (2.4% 235U, 6.4% 157Gd
2O3), 3 – guide channel.
Fig. 3. Characteristics of a fuel rod (mm).
Fig. 4. Characteristics of a guide channel (mm).
Table 4. Results of 13ZS and 30ZSV fuel assemblies’ calculation (energy in MeV/fiss.).
Functional MCNP1 MCU1 MCU2
MCNP MCU -MCNP
1 1 1
13ZS H3BO3,
g/kg 15.7 15.7 14.17 -
Ʉeff 1.008 1.0072 9.9975 0.08%
ǻEn 0.076 0.074 0.075 2.63%
ȿcapt. 6.64 6.72 6.83 -1.20%
Eefe 198.9 199.0 199.1 -0.05%
ȿcapt / Eefe 3.34% 3.38% 3.43% -1.15% 30ZSV
H3BO3,
g/kg 9.5 9.5 7.7 -
Ʉeff 1.0027 1.0038 1.0007 -0.11%
ǻEn 0.076 0.074 0.073 2.63%
ȿcapt. 7.60 7.64 7.73 -0.53%
Eefe 199.8 199.9 200.0 -0.05%
ȿcapt / Eefe 3.80% 3.82% 3.86% -0.48%
1T
fuel=293.6 , Tcladding and steel=293.6 , Tmoderator=600 2T
fuel=1200 , Tcladding=600 , Tmoderator and steel=578 , black border on the ends
3.3 Serial fuel assemblies
Models of serial fuel assemblies (16ZS, 24ZS, 24ZSV, 24ZSW, 35ZS, 35ZSU) with mirror reflection condition on the lateral border and black condition on the ends were calculated using MCU code in order to obtain the precise values of capture energy component (Figure 5). Dimensions of fuel rods are the same as for 13ZS and 30ZSV models (Figure 3, 4). Characteristics of materials are in Table 5 [10, 11]. Calculated Ʉeffis 0.999 for all the models.
Fig. 5. Models of VVER-1000 serial fuel assemblies (16ZS, 24ZS, 24ZSV, 24ZSW, 35ZS, 35ZSU). 1 – fuel rod (1.6%
235U), 2 – guide channel, 3 – fuel rod (2.4% 235U), 4 – fuel rod
with gadolinium (2.4% 235U, 8% Gd), 5 – fuel rod (3.6% 235U) ,
6 – fuel rod (3.3% 235U).
According to the results (Table 6) capture energy contribution in effective energy release depends on the fuel assembly’s type and varies starting from 3.35% to 3.79% for serial VVER-1000 fuel assemblies. There is a tendency of decreasing of capture energy with the increase of boric acid concentration. It is because energy release in (n,) reaction on 10B is much lower than energy release in (n,) reaction on other isotopes.
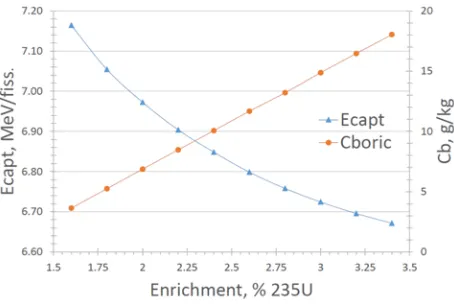
Capture energy decreases with the increase of fuel enrichment (see results for 16ZS, 13ZS, 24ZS, 35ZS). The more fuel enrichment the more boric acid should be add to achieve unity of effective multiplication factor. The dependency of capture energy on fuel enrichment is non-linear (Figure 6), the following formula could be used to calculate capture energy:
Table 5. Characteristics of serial fuel assemblies’ materials.
Material Composition Density g/cm3
Tempera ture, K
Fuel UO2, 3% 235U 9.5 1200
Fuel with gadolinium
UO2 (2.4% 235U) + 8%
Gd2O3
9.5 1200
Cladding Zr + 1% 93Nb 6.6 600
Steel (08X18H10T)
69.9% Fe + 2% + 18.5 % 52Cr +10.5 % Ni + 1% Ti + 0.1%
C
7.7 578
Moderator H2O + x%
H3BO3 0.715 578
Table 6. Results of serial fuel assemblies calculation (energy in MeV/fiss.).
Parameter 16ZS 24ZS 35ZS
Max x% 235U 1.6 2.4 3.6
H3BO3, g/kg 3.63 10.06 19.10
ǻEn 0.08 0.07 0.07
ȿcapt. 7.16 6.85 6.65
Eefe 199.4 199.1 198.9
ȿcapt / Eefe 3.59% 3.44% 3.35%
Parameter 24ZSV 24ZSW 35ZSU
Max x% 235U 2.4 2.4 3.6
H3BO3, g/kg 4.75 6.70 13.29
ǻEn 0.07 0.07 0.07
ȿcapt. 7.57 7.30 7.17
Eefe 199.8 199.5 199.4
ȿcapt / Eefe 3.79% 3.66% 3.60%
where x – fuel enrichment in weight percent, x=[1.6%, 3.4%]. However, dependency of critical boric acid concentration on fuel enrichment is linear:
Cboric (x)= 8.000x-9.149 (6)
This two formulas were obtained from the modeling of 16ZS fuel assembly with different fuel enrichments.
Concerning boric acid concentration, for assemblies 13ZS, 24ZS, 35ZS, 35ZSU it exceeds concentration allowed during normal operation on power. However, one should take into account that modeled fuel assemblies are put into fuel core of VVER-1000
together. Exceeding of normal boric acid concentration shows that it is not possible to assemble fuel core from that types of fuel assemblies alone. In addition, one should consider that there is a B4C rod regulation system with one group of rods always dropped into fuel core. That is why the estimations are reasonable.
Fig. 6. Capture energy (Ecapt) and boric acid concentration (Cboric) on fuel enrichment.
In the case of fuel core assembled of all modeled serial fuel assemblies, average capture energy is 7 MeV (3.5% of effective energy release). It is recommended to use this value for calculation of power distribution and fuel burn-up.
Interesting to note that difference in effective energy release in Table 6 is caused by the difference in capture energy. Effective energy release less capture energy (Eeff) is 192.25 MeV/fiss. for all fuel assembly models.
It is evident that energy from (n,) reactions releases almost at the same point where the reaction occurs (mostly in the moderator). If we consider that the effective fission energy and capture energy from (n,) reactions is allocated in the fuel rods (absorption of gamma rays is much higher for elements with higher number of electrons (Z)), than we could estimate capture energy distribution in the assembly. For fuel assembly 24ZS 2.8% of Eefe (part of the capture energy) releases in the fuel rods and 0.6% of Eefe in the moderator. In comparison, for the fuel assembly 24ZSV with gadolinium 3.4% of Eefe releases in the fuel rods and 0.4% of Eefe in the moderator. Thus, presence of gadolinium could increase effective energy release in fuel rods by 0.6%.
Capture energy and effective energy obtained previously for fuel assemblies (13ZS and 30ZSV), using old method [2, 3], differs from the values presented in this paper by 4% and 0.6%, correspondingly. The difference is caused by considering the delayed capture energy, ǻEn and ǻEȕȖadjustments in the effective energy
release formula (3).
4 Conclusions
VVER-1000 equivalent cell and eight models of a fuel assembly (13ZS, 30ZSV, 16ZS, 24ZS, 24ZSV, 24ZSW, 35ZS, 35ZSU). Results were obtained using MCU and MCNP computer codes.
It is shown, that capture energy release decreases with the growth of fuel enrichment for VVER-1000 and neutron-capture reactions contribution in energy release depends on fuel assembly’s type. Formula (5) was produced in order to estimate dependency of capture energy on fuel enrichment.
Results of the equivalent cell modelling are very close to the results of the fuel assembly modelling. Discrepancy in capture energy is less than 1% (for hot states). Thus, one could use a simple equivalent cell model for the estimation of the effective energy release and its dependency on different factors (burn-up, enrichment, etc.).
Results obtained by MCU and MCNP codes insignificantly differ from each other both for cold and hot states of the models. Implemented simplification concerning calculation of capture energy release using MCU code is valid. It could produce 0.3% error in the capture energy value, which leads to 0.01% error in the effective energy release.
Although boric acid concentration for some fuel assemblies exceeds normal value for reactor’s operation, the obtained results are justified, because the fuel core of VVER-1000 is assembled using different types of fuel assemblies.
Average energy release for hot fresh fuel of VVER-1000 is 199 MeV/fiss., contribution of capture energy is 3.5%.
The obtained results show that energy release for fuel without gadolinium is less by 0.5% than for fuel with gadolinium. Presence of gadolinium could also increase effective energy release in fuel rods by approximately 0.6%, because of capture energy component.
The improved method enables to calculate precise value of capture energy contribution in effective energy release for different types of nuclear reactor, and to estimate its dependency on the fuel burn-up, fuel enrichment and density, composition of fuel core, etc. Difference in the effective energy release between old method and improved method is 0.6%. It is caused by the difference in effective energy release calculation method.
This work was performed at the Department of Theoretical and Experimental Physics of Nuclear Reactors in the framework of 5-100 project. BASOV and CHERENKOV clusters of MEPhI were used for the preliminary calculations.
References
1. V.I. Kopeikin, L.A. Mikaelyan, V.V. Sinev Phys. of At. Nuc., Ɍ. 67. ʋ 10., p. 1892-1899 (2004)
2. R.B. Bahdanovich, G.V. Tikhomirov, I.S. Saldikov, E.F. Kryuchkov PHYSOR 2014 (Kyoto, Japan, 2014) 3. R.B. Bahdanovich, G. V. Tikhomirov, I. S. Saldikov,
M.Yu.Ternovykh, A. S. Gerasimov GLOBAL 2015 (Paris, France, 2015)
4. A.Y. Kramerov, Y.V. Shevelev Engineering
calculations of nuclear reactors (Energoatomizdat,
Moscow, Russia, 1984)
5. X. B. Ma, W. L. Zhong, L. Z. Wang, Y. X. Chen, and J. Cao Physical Review C - Nuclear Physics, Vol. 88, Issue 1 (2013)
6. M.F. James Journal of Nuclear Energy, Vol. 23, Issue 9, Pages 517-536 (1969)
7. A. Persic, A. Trkov Nuclear Energy in Central
Europe ’99 (Portoroz, Slovenia, 1999)
8. B. Pritychenko, A. Sonzogni, Q-value Calculator (QCalc) NNDC, Brookhaven National Laboratory URL: http://www.nndc.bnl.gov/qcalc/
9. Nuclear Energy Agency, Java-based Nuclear Data Information System (JANIS), available online. URL: http://www.oecd-nea.org/janis/
10. A.K. Gorohov, Yu.G. Dragunov, G.L. Lunin, A.N. Novikov, V.I. Tsofin, Yu.A. Anan’ev, Justification of neutron-physical and radiation characteristics of
VVER designs (IKC Academkniga, Moscow, 2004)