285 | P a g e
NOVAL METHOD DEVELOPMENT FOR THE
DETERMINATION OF ERTAPENEM IN BULK AND
INJECTION FORMULATIONS BY NIN HYDRIN AND
ASCORBIC ACID USING SPECTROPHOTOMETER
Dr. N. Aruna Kumari
1, Polepalle. Tirupalu
2 1Professor of Engineering Chemistry
Visakha Institute of Engineering and Technology
Narava, Visakhapatnam, Andhra Pradesh,(India)
2Lecturer in Chemistry,Dept. Of Chemistry
RGUKT Srikakulam,APIIIT (India)
ABSTRACT
A simple and cost effective spectrophotometric method was described for the determination of Ertapenem in pure form and in pharmaceutical formulations. The method is based on the formation of colored chromogen when the drug reacts with Nin Hydrin and Ascorbic acid. This method was applied for the determination of drug contents in pharmaceutical formulations and enabled the determination of the selected drug in microgram quantities (0.5 to 3.0 mL). No interferences were observed from excipients and the validity of the method was tested against reference method. The colored species has an absorption maximum at 563 nm for Ertapenem and obeys beer’s law in the concentration range 3-50 µg/mL of Ertapenem. The apparent molar absorptivity was
83x10-3 and sandell’s sensitivity was 7x10⁻⁴. The slope is 0.2200 ± 0.0037, the intercept of the equation of the regression line is 0.0114 ± 0.0067. The optimum experimental parameters for the reaction have been studied and the validity of the described procedure was assessed. Statistical analysis of the results has been carried out revealing high accuracy and good precision. The proposed method was successfully applied for the determination of Ertapenem in pharmaceutical formulations.
Keywords- Ertapenem, Nin Hydrin, Ascorbic acid Chromogen, Molar absorptivity, Sandell’s
sensitivity, Spectrophotometry.
I.INTRODUCTION
Ertapenem1 (Fig:1) is a carbapenem antibiotic marketed by Merck as Invanz. It is structurally very similar to
meropenem including its stability to dehydropeptidase-1. ERP is a new carbapenem of beta-lactam-type
Gram-286 | P a g e
positive and gram-negative aerobes and anaerobes and is resistant to nearly all beta-lactamases, including
extended-spectrum beta-lactamases2-11.
II.DRUG PROFILE
Name : Ertapenem (ERP)
Chemical Name : (4R,5S,6S)-3-[(3S,5S)-5-[(3-carboxyphenyl)carbamoyl]
pyrrolidin-3-yl]sulfanyl-6-(1-hydroxyethyl)-4-methyl-7-
oxo-1-azabicyclo[3.2.0]hept-2-ene-2-carboxylic acid
Structure :
Fig 1
Molecular formula : C22H25N3O7S
Empirical formula : C12H17N3O4S•H2O
Molecular weight : 475.51 g/mol
Color : Off-white
pKa : 3.37
Solubility : Soluble in water and slightly soluble in methanol.
Pharmacodynamic /
Chemotherapeutic category
: Antibacterial Agent
III.LITERATURE SURVEY ON THE ANALYTICAL METHODS FOR ERP
Literature survey revealed that a few analytical methods have been reported for the determination of ERP in
pure drug and pharmaceutical dosage forms and in biological samples using UV visible spectroscopy and liquid
287 | P a g e
A very few physico-chemical methods appeared in the literature for determination of ERP in pharmaceutical
formulations. The methods so far reported include HPLC262-273 and MS. Apart from providing better detection
and improve peak shape and high resolution; the proposed method demonstrated a low noise and better
signal-to-noise ratio during the detection process.
The analytically important functional groups of ERP are not properly exploited for designing suitable
spectrophotometric methods for the determination of ERP. Hence there is a need to develop sensitive and
flexible visible spectrophotometric methods, which prompted the author to choose ERP for the investigation
based on the different chemical reactions. Fourteen methods for UV and one method for HPLC have been
developed for ERP. The methods are based on the reactivity of ERP with suitable reagents to produce colored
species of reasonable stability having possibility for visible spectrophotometric determination of ERP in its bulk
form.
IV.EXPERIMENTAL
4.1 Instruments used
All spectral characteristics and absorbance measurements were made on Perkin Elmer, LAMBDA 25 double
beam UV-Visible spectrophotometer with 10 mm matched quartz cells. A systronics digital pH meter 361 was
used for pH measurements.
4.2 Preparation of standard drug solution
The stock solution (1mg/mL) of drug was prepared by dissolving 100 mg of ERP in 100 mL of distilled water.
A portion of this stock solution was diluted stepwise with the distilled water to obtain the working standard
solution of 100 µg/mL in the proposed methods.
4.3 Recommended Procedure
Aliquots of working standard solution (0.5 to 3.0 mL) of ERP were transferred into a series of 25 mL of
volumetric flasks, to provide final concentration range of 2 – 12 µg/mL were delivered. To each flask 4.0 mL of
pH 5.0 buffer solution 2.5 mL of NH solution (0.1%) and 2.5 mL of AA (0.1%) were added and the flask is
heated on a water bath for 15 min. and then cooled in an ice bath and the total volume was made up to the mark
with distilled water. The absorbance was measured immediately at 563 nm against a similar reagent blank. The
colored species was stable for 1 h. The amount of ERP present in sample solution was calculated from its
calibration graph.
Chemistry of the coloured species in the present investigation
288 | P a g e
Secondary amine, β-lactum ring in which there is a carboxylic acid, Tertiary nitrogen, Vulnerable oxidising
centers, Hetero Sulphur and Double bonds.
An attempt has been made to indicate the nature of coloured species formed in each proposed method for the
determination of ERP tentatively based on analogy.
Ammonium salts, dilute ammonia solutions, and some amines give a blue colour under certain conditions,
apparently because of an intermolecular oxidation and reduction of the ninhydrin in the presence of ascorbic
acid (AA). In the present investigation, the selected penems possesses amino group in their moiety, when
heated with ninhydrin in the presence of AA forms a blue violet colour product. The reaction pathway can be
represented in the following Scheme.
Scheme
The order of addition of the reagents was given in the proposed methods and the parameter fixations were given
in Tab. 1
Tab. 1 RESULTS OF METHOD OPTIMISATION FOR ERP – NH & AA
Parameter Range of
study
Optimised
condition in
procedure
289 | P a g e
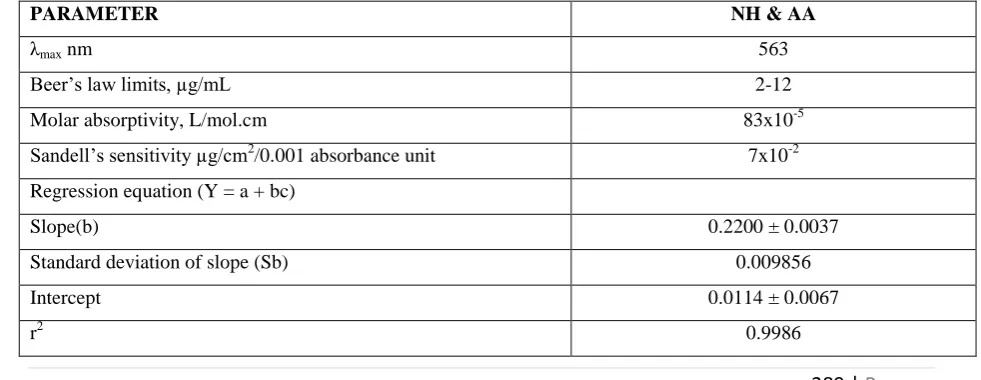
TABLE 2 SHOW THE SPECTRAL VALUES OBTAINED IN THE PROPOSED METHOD- OPTICAL
AND REGRESSION CHARACTERSTICS, PRECISION AND ACCURACY OF THE PROPOSED
METHODS FOR ERP
PARAMETER NH & AA
λmax nm 563
Beer’s law limits, µg/mL 2-12
Molar absorptivity, L/mol.cm 83x10-5
Sandell’s sensitivity µg/cm2/0.001 absorbance unit 7x10⁻²
Regression equation (Y = a + bc)
Slope(b) 0.2200 ± 0.0037
Standard deviation of slope (Sb) 0.009856
Intercept 0.0114 ± 0.0067
r2 0.9986
λmax (nm) 400-600 563
Effect of volume of
NH required for
Condensation (mL)
0.5-3.0 2.5
Volume of NH above 2.5 mL gave high optical
densities in blanks (>2.5), which resulted in
deviations from Beers law.
Effect of volume of
AA (mL) 0.5-3.0 2.5
To speed up the condensation stage in color
development, 2.5 mL of AA was found necessary for
maximum color development.
Effect of volume of
Buffer (mL) 4.0 4.0
Addition of 4.0 mL of Buffer is necessary for
proceeding the reaction
Effect of reaction
time (min) 15-30 15
The minimum time required for complete oxidation
was found to be 15 min.
Effect of temperature
(0C) for Condensation
20-40 32 ± 2 Lab.
Temp
At low temperatures (<300C) the reaction time was
found to be more and at high temperatures (>340C)
no added advantage was found.
Stanidng time (min) 1-3 2
A minimum amount of time, i.e., 1 min was
necessary for undergoing condensation and beyond
3 min results in low sensitivity.
Stability period after
final dilution (min) 5-40 40
The absorbance of the colored product decreases
290 | P a g e
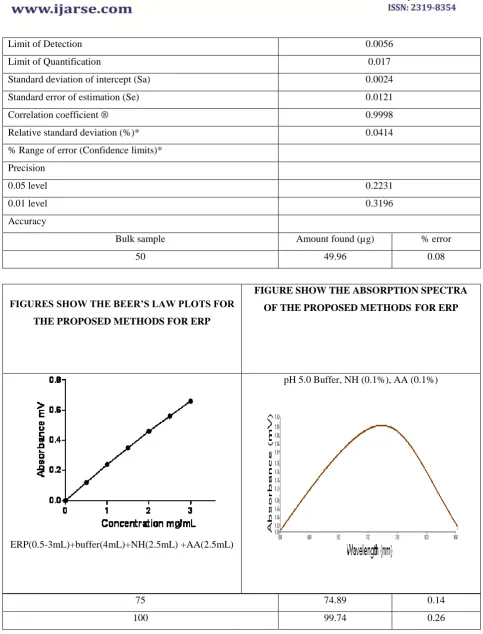
Limit of Detection 0.0056
Limit of Quantification 0.017
Standard deviation of intercept (Sa) 0.0024
Standard error of estimation (Se) 0.0121
Correlation coefficient ® 0.9998
Relative standard deviation (%)* 0.0414
% Range of error (Confidence limits)*
Precision
0.05 level 0.2231
0.01 level 0.3196
Accuracy
Bulk sample Amount found (µg) % error
50 49.96 0.08
75 74.89 0.14
100 99.74 0.26
FIGURES SHOW THE BEER’S LAW PLOTS FOR
THE PROPOSED METHODS FOR ERP
FIGURE SHOW THE ABSORPTION SPECTRA
OF THE PROPOSED METHODS FOR ERP
ERP(0.5-3mL)+buffer(4mL)+NH(2.5mL) +AA(2.5mL)
291 | P a g e
V.CONCLUSION
Even though there are very few methods for the determination of ERP, there is not even a single report utilizing
spectrophotometric technique. Hence the proposed method is valuable for the determination of ERP. The
proposed method exploit the various functional groups in ERP molecule. The contaminants, which do not
contain the functional groups chosen in the present investigation, do not interfere in the color development by
proposed method. Thus the proposed method is simple, sensitive and selective with reasonable precision and
accuracy and constitute better alternatives to the reported ones in the assay of ERP in bulk form and
pharmaceutical formulations.
REFERENCES
[1.] Agarwal H,Kaul N; paradar AR,Mahadik KR. Talanta. 2003;61:581-9.
[2.] Connors KA. A Text book of Pharmaceutical Analysis. 3rd ed. Wiley intersciences Inc.Delhi. 1994;233.
[3.] Goodman, L.S. and Gilman, A.G., The Pharmacological Basis of Therapeutics, 9th Edn. By Hardman, J.G.,
Limbard, L.E., Editors in Chief, McGraw - Hill, 1996.
[4.] Wolff, M.E., Edt, Burger's Medicinal Chemistry, Part IV, 4th Edn., Wiley Interscience, New York, 1981.
[5.] Deorge, R.F., Edt., Wilson and Gisvolds's Text book of Organic and Medicinal and Pharmaceutical
Chemistry, 8th Edn., Lippincott Company, 1982.
[6.] Korolkovas, A., Essentials of Medicinal Chemistry, 2nd Edn., Wiley Interscience, New York, 1988.
[7.] Topliss, J.G.. Edt.. Quantitative Structure - activity relationships of Drugs, Vol 19, Academic press,
London, 1983.
[8.] William O. Foye, Edt., Principles of Medicinal Chemistry, 3rd Edn., Varghese, Bombay, 1989.
[9.] Melentyeva, G., Antonova, L., Pharmaceutical Chemistry, Mir Publishers, Moscow, 1988.
[10.] L.M. Atherden, Edr, Bentley and Drivers Text Book of Pharmaceutical Chemistry, 8th Edn., Oxford
University Press, 1996, 4th Impression.