IOP Conf. Series: Earth and Environmental Science 18 (2014) 012065 doi:10.1088/1755-1315/18/1/012065
Google Earth’s derived digital elevation model: A
comparative assessment with Aster and SRTM data
N Rusli1,4, M R M ajid2 and A H M Din3
1 Faculty o f Architecture, Planning & Surveying, Universiti Teknologi MARA, 40450 Shah Alam, Selangor Darul Ehsan, Malaysia
2 Center for Innovative Planning and Development, Department o f Urban and Regional Planning, Universiti Teknologi Malaysia, 81310 Johor Bahru, M alaysia 3 Department o f Geoinformation, Faculty o f Geoinformation and Real Estate, Universiti Teknologi Malaysia, 81310 Skudai, Malaysia
E-mail: [email protected]
Abstract. This paper presents a statistical analysis showing additional evidence that Digital Elevation Model (DEM) derived from Google Earth is commendable and has a good correlation with ASTER (Advanced Space-borne Thermal Emission and Reflection Radiometer) and SRTM (Shuttle Radar Topography Mission) elevation data. The accuracy of DEM elevation points from Google Earth was compared against that of DEMs from ASTER and SRTM for flat, hilly and mountainous sections of a pre-selected rural watershed. For each section, a total of 5,000 DEM elevation points were extracted as samples from each type of DEM data. The DEM data from Google Earth and SRTM for flat and hilly sections are strongly correlated with the R2 of 0.791 and 0.891 respectively. Even stronger correlation is shown for the mountainous section where the R2 values between Google Earth’s DEM and ASTER’s and between Google Earth’s DEM and SRTM’s DEMs are respectively 0.917 and 0.865. Further accuracy testing was carried out by utilising the DEM dataset to delineate Muar River’s watershed boundary using ArcSWAT2009, a hydrological modelling software. The result shows that the percentage differences of the watershed size delineated from Google Earth’s DEM compared to those derived from Department of Irrigation and Drainage’s data (using 20m-contour topographic map), ASTER and SRTM data are 9.6%, 10.6%, and 7.6% respectively. It is therefore justified to conclude that the DEM derived from Google Earth is relatively as acceptable as DEMs from other sources.
1. DEM and watersheds segmentation
The automated watershed segmentation and extraction o f channel network and sub-watershed properties from raster elevation data represent a convenient and rapid way to parameterize a watershed. Three principle methods for structuring a network elevation data are square grid network, triangulated irregular network, and contour based networks. Square grid network are the most common form o f DEMs used for topographic analysis o f a river basin. Grid based DEMs have their advantages o f their ease computational implementation, efficiency and availability o f topographic database. In addition, research over the past decade has demonstrated the feasibility o f abstracting topographic information of hydrological interest directly from digital elevation models (DEMs). The minimum resolution o f DEMs was used by [1] in hydrological modelling study which is 5 meter resolution. Normally, 30 m eter resolution and 90 meter resolution was used [2], [3] as it can be obtained free from USGS (U.S Geological Survey)’s website. The lowest resolution was used by [4] with 250 m eter DEM resolution. Normally, in Malaysia, the topographic information normally gathered from topographic maps which can be bought from government agency; JUPEM (Department o f Survey and Mapping Malaysia) [5]. These maps scanned, digitized and generated its DEMs.
4 To whom any correspondence should be addressed.
IOPConf. Series: Earth and Environmental Science 18 (2014) 012065 doi:10.1088/1755-1315/18/1/012065 Obviously for wide areas, these processes are tedious and time consuming. As for these reasons, this paper presents an alternative method to extract elevation data using online free web tool and compare the results with SRTM 90 data and ASTER data to evaluate its quality among available free online DEM data.
2. Data and methods
2.1. Data descriptions and study area
IOPConf. Series: Earth and Environmental Science 18 (2014) 012065 doi:10.1088/1755-1315/18/1/012065
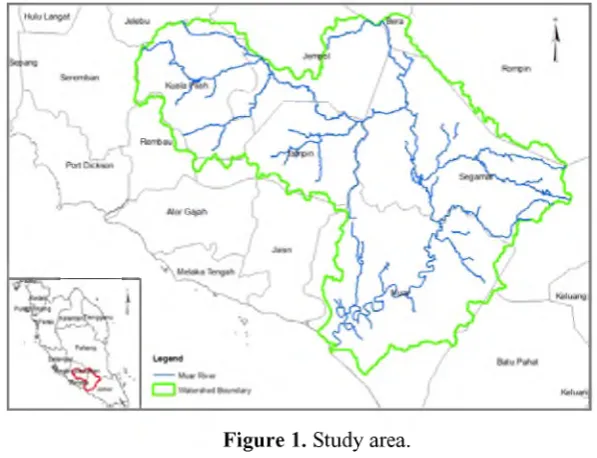
Figure 1. Study area.
(Source : Department o f Irrigation and Drainage, Malaysia)
Table 1. Various elevation data and its source.
Type Resolution Source Coordinate
Google Earth
Unknown Google Earth Lower left corner:1.926702°N,
102.056472° E
Upper right corner:2.972698° N, 103.222606°E
SRTM 90 meter http://srtm.csi.cgiar.org/ Latitude min: 0 S max: 5 N Longitude min: 100 E max: 105 E ASTER 30 30 meter http://gdem.ersdac.jspacesystems.or.jp/ Latitude min: 0 S max: 5 N ASTER 10 30 meter http://gdem.ersdac.jspacesystems.or.jp/ Longitude min: 100 E max: 105 E
2.2. Data processing
IOPConf. Series: Earth and Environmental Science 18 (2014) 012065 doi:10.1088/1755-1315/18/1/012065 value in four type o f DEM data used in this study. Further results and analysis are described in next section.
3. Results and analysis
3.1. Comparisons in fla t area
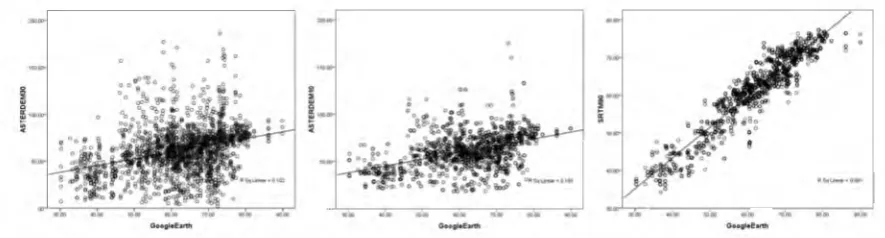
Next, further analysis was conducted to affirm, Google Earth elevation quality o f data in flat area. A total o f 5000 elevation points from ASTER 30, ASTER 10 and SRTM 90, were correlated with Google Earth elevation data. The correlation was conducted using SPSS 11 software. The results o f the correlation show in figure 2.
oao
•
o# ° 8£ | X
0
O 0
s°
°
I* 8
0r
5
• •
0O O 0
•
•
o o
I
98-
“
Jm
«
OasfUEuOi OMfUC«Vi
Figure 2. Correlation o f Google Earth data with ASTER30, ASTER10 and SRTM90.
Correlation analysis was conducted to measure the association o f each elevation type o f data with elevation extracted from Google Earth. The correlation value which is R2, between these data, will define the strength o f association between two different types o f elevation. Early conclusion can be stated that Google Earth data positively correlated with ASTER30, ASTER10 and SRTM90. However, it only strongly associated with SRTM 90 with the R2 value is 0.791. As Google Earth compared with ASTER 30 and ASTER 10, it associated stronger with ASTER 10 with R2 = 0.241. Therefore, preliminary assumption can be made, that in flat area, Google Earth elevation quality of data can be similar as SRTM 90.
3.2. Comparisons in fla t area
In addition, Google Earth data also correlated with ASTER 30, ASTER 10 and SRTM90 (see Figure 7). In hilly area, association o f Google Earth data and SRTM 90 become stronger with R2 = 0.891. However, its association decrease for ASTER 30 and ASTER 10 with R2 value is 0.102 and 0.185 respectively. Therefore in hilly area, the quality o f Google Earth elevation data also can be expected close to SRTM90 (see figure 3).
Figure 3. Google Earth data correlated with ASTER 30, ASTER 10 and SRTM 90.
3.3 Comparisons in fla t area
IOPConf. Series: Earth and Environmental Science 18 (2014) 012065 doi:10.1088/1755-1315/18/1/012065 mountainous area the quality o f Google Earth data is better than SRTM 90 and even similar to ASTER data (see figure 4).
Figure 4. Strong association between Google Earth elevation data with ASTER 30, ASTER 10 and SRTM 90 data in mountainous area.
3.4 Functionality o f the DEMs on watershed delineation
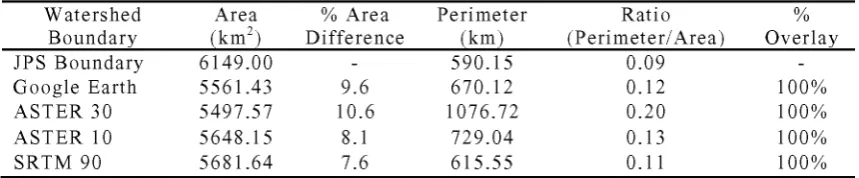
By utilizing M uar River line as an important reference for watershed delineation in ArcSW AT2009, four watershed boundaries were successfully delineated. Then, these boundaries were compared with existing watershed boundary obtained from JPS (Department o f Irrigation and Drainage) which was delineated using 20 meter interval contour line. The boundaries comparisons show in table 2.
Table 2. Watershed boundary differences with JPS boundary. W atershed
Boundary
Area (km 2)
% Area D ifference
Perim eter (km)
Ratio (Perim eter/A rea)
% O verlay
JPS Boundary 6149.00 - 590.15 0.09
-Google Earth 5561.43 9.6 670.12 0.12 100%
ASTER 30 5497.57 10.6 1076.72 0.20 100%
ASTER 10 5648.15 8.1 729.04 0.13 100%
SRTM 90 5681.64 7.6 615.55 0.11 100%
4. Conclusions
We found this study is really interesting, and we conclude this paper with these summary and findings, which are related to quality o f Google Earth elevation data, and its functionality in hydrological modelling activities:
i. In flat area, quality o f Google Earth’s elevation data is similar to SRTM90 which is approximately produce 90 meter resolution o f data. However, as Google Earth data was tested in higher (from hilly to mountainous) area, its quality become better and almost similar to quality of ASTER data, better than SRTM90.
ii. These results are significant in investigating source o f Google Earth’s elevation data which is might be from combination o f free source o f elevation data, ASTER and SRTM90. However, the comparison results made us wondering, why the quality o f Google Earth’s DEM is not consistent in flat, hilly and mountainous area. This is also might be related to location o f the study area. If it located in United States, the results may be different and the quality o f Google Earth DEM even better. Another assumption can be made is, in flat area (in the study area) only SRTM90 was utilized in Google Earth. As it goes to higher area, ASTER DEM started to be used to produce more detail terrain. Hence, to confirm the speculation o f this Google Earth D EM ’s source, on site measurement using high precision GPS should be conducted and compare its value with these four type o f DEM data.
IOPConf. Series: Earth and Environmental Science 18 (2014) 012065 doi:10.1088/1755-1315/18/1/012065 iv. Free source o f elevation data are really useful to assist researchers/students minimizing their time
collecting elevation data which are normally tedious, time consuming and costly.
Acknowledgements
The authors would like to convey a gratitude to Universiti Teknologi M alaysia and Ministry o f Higher Education (MOHE) for funding this research. This paper is a part from research entitled “Community Level M anagement o f the Effects o f Land Use/Land Cover Changes in the Magnitude and Frequency o f Flooding” (Vot 00G11).
References
[1] L. Qiu, F. Zheng, and R. Yin 2012 SWAT-based runoff and sediment simulation in a small watershed, the loessial hilly-gullied region o f China: Capabilities and Challenges,”
International Journal o f Sediment Research 27 226-234
[2] D. N. Khoi and T. Suetsugi 2012 Uncertainty in climate change impacts on streamflow in Be River Catchment, Vietnam Water and Environment Journal 26 530-539, Dec.
[3] C. G. Rossi, R. Srinivasan, K. Jirayoot, T. Le Duc, P. Souvannabouth, N. Binh, and P. W. Gassman 2009 Hydrologic evaluation o f the lower M ekong river basin with the soil and water assessment tool model,” International Agricultural Engineering Journal 18 1-13 [4] M. T. Vu, S. V Raghavan, and S. Y. Liong 2012 Sciences SWAT use o f gridded observations
for simulating runoff - a Vietnam river basin study Hydrology and Earth System Science,
16 2801-2811
[5] N. Rusli and M. R. M ajid 2012 Digital Elevation Model (DEM) Extraction from Google Earth: a Study in Sungai M uar W atershed in Geoinformation - Catalyst fo r planning, development