Scholarship at UWindsor
Scholarship at UWindsor
Electronic Theses and Dissertations Theses, Dissertations, and Major Papers
4-20-2018
Identification of User Behavioural Biometrics for Authentication
Identification of User Behavioural Biometrics for Authentication
using Keystroke Dynamics and Machine Learning
using Keystroke Dynamics and Machine Learning
Sowndarya Krishnamoorthy University of Windsor
Follow this and additional works at: https://scholar.uwindsor.ca/etd
Recommended Citation Recommended Citation
Krishnamoorthy, Sowndarya, "Identification of User Behavioural Biometrics for Authentication using Keystroke Dynamics and Machine Learning" (2018). Electronic Theses and Dissertations. 7440.
https://scholar.uwindsor.ca/etd/7440
This online database contains the full-text of PhD dissertations and Masters’ theses of University of Windsor students from 1954 forward. These documents are made available for personal study and research purposes only, in accordance with the Canadian Copyright Act and the Creative Commons license—CC BY-NC-ND (Attribution, Non-Commercial, No Derivative Works). Under this license, works must always be attributed to the copyright holder (original author), cannot be used for any commercial purposes, and may not be altered. Any other use would require the permission of the copyright holder. Students may inquire about withdrawing their dissertation and/or thesis from this database. For additional inquiries, please contact the repository administrator via email
Identification of User Behavioral Biometrics for
Authentication using Keystroke Dynamics and
Machine Learning
By
Sowndarya Krishnamoorthy
A Thesis
Submitted to the Faculty of Graduate Studies through the School of Computer Science in Partial Fulfillment of the Requirements for
the Degree of Master of Science at the University of Windsor
Windsor, Ontario, Canada
2018
by
Sowndarya Krishnamoorthy
APPROVED BY:
G. Bhandari Odette School of Business
S. Saad
School of Computer Science
L. Rueda, Advisor School of Computer Science
DECLARATION OF ORIGINALITY
I hereby certify that I am the sole author of this thesis and that no part of this thesis has
been published or submitted for publication.
I certify that, to the best of my knowledge, my thesis does not infringe upon anyone’s
copyright nor violate any proprietary rights and that any ideas, techniques, quotations, or
any other material from the work of other people included in my thesis, published or
oth-erwise, are fully acknowledged in accordance with the standard referencing practices.
Fur-thermore, to the extent that I have included copyrighted material that surpasses the bounds
of fair dealing within the meaning of the Canada Copyright Act, I certify that I have
ob-tained a written permission from the copyright owner(s) to include such material(s) in my
thesis and have included copies of such copyright clearances to my appendix.
I declare that this is a true copy of my thesis, including any final revisions, as approved
by my thesis committee and the Graduate Studies office, and that this thesis has not been
computing devices to authenticate them. The authentication is based on keystroke
dynam-ics, which captures the users behavioral biometric and applies machine learning concepts
to classify them. The users type a strong passcode ”.tie5Roanl” to record their typing
pat-tern. In order to confirm identity, anonymous data from 94 users were collected to carry
out the research. Given the raw data, features were extracted from the attributes based
on the button pressed and action timestamp events. The support vector machine classifier
uses multi-class classification with one vs. one decision shape function to classify different
users. To reduce the classification error, it is essential to identify the important features
from the raw data. In an effort to confront the generation of features from attributes an
efficient feature extraction algorithm has been developed, obtaining high classification
per-formance are now being sought. To handle the multi-class problem, the random forest
classifier is used to identify the users effectively.
In addition, mRMR feature selection has been applied to increase the classification
performance metrics and to confirm the identity of the users based on the way they
ac-cess computing devices. From the results, we conclude that device information and touch
pressure effectively contribute to identifying each user. Out of them, features that contain
device information are responsible for increasing the performance metrics of the system
by adding a token-based authentication layer. Based upon the results, random forest yields
better classification results for this dataset. The research will contribute significantly to the
field of cyber-security by forming a robust authentication system using machine learning
DEDICATION
I would like to dedicate my thesis to my dear father Mr. Krishnamoorthy, my brother
Mr. Ashwin, and especially my mother Mrs. Santhi Krishnamoorthy, who always
per-suaded me to take this program. Without their support and effort, I could not have achieved
his perpetual support, patience, and inspiration during my Master’s program in University
of Windsor. It was such an honor for me to know you, and also be in your research team.
Thank you so much for giving me an opportunity to learn from you.
Secondly, I would like to express my sincere appreciation to my internal committee
member Dr. Sherif Saad for guiding me throughout my thesis work. I thank you for the
unceasing encouragement and support.
Thirdly, I would like to thank Dr. Haytham Elmiligi from Thompson Rivers University
for developing a Android application called iProfile and collaborating with us.
Also, I would also like to express my gratitude to my external committee member Dr.
Gokul Bhandari for his beneficial advices and suggestions to my thesis.
Meanwhile I would like to express my special thanks to my friends for helping me
during the past two years.
I humbly extend my thanks to the School of Computer Science and all concerned people
who helped with me in this regard.
Finally, I would like to express my greatest appreciation to my family for all
uncondi-tional love, support, patience, encouragement, and kindness they gave me during my whole
life.
This work has been partially supported byNSERC, the Natural Science and Engineering
Council of Canada. This research has also been approved by theResearch Ethics Boardof
University of Windsor, Canada (17-109 File No.34100). I would like to acknowledge the
TABLE OF CONTENTS
DECLARATION OF ORIGINALITY III
ABSTRACT IV
DEDICATION V
ACKNOWLEDGEMENTS VI
LIST OF TABLES X
LIST OF FIGURES XI
1 Introduction 1
1.1 Authentication . . . 1
1.2 Biometrics . . . 3
1.2.1 Behavioural Biometrics . . . 3
1.2.2 Types of Behavioural Biometrics . . . 6
1.2.3 Types of Behavioural Authentication . . . 6
1.3 Keystroke Dynamics . . . 7
1.3.1 Applications . . . 8
1.4 Machine Learning . . . 9
1.5 Classification and feature selection . . . 10
1.5.1 Classification algorithms . . . 11
1.5.2 Evaluation method . . . 12
1.6 Motivation of this Thesis . . . 12
1.7 Contributions . . . 12
2 Literature review 13 2.1 Existing approaches for keystroke dynamics authentication . . . 13
2.1.1 Analysis of Strong Password Using Keystroke Dynamics Authen-tication in Touch Screen Devices . . . 13
2.1.2 Feasibility study on authentication based keystroke dynamics over touch-screen devices . . . 14
2.1.3 Statistical Keystroke Dynamics System on Mobile Devices for Ex-perimental Data Collection . . . 14
2.1.4 Evaluation of One-Class and Two-Class Classification Algorithms on Mobile Devices . . . 15
2.1.5 Keystroke dynamics for authentication in smartphones . . . 15
2.1.6 Factors affecting keystroke dynamics for verification data collect-ing and analysis . . . 15
2.1.11 Authenticating mobile phone users using keystroke analysis . . . . 17
2.1.12 Greyc keystroke . . . 18
2.1.13 User authentication through typing biometrics features . . . 18
2.2 Inspiration from the Previous Works . . . 19
3 Proposed method 20 3.1 Data Collection . . . 21
3.1.1 iProfile . . . 21
3.1.2 Process involved . . . 22
3.2 The Dataset . . . 24
3.3 Feature Extraction . . . 28
3.3.1 Pre-processing . . . 29
3.4 Feature Selection . . . 32
3.4.1 Minimum Redundancy Maximum Relevance approach . . . 32
3.5 Methods . . . 35
3.5.1 Classification . . . 35
3.5.2 Support Vector Machines . . . 36
3.5.3 Random Forest . . . 41
3.5.4 Experiments . . . 42
4 Results 45 4.1 Ten samples with device specific features . . . 45
4.1.1 Classification results on the original datasets using SVM linear . . . 45
4.1.2 Classification results on datasets after mRMR feature selection us-ing SVM linear . . . 46
4.1.3 Classification results on datasets using SVM RBF at N=36 . . . 47
4.1.4 Classification results on datasets using Random Forest at N=36 . . 48
4.1.5 Comparison of SVM Linear, RBF and Random Forest . . . 48
4.2 Thirty samples with device specific features . . . 49
4.2.1 Classification results on the original datasets using SVM linear . . . 50
4.2.2 Classification results on datasets after mRMR feature selection us-ing SVM linear . . . 51
4.2.3 Classification results on datasets using SVM RBF at N=36 . . . 52
4.2.4 Classification results on datasets using Random Forest at N=36 . . 52
4.2.5 Comparison of SVM Linear, RBF and Random Forest . . . 53
4.3 Thirty samples without device specific features . . . 53
4.3.1 Classification results on the original datasets using SVM linear . . . 54
4.3.2 Classification results on datasets after mRMR feature selection us-ing SVM linear . . . 55
4.3.3 Classification results on datasets using SVM RBF at N=88 . . . 56
4.3.4 Classification results on datasets using Random Forest at N=88 . . 56
4.3.5 Comparison of SVM Linear, RBF and Random Forest . . . 57
4.4.1 Classification results on the original datasets using SVM linear . . . 58
4.4.2 Classification results on datasets after mRMR feature selection us-ing SVM linear . . . 59
4.4.3 Classification results on datasets using SVM RBF at N=33 . . . 60
4.4.4 Classification results on datasets using Random Forest at N=33 . . 60
4.4.5 Comparison of SVM Linear, RBF and Random Forest . . . 61
4.5 Overall Comparison . . . 62
4.5.1 Comparison of classification accuracies for all experiments . . . 62
4.5.2 Comparison of F1 scores for all experiments . . . 62
4.5.3 Compilation of Results . . . 63
4.6 Experimental Evaluation . . . 64
5 Conclusion and Future Work 66 5.1 Contributions . . . 66
5.2 Future Work . . . 67
References 69
1.2.1 Comparison of biometric techniques. . . 5
1.5.1 Different classification algorithms based on learning methods. . . 11
2.1.1 KSD selected features with timing and non-timing information. . . 14
3.2.1 Dataset description that depicts the information of the collected data. . . 25
3.3.1 155 features extracted from raw data based on touch events for 77 users. . . 32
3.4.1 Dataset description in terms of features and instances. . . 34
3.5.1 Different experiments carried out on the dataset. . . 43
4.5.1 Classifier results for all experiments. . . 63
LIST OF FIGURES
1.1.1 Multi-factor authentication using three forms of factors. . . 2
1.2.1 Different types of biometrics used for authentication. . . 4
1.2.2 Behavioural biometrics as a form of authentication. . . 5
1.2.3 Types of behavioural biometrics showing static and continuous
authentica-tion. . . 6
1.3.1 Keystroke dynamics is a combination of dwell time and flight time. . . 8
3.0.1 The proposed method for user behavioural biometric authentication. . . 20
3.1.1 Screenshot of the iProfile app, which allows the users to type the passcode
via the virtual keypad. . . 23
3.2.1 The dataset showing first half of the collected data for a single user. . . 26
3.2.2 The dataset showing the last half of the collected data for a single user. . . . 27
3.2.3 Various devices used in the data collection process. . . 28
3.3.1 Extracted features from the raw data after pre-processing step. . . 30
3.4.1 Description of the mRMR feature selection algorithm. . . 33
3.5.1 The overall classification process for user authentication based on
contin-uous behavioral biometrics using machine learning. The block diagram
explains the involved steps. . . 36
3.5.2 Support vector machine classifier showing the separating hyperplane. . . . 37
3.5.3 Multi-class classification using one vs one approach representation
con-taining three classes . . . 38
4.1.1 Classification accuracy obtained before feature selection on linear SVM. . . 46
4.1.2 F1 score obtained before feature selection on linear SVM. . . 46
4.1.3 Classification accuracy using SVM linear and feature selection. . . 47
4.1.4 F1 score using SVM linear and feature selection. . . 47
4.1.5 Comparison of classification accuracies for SVM linear, RBF, Random
4.2.2 F1 score obtained before feature selection on linear SVM. . . 50
4.2.3 Classification accuracy using SVM linear and feature selection. . . 51
4.2.4 F1 score using SVM linear and feature selection. . . 52
4.2.5 Comparison of classification accuracies for SVM linear, RBF, Random
Forest. . . 53
4.2.6 Comparison of F1 scores for SVM linear, RBF, Random Forest. . . 53
4.3.1 Classification accuracy obtained before feature selection on linear SVM. . . 54
4.3.2 F1 score obtained before feature selection on linear SVM. . . 55
4.3.3 Classification accuracy using SVM linear and feature selection. . . 55
4.3.4 F1 score using SVM linear and feature selection. . . 56
4.3.5 Comparison of classification accuracies for SVM linear, RBF, Random
Forest. . . 57
4.3.6 Comparison of F1 scores for SVM linear, RBF, Random Forest. . . 57
4.4.1 Classification accuracy obtained before feature selection on linear SVM. . . 58
4.4.2 F1 score obtained before feature selection on linear SVM. . . 59
4.4.3 Classification accuracy using SVM linear and feature selection. . . 59
4.4.4 F1 score using SVM linear and feature selection. . . 60
4.4.5 Comparison of classification accuracies for SVM linear, RBF, Random
Forest. . . 61
4.4.6 Comparison of F1 scores for SVM linear, RBF, Random Forest. . . 61
4.5.1 Comparing classification accuracy performance of each classifier for all the
experiments. . . 62
CHAPTER 1
Introduction
1.1
Authentication
Authentication can be defined as verifying the validity of a user by using at least one form
of the identification methods. To grant access to the system, the users identity should be
verified by determining the following
factors-i Knowledge-based factors:It is defined as what the user knows. Some of them are any forms of a password, personal identification number, answer to the secret questions and
many more [8].
ii Possession-based factors: It is defined as what the user has. Some of them are an identification card, security token, device token or any unique hardware identifier [42].
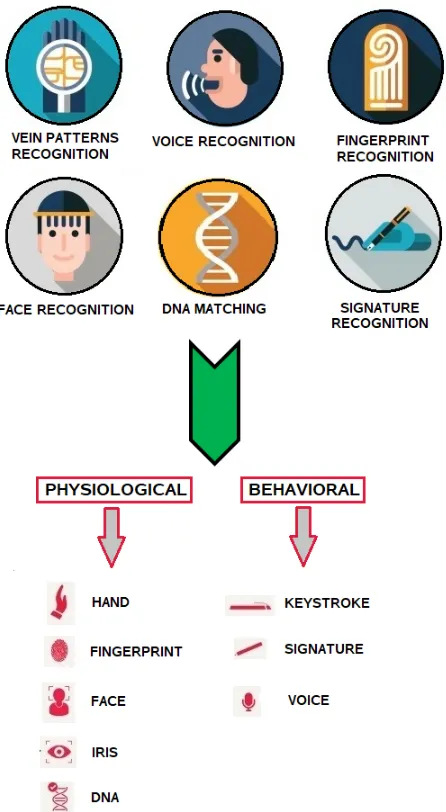
iii Inherence-based factors:It is defined based on what the user is or how he does. Some of the physiological factors are fingerprint, iris and DNA patterns and some of the
behavioural factors are biometric identifiers, signatures, voice and face [36].
Authentication can be a combination of the above. The types of authentication categories
include:-• Single-factor authentication:It makes use of one factor to authenticate the user trying
to login to the system. It is more prone to different cyber attacks.
• Two-factor authentication:It combines any two authentication factors to increase the
level of security in the system. A practical example of this implementation is the
user logins in by typing the correct password. Only if the password entered is valid
the OTP gets generated, and if the user enters the generated number from his device
correct, he gains access to the system.
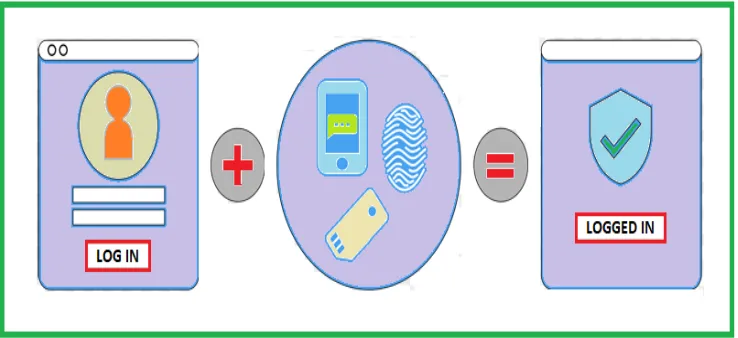
• Multi-factor authentication:-It combines many authentication mechanisms to form
a layered approach. The plethora of functionalities offered by multi-factor
authenti-cation includes protection from intrusion, enhancement of security, and reliable false
proof system. My thesis focuses more on this multi-factor authentication to develop
a robust system to identify the users via using machine learning algorithms. The idea
is to add three factors of authentication by entering the correct password, verifying
the device, and identifying the users typing pattern.
FIGURE 1.1.1: Multi-factor authentication using three forms of factors.
A strong authentication procedure involves typing a password, which is resistant to cyber
attacks and the way of typing it. This double-layer protection offers more security from
all Internet attacks such as brute-force, dictionary attack, and physical shoulder surfing.
The brute-force attack involves a hacker to try out all the possible password combinations
and is more easily guessable if the attacker knows what we know. The dictionary attack
consists of trying the common passwords in the world which work in most of the cases
[22]. Shoulder surfing involves the attacker looking for the password while one is typing it.
One of the best solutions for all these attacks is to combine the biometric pattern with the
1. INTRODUCTION
type the same way as the legitimate user types [23]. It is interesting to know that, every
user has a unique way of typing and is subject to different conditions. Thus, by training
the model to learn all the biometric movements of the user will lead to building an efficient
authentication system. Building a good model requires the best foolproof algorithm to be
created.
1.2
Biometrics
Biometrics refer to measurable human characteristics to define and identify a user [37].
They are excellent and unique user characteristics to determine their identity. As the level
of security decreases, the need for developing a highly secured identification and personal
verification system increases. Physical biometrics are very useful to control the access to
secure buildings. However, it has a major limitation that they can be easily compromised
[40]. To verify users belonging to a large population, physiological characteristics such as
fingerprints, iris, finger vein patterns, and face geometry play a vital role in user
verifica-tion. On the other hand, technology is increasingly proposed to counter the cyber attacks on
the transactions and Internet. Thus, another level of authentication based on the behaviour
of the user is required. This scheme will reduce the performance issues and enhance the
security of the existing techniques. Biometrics focuses on solid and vigorous
distinguish-ing proof of users from their own attributes, for the most part for security and validation
purposes, yet in addition for distinguishing and verifying the users of more astute
applica-tions. Every user has a unique pattern and signature to access the device; the system must
identify the illegitimate user even if the correct login ID and password is typed from the
users computing device.
1.2.1
Behavioural Biometrics
Behavioural biometrics are devices that analyze particular behavioural characteristics or
actions of an individual. It is often non-intrusive which means the information collected
is not perceived by the users. They are unique to each individual on each device. It
FIGURE 1.2.1: Different types of biometrics used for authentication.
to reduce invasiveness. These systems are very effective in detecting a threat and can be
im-proved in terms of accuracy over time. Some of the types of behavioural biometric devices
are-• Signature verification scanners
• Voice authentication scanners
• Keystroke and mouse movement scanners
These identifiers cannot be duplicated, and only the authorized person can gain access to
1. INTRODUCTION
TABLE 1.2.1: Comparison of biometric techniques.
Biometric
Technology Accuracy
Ease
of Use Cost
Devices
Required Acceptability
Iris High Medium High Camera Low
Retinal High Medium High Camera Low
Face Low Medium Medium Camera Medium
Fingerprint High High Low Scanner High
Voice Low Medium Low Microphone Medium
Signature Medium High Low Optic pen,
Touch panel Medium
Hand geometry High High Low Scanner Medium
Palm print High High Low Scanner Medium
Thermogram Medium Low High Test
equipment Low
Keystrokes High High Medium Touch screen
devices High
can be easily obtained increasing the accountability of the system. These systems are very
easy and safe to use without the need of end user training. By implementing a biometric
system, there is no need for expert administrators as it does not require expensive password
management.
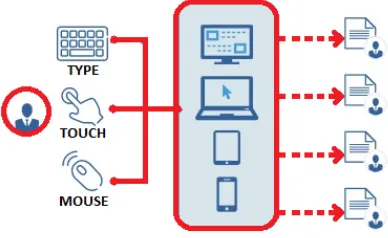
FIGURE 1.2.2: Behavioural biometrics as a form of authentication.
An extensive variety of behavioral biometrics have been proposed in view of human
associations with machine amid the most recent couple of years [38]. Table 1.2.1 depicts
the various biometric methods and its characteristics which can be used for multi-factor
1.2.2
Types of Behavioural Biometrics
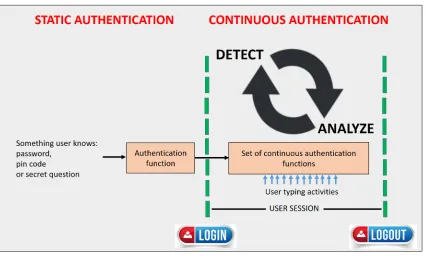
There have been increasing research efforts on the types of biometrics such as static and
dynamic authentication. Static authentication (SA) remembers a user based on
unchange-able biometrics such as fingerprints, veins, static passwords and others. The password
information is stored in a physical database and must be adaptable to change. Dynamic or
continuous authentication (CA) focuses on identifying a user throughout the session while
logged in [34]. The real-time information from a session is used to analyze and
authenti-cate the user based on the behavioural profile which has patterns interwoven with the usage
characteristics.
FIGURE 1.2.3: Types of behavioural biometrics showing static and continuous authentica-tion.
1.2.3
Types of Behavioural Authentication
In an SA system, the execution of the matching algorithm is accounted for in false match
rate (FMR) and false non-match rate (FNMR). For an SA system, it is imperative to know
1. INTRODUCTION
has not been allowed access or that an impostor user has been granted access.
The user is authenticated using behavioral biometrics and is allowed towards the
be-ginning of a session while legitimate for the full session. Static confirmation implies it is
feasible for an impostor to seize a session and take control of a system after the veritable
user has been granted access. An alternate kind of authentication, that defeats the issue
por-trayed above, is CA. A CA biometric framework checks the authenticity of the user amid
the full session. In a conventional CA system, the user ought not to know that his or her
personality is checked ceaselessly. A genuine CA system utilizes every different activity
of the user in the process to decide his or her validity. When question emerges about the
validity of the user, the system can lock, and the user needs to return to the static
authen-tication access control mechanism to proceed with working. On the contrary, we find CA
where the legitimate user is consistently verified in view of the action of the present user. It
is essential to know whether an impostor user gets identified by the system and gets locked
out, and it is significantly more critical to know how much activity can be done by the
system to uncover an impostor. Subsequently, when looking at two CA systems that both
distinguish all impostor users, the system that identifies the impostor faster is the best one.
1.3
Keystroke Dynamics
Keystroke dynamics, which is a behavioral biometry, refers to the unique patterns of rhythm
and timing-based features that are created when a user types on a touchscreen in computing
devices such as mobile devices [22]. The biometric system uses a pattern recognition
system to classify users based on their physical and behavioral characteristics [5]. It is
a method for identifying or verifying the users based on the way they type on either a
physical or vrtual keyboard. This type of system uses artificial intelligence to differentiate
legitimate users and illegitimate users. To protect a set of users from the illegitimate use of
their accounts, the attributes of how they type and use the system are taken into account for
authorizing the user.
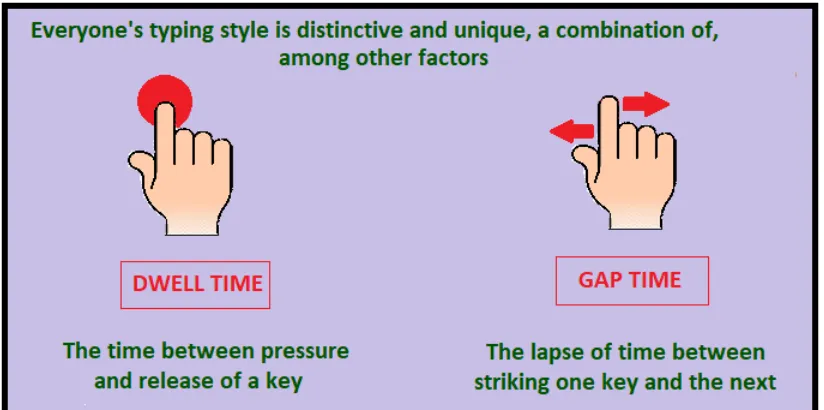
The typing dynamics gives the detailed timing information of when exactly each key
FIGURE 1.3.1: Keystroke dynamics is a combination of dwell time and flight time.
can be used as a primary pattern for future comparison.
1.3.1
Applications
Biometrics finds its application in various sectors such as police and prison services to
access the closed-circuit television footages, hospitals to identify correct patients for
treat-ment and procedures, facial recognition systems to prevent illegitimate entry, for security
access of confidential rooms and servers, Web access, enterprise network access to
incor-porate encryption along with biometric-based authentication and in many other client and
useful requirements [35]. The keystroke dynamics finds its application in these two kinds
of
systems:-• BioTracker is a biometric authentication software that uses machine learning and
keystroke dynamics to identity a user.
• BioCheckuses token based for ubiquitous Web-based login and workstation
authen-tication, which is used to verify the user.
They can be combined with any computing device based on two modes such as
1. INTRODUCTION
1.4
Machine Learning
Machine learning is the investigation of inspiring systems to learn without being
cus-tomized by programmers automatically. It is a branch of Artificial Intelligence related to
pattern recognition and computational theory [24]. In the previous decade, machine
learn-ing has given us self-drivlearn-ing automobiles, reasonable, viable Web look, and an immensely
enhanced comprehension of the human genome. Machine learning is so unavoidable today
that you most likely utilize it many times each day without knowing it. All the more
imper-atively, the hypothetical underpinnings of machine learning apply to the field of biometrics
to distinguish the users based on their behaviour [32].
It is to develop a system which automates the automation and allows the data to do the
work instead of the programmers [20]. The major categories of machine learning tasks
include the
following:-• Supervised learning: It comprises parametric/non-parametric algorithms, kernels, neural networks, support vector machines and many more classifiers.
• Unsupervised learning: It comprises clustering, recommender systems, deep learn-ing, dimensionality reduction and many more algorithms.
• Semi-supervised learning: It includes the best practices such as predisposition and difference hypothesis in artificial intelligence.
It has its applications in various contextual investigations such as data mining,
infor-mation retrieval, content comprehension, recognition and control, search engine
optimiza-tion, autonomous networks and many more. It is a branch of artificial intelligence and
has widespread into technologies such as deep learning, natural language processing,
com-puter vision, robotics, speech recognition, and others mainly for commercial use. Another
significant use of machine learning is optimization of the existing algorithms where the
parameters can be altered to establish the hidden relationships. Machine learning problems
are but not restricted to landscapes such as pattern generation, pattern recognition, anomaly
detection, prediction, speech recognition, image processing, deep learning, fraud detection,
1.5
Classification and feature selection
Classification is a machine learning approach used to differentiate and categorize the
ob-jects as they are recognized. According to machine learning terminology, classification
falls under supervised learning where the training data is labeled to be correctly identified.
On the other hand, clustering is a technique that falls under unsupervised learning, where
the training data is unlabelled, and grouping is performed based on a similarity or
dissimi-larity measure. Classification is the process of getting to know records by the training data
to identify the data points and determine to which set of categories it belongs. The variables
involved in this classification process are quantifiable properties and are known as features.
The feature types can
be:-i Categorbe:-ical (It contabe:-ins a Strbe:-ing representatbe:-ion of features.)
ii Integer-valued
iii Real-valued
In machine learning, an algorithm that implements a statistical classification problem is
called a classifier. The input data is mapped to a category based on the features and
obser-vations or instances.
The dataset usually contains some features that are redundant or irrelevant for the
clas-sification process. Thus, they can be filtered out or removed after pre-processing the data
without loss of information during the classification [10]. This process is called attribute
or feature selection where a subset of relevant features for the classification model is
se-lected. After performing feature selection, the model can yield higher performance metrics,
reduce the generalization error, reduce the training time, reduce over-fitting and can avoid
the curse of dimensionality. The algorithm performs an exhaustive search in the space to
find a new feature subset and scores them based on an evaluation measure. The goal is to
reduce the error rate and increase the performance of the classification system. It is
com-putationally useful if the dataset is large containing more number of features. The feature
[10]:-1. INTRODUCTION
• Wrapper methods: The subset search is performed using a predictive model and computes a score to select the features. Every new subset is used in the process of
training the model.
• Filter methods:The scoring method for a feature subset is based on a proxy measure such as mutual information, correlation coefficient, inter or intra class distance. They
are useful to find the relationship between features and rank the features based on
cross-validation.
• Embedded methods:During the model generation process, the non-zero regression coefficients are selected as part of the feature selection process. Some of the
com-monly used algorithms are feature elimination, LASSO, ridge regression, elastic net
regularization and many more.
However, feature selection is different from feature extraction process. Feature
extrac-tion is used to obtain the features from the raw data to form a dataset of class and features.
1.5.1
Classification algorithms
Based on the ability to make predictions the machine learning algorithms are classified into
various learning methods such as supervised, unsupervised and semi-supervised.
TABLE 1.5.1: Different classification algorithms based on learning methods.
SUPERVISED LEARNING UNSUPERVISED LEARNING
Support Vector Machines k means clustering k-Nearest Neighbour Hierarchical clustering
Decision Trees Hidden Markov models
Neural Networks Apriori algorithm for
association rule
Logistic Regression Expectation-maximization algorithm (EM)
1.5.2
Evaluation method
The system is separated into two phases. In the training phase, the training information is
utilized to develop the classifier models and store the models in a database for use amid the
testing stage. Each veritable user has his/her own particular classifier models and preparing
features. In the testing phase, system will utilize test information which was isolated from
the training information for comparison.
1.6
Motivation of this Thesis
The primary focus of this work is to develop a system using machine learning methods to
authenticate the users correctly. In the new era, stronger authentication techniques are
re-quired to detect security breaches. One such approach would be to introduce a multi-layer
authentication mechanism. In the past [1, 3, 13, 29, 31], mRMR feature selection with
SVM classification (One vs. One approach optimized by grid search) was not performed
for keystroke dynamics authentication. The model proposed in this thesis is novel and
con-centrates on enhancing the classification performance by applying feature selection while
the prior research included only a few features.
1.7
Contributions
In our experiments, the users were allowed to input data with any Android device using the
iProfile app from anywhere. The app has a virtual keypad which has the same coordinate
position, location of the keys and spacing of the keys. Thus, the built classification model
can be more robust and can recognize users more accurately. In this thesis, we demonstrate
how random forest yields high classification accuracy for this data set.
In Chapter 2 we review some of the related works for user authentication using keystroke
dynamics and machine learning, and in Chapters 3, 4, 5, 6, 7 and 8 we discuss the proposed
CHAPTER 2
Literature review
In this chapter, we review some of the literature about keystroke dynamics for
authentica-tion that uses various feature selecauthentica-tion and classificaauthentica-tion algorithms.
2.1
Existing approaches for keystroke dynamics
authenti-cation
Many works have been done in this area to identify and verify the users, and increase the
performance metrics.
2.1.1
Analysis of Strong Password Using Keystroke Dynamics
Authen-tication in Touch Screen Devices
Asma Salem and Dema Zaidan published a paper which examined the use of verification
and identification system for touch screen mobile devices. They built a multi layer
per-ceptron neural network model for classification using WEKA. This paper also combines
the timing and non-timing features together and conclude that non-timing features increase
the security level [33]. The experiment is carried out using five users and four features are
extracted from the dataset. The authors put forth the problem of using different types of
TABLE 2.1.1: KSD selected features with timing and non-timing information.
CLASSIFIER FEATURE NOTATION TYPE
KSD Neural Network Model
Multilayer Perceptron
Duration DU={DU1,..,DUn}
where each valueDUi=Ui-Di
Timing
Pressure P={P1,...,Pn}
Fornsuccessive characters Non-timing Position L={X=X1,..,Xn},{Y=Y1,...,Yn} Non-timing
Size S={S1,...,Sn} Non-timing
2.1.2
Feasibility study on authentication based keystroke dynamics
over touch-screen devices
Jeanjaitrong and Bhattarakosol presented a review of the literature carried out in the keystroke
dynamics over touch dynamics so far. They also outlined the process of authenticating from
biometric behavior in detail. They summarized how people use mobile devices as part of
their daily life and the security when compromised causes the risk of data getting stolen
high [13]. The authors extracted four features such as dwell time, interval time, interval
timing ratio and the distance between buttons to classify the data. The data collection
pro-cess involves ten users pressing four symbols out of 16 to serve as the granted password.
They also built a Bayesian Network to find the relationship between feature factors and
summarizes them in the classification phase.
2.1.3
Statistical Keystroke Dynamics System on Mobile Devices for
Experimental Data Collection
In 2016, Al-Obaidi conducted experiments to extract features such as pressure, finger area
and sensor readings for the mobile devices since other comparative studies have extracted
features based on desktop keyboards [1]. Based on these features, pressure and finger
area were selected as necessary features to build the statistical distance to-median anomaly
detector. The experiment was carried out on Nexus smartphones to record 56 users and
71 feature elements. The classifier is a maximum mean discrepancy (MMD) model which
classifies above a fixed pass mark specific to their dataset. The author draws the comparison
2. LITERATURE REVIEW
2.1.4
Evaluation of One-Class and Two-Class Classification Algorithms
on Mobile Devices
There has also been some work done by Margit Antal and Laszlo Zsolt Szabo on mobile
device keystroke authentication using one class and two-class classification algorithms.
They applied Bayesian networks and random forest classifiers on the data set to obtain the
EER comparisons for two-class classification [3]. The one-class classification is used for
verifying the user by distinguishing them from outliers, and the two class classification is
used for identifying the user. The authors conclude that the best EER value is obtained
using Random Forest for a data set of 42 users and 71 features and all one class classifiers
are better in classifying negative class than the positive class.
2.1.5
Keystroke dynamics for authentication in smartphones
One of the other research efforts is the work done by Roh and Lee that uses one class
classification techniques; they applied feature selection and classification for each users
posture. The users typing patterns recorded features such as time interval, strength,
po-sition, and usage angle using smartphone sensors. Along with these features, the users
posture characteristics were also collected. The postures were walk, hand, and table [29].
A test population consisting of 15 users were used for building the model with five
ex-tracted features from smartphone sensors. The authors did some pre-processing, scaling
and standardization over their data which yielded good EER values. They proposed a
fea-ture extraction algorithm which includes accelerometer and gyroscope sensor to find the
users keystroke pattern.
2.1.6
Factors affecting keystroke dynamics for verification data
col-lecting and analysis
The ideas presented in the work of Dema Zaidan is to verify the users by collecting data
using HTML-Javascript-self-constructed Web pages [44]. The keystroke dynamics used
a days have been designed such that the touch screens can record keystroke dynamics
pat-tern. Their dataset consists of 71 users with five essential features which were collected
based on machine-dependent characteristics. The author proposes that typing complex and
hard passwords require more features into consideration as compared to typing a simple
password.
2.1.7
Authenticating User Using Keystroke Dynamics and Finger
Pres-sure
In [31], P. Bhattarakosol and H. Saevanee drew attention by obtaining 99% classification
accuracy. The data collection was carried out on a notebook with six female and four male
users as population. The authors extract three features such as inter-key, hold time and
finger pressure to build thek-NN model. The authors conclude that if all three features are
interacting the accuracy obtained is 91% and if inter-key and hold time features are alone
present their accuracy drops to 71%. However, the author concludes that finger pressure
along contributes to the obtained high accuracy scores. The major drawback of this paper
is statistical insignificance as the experiment was carried out with very few users.
2.1.8
The MOBIKEY Keystroke Dynamics Password Database
Giot present a review of the literature carried out in the keystroke dynamics so far. He also
outlines the process of authenticating from biometric behavior in detail [2]. He summarizes
the different types of biometric systems used for authentication such as static and dynamic.
He also explains more about continuous authentication where the system understands how
the user interacts with it. There are different biometric modalities such as the face, iris, hand
veins, fingerprint and keystroke which act as a biometric authentication. The author puts
forth the problem of cross devices which is to use the same device to input the data. Since
in real time, different users can possess various devices comprising different keyboards and
screen coordinates. Thus, the model must be trained in such a way to recognize the users
2. LITERATURE REVIEW
2.1.9
Two novel biometric features for touch screen devices
In 2013, Cheng Jung Tasia conducted experiments to extract features such as pressure and
timing events and concluded that classification depends on these features. He considered
only pressure, size, and button press timing events as features leaving it open for future
researchers to discuss other features which can be responsible for classifying with more
accuracy [39]. The methodology involved in that paper consists of three different phases
such as enrolment phase, classifier building phase, and an authentication phase. During the
classifier building phase, the illegitimate users typing patterns are not constructed by using
a statistical classifier. The keystroke dynamics-based authentication proposed increases the
security by verifying based on the alphanumeric-based and personal identification
number-based schemes. The data collection process involves inputting a pin and not an efficient
passcode and concludes his paper by finding only Equal Error Rate (EER).
2.1.10
Keystroke dynamics as a biometric for authentication
Similar experiments were carried out by Monrose who carried research over few
partici-pants from Bell Communications Lab [22]. In order to overcome the cyber threats such as
network intrusion, malicious attack, and many others, dynamic biometric techniques were
introduced based on the typing pattern of the user. The feature extraction process used is
factor analysis which forms a lower dimensional representation among features based on
correlation and dependence. The feature subset consists of class instances with similar and
dissimilar user typing patterns. He depicts the covariance matrices for various features and
performs classification using k-NN (Nearest Neighbor) classifier. He concludes with the
applications of keystroke dynamics which can be combined with any system to form its
security layer.
2.1.11
Authenticating mobile phone users using keystroke analysis
There has also been some work done by N. L. Clarke on mobile user authentication by using
keystroke dynamics. He applied neural network classifiers on the data set to obtain the EER
important handset interactions such as entering phone numbers and typing text messages.
The author aims at maximizing the security while trying to authenticate the user during
the handset interactions. The neural network layer utilizes a back-propagation perceptron
algorithm to train the classifier and concludes that the performance of the classifier depends
on usage characteristics of the mobile user.
2.1.12
Greyc keystroke
One of the many research efforts is the work done by El-Abed and Rosenberger using
sup-port vector machine techniques, although he applied some conditions during the enrolment
of the users. The users are restricted to five captures during the data collection process,
and he concludes that these operational conditions cause the classifier to outperform. The
test population used the password greyc laboratory for a reason as it was lengthier. The
experimental results are EER and gain values [9]. One shortcoming of this paper is that
password can be easily guessed and does not meet the standards of the universal password
policies.
2.1.13
User authentication through typing biometrics features
The ideas presented in the work of C. F. Araujo and H. R. Sucupira are to generate only
tim-ing latency features and reduce the false rejection and false acceptance rate. They proposed
an adaptive mechanism to create a new template by adding the new samples and ignoring
the old ones [4]. This leads to the modification of standard deviation and thresholds for
each feature and contributes to the concept of two-trial authentication. The biometric
sys-tem records key up, down, and ASCII codes as part of keystroke capturing when a user is
typing on the screen. The existing password authentication mechanism is improved with
2. LITERATURE REVIEW
2.2
Inspiration from the Previous Works
The main inspiration from previous works comes from the size of the datasets and the
number of features that they used in their experiment. The previously mentioned works are
primarily in light of user eccentric methods for connection with input devices and do not
consider any other features, insight, or interest of the users. In any case, research uncovered
that human practices that are firmly ruled by user’s aptitude, knowledge, and interest show
solid individual characteristics too. Thus, we decided to propose a method to deal with
this problem, such that identification of users can be performed effectively by using large
number of features obtained from much larger datasets.
In Chapter 3, we review the proposed method to form a robust authentication system
Proposed method
Machine learning is a field of artificial intelligence which focuses on training the algorithms
to learn and make predictions from the data. The steps involved to solve machine learning
problems are defined
by:-1. Define a problem
2. Prepare the data
3. Evaluate the algorithms
4. Improve the results
5. Present and Interpret the results
FIGURE 3.0.1: The proposed method for user behavioural biometric authentication.
The proposed method for constructing the behavioural biometric authentication system
3. PROPOSED METHOD
the decision-making process while identifying the users as part of authentication. Figure
3.0.1 shows the stages involved in the method are as
follows:-• Data Collection
• Pre-processing
• Feature extraction
• Feature selection
• Classification
• Evaluation
To solve a machine learning problem, the data has to be collected in a suitable format.
Preparing the data is a main task in machine learning. After this, pre-processing has to be
done to normalize and scale the data. The dataset contains the raw data from which the
features have to be extracted. Once the dataset contains the class, the important features
can be selected using feature selection algorithms to run the classifier. In this thesis, the
feature selection algorithm that is used is mRMR and the classifiers used are SVM and
random forest. The classification stage is to classify and identify the users by generating a
model. Finally, evaluation has to be done to know the effectiveness of the algorithm.
3.1
Data Collection
3.1.1
iProfile
iProfile is a Android application to collect keystroke events from Android devices. The app
is available for all Android users freely and can be downloaded on any Android device. The
application registers all up and down events when a user touches any key. We created our
own keyboard and developed a local database that keeps a record of all events as long as
the user is typing. The local database contains all the users typing and device information.
the attributes as column names. The table has all the attribute information as not null
constraints and an auto-increment ID as the primary key. The application asks the user
to type a specific passcode. Once the user is done, the application checks the passcode to
confirm that it is correct. Once the confirmation is done, the application sends all the events
information along with the unique user ID to a cloud database server. The application
allows users to change their user name, the format of the JSON (Javascript Object Notation)
object that is sent to the server and the server URI link. The JSON objects are easy to store
and parse since they are lightweight data-interchangeable and their format is compatible
with many languages. The JSON object which is stored in the cloud server is then sent to
a PHP program which parses the object and stores the data in the local database. The PHP
program contains the attribute information that is present in the JSON object and decodes
them accordingly. After decoding the required data, the program inserts the records into
the database table.
3.1.2
Process involved
The participants in this study were selected by sending invitation emails to different user
groups to participate. The participants must be between 18 and 65 years old. The
partic-ipants can take part in the data collection process only if they possess an Android device.
The interested participants volunteered to download and install the application from Google
Play store. While downloading the app from Play store, the app will ask the user’s
con-sent, and once he or she agrees, the app will be installed on their device. After installing
the app and as soon as they provide their consent to participate in the input process, they
will be redirected to the data collection screen. This process of data collection was carried
out for five days. Each day, the user must type the passcode which appears on the iProfile
app six times. Over five days, 30 passcode-entries will be collected by the application for
each user. The data input process requires less than six minutes to enter the passcode six
times per day. This version of the iProfile app uses the passcode ”.tie5Roanl” because it
combines capital, small letters and numbers. It also forces the user to navigate through
different keyboard layouts by using the shift key or switching to the numbers-keyboard
3. PROPOSED METHOD
one or more servers; it involvesXandY coordinates of the touch location, touch pressure,
touch speed, touch type (up or down), touch time stamp and other time or location data
will be recorded. The location data collected will be dropped while storing it in the local
database. The research is voluntary and if the participant refuses to take part of the study
in the middle of the survey can exit or uninstall the app without any data being collected
or stored. The entire data collection process took about four to six weeks. Even after the
user completes entering the passcode for 30 times over five days, the user can continue
inputting data as much as he or she likes. Participants are free to decline to answer any
particular question if they do not wish to answer it for any reason and their responses are
anonymous. The user’s personal details and sensitive information are never collected from
their device. User’s responses helped us in the data collection process and to improve our
research results, and hence enhanced the mobile authentication system with direct a benefit
to the society.
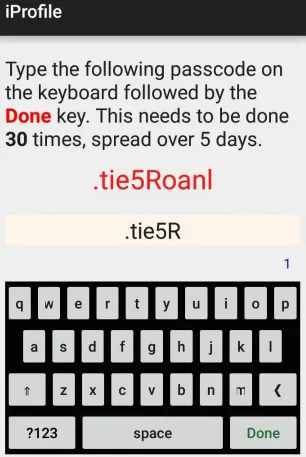
Figure 3.1.1 shows the human-computer interface in the iProfile app which is used to
collect data from the users. It indicates how the passcode is being typed; the number 1 in
the figure denotes the number of completed strokes. It has a counter to keep track of the
completed strokes for the user and a virtual keypad so that the users can enter the passcode
with a common keypad. The password is .tie5Roanl which keeps repeating after submitting
an individual stroke by pressing the Done key. As the user is typing a string, the key up,
down and other attributes are captured to form a static authentication system.
3.2
The Dataset
We describe the dataset used in our experiments. The dataset lists values for all the
at-tributes to represent the behaviour of a user. The data stored in a local database table is
then exported as an Excel file. The database used is Microsoft SQL and has an option to
export the entire table as an Excel sheet. The Excel file contains all the instances for every
user who took part in the data collection process. It is essential to enroll the users and
collect many samples from them to fit the classifier and predict it using the test data. The
3. PROPOSED METHOD
the entire data collection process. Even if the user presses a single button on the
touch-screen, it creates an entry in the database, and he or she is recorded as a user. If the number
of instances/samples are very few for a user, it will automatically be ignored during the
pre-processing process.
TABLE 3.2.1: Dataset description that depicts the information of the collected data.
Dataset Description Values
Number of users 94
Number of valid users 77
Number of attributes 24
Number of extracted features 155
Password .tie5Roanl
Keys . t i e [123] 5 [abc] [Shift] R [Shift] o a n l
Number of samples
per user 40-700
Number of valid instances 30
Number of sessions at least five per user
Devices 53
The dataset has 94 users who participated in the data collection process; out of which,
only 77 users are valid after performing pre-processing. The users with instances less than
thirty are dropped and not included in the experiment. The raw data has 24 attributes which
are helpful to identify a user. After the feature extraction process, 155 features are obtained.
The instances are recorded while typing the password that appears on the screen. The user
has to open the app and enter the password every day. The sessions can be any number of
times, but it is essential that the user logs in at least five times to enter the password spread
over five days.
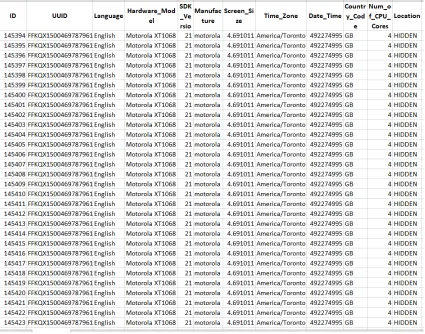
The Excel file contains the dataset for all users with attributes such as ID, Unique User
Identification (UUID), language, hardware model, SDK version, manufacture, screen size,
time zone, date time, country code, number of CPU cores, country location, location
lat-itude, location longlat-itude, button, touch pressure, touch size, X coordinate, Y coordinate,
X precision, Y precision, action type, action time stamp and HR time stamp. The dataset
is split into two images as illustrated in the Figures 3.2.1 and 3.2.2 to represent all of the
attributes.
following:-FIGURE 3.2.1: The dataset showing first half of the collected data for a single user.
• touch pressure is defined as how hard the user presses the button
• touch size is the size of the touching key
• Xand Y coordinates describes the position with respect toXandYaxes
• XandYprecision describes the stroke corresponding to the screen size
• button pressed denotes which key a user is pressing while entering the password
• location data represents the latitude and longitude information collected
• device information contains hardware model, operating system version,
manufac-turer details, time zone of the user, screen size, language which the user selected, and
3. PROPOSED METHOD
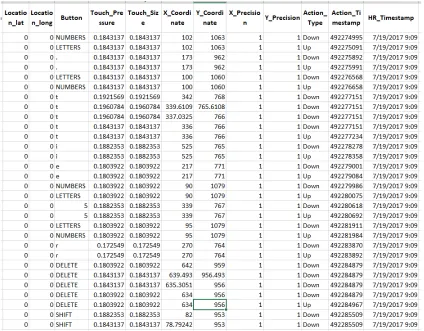
FIGURE 3.2.2: The dataset showing the last half of the collected data for a single user.
• action type denotes where it is an up/down event, and records action and HR
times-tamps
• The data stored on the server has an encrypted user id to make the username
anony-mous.
The device attributes contain various device details since the users used their device to
input the data during the data collection process. The device attributes contain 53 devices
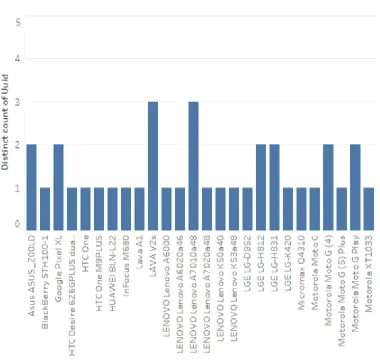
which were used by different users all over the world. Figure 3.2.3 shows some of the
devices used in the experiments and the distinctive count for every user. We can also infer
FIGURE 3.2.3: Various devices used in the data collection process.
3.3
Feature Extraction
To represent the data well, the data needs to be transformed to form the features. The raw
data contains the attribute information out of which the features have to be formed to
rep-resent the distinctive properties of the input patterns. It derives new features to distinguish
the differences among the users and to increase the classification metrics. The mode to
3. PROPOSED METHOD
3.3.1
Pre-processing
The raw data needs to be filtered, scaled and normalized before passing it into the classifier.
Pre-processing makes the data more understandable. The pre-processing script is run on
the entire raw data to extract the required features. The pre-processing steps are as follows:
i The entire data is loaded and sorted based on the unique User IDs (UUID) and action
timestamps after removing the duplicate timestamps from the same user.
ii Exclude the instances below a certain threshold if the frequency count is less than 2
attempts (32 counts are 1 attempt).
iii Delete the location data, such as latitude and longitude information if present. The
features are extracted based on the derivatives and averages of the raw data.
iv Find the records for touch events based on Button pressed and Action Type inclusive of
Backspace touch events. While entering the passcode, the user tends to make mistakes.
If the mistake is repeated mostly for a user, then it is the typing pattern for that user. The
mistake is taken into consideration while calculating the correct touch event instances
for a user. After all these filters, 77 users were obtained from a refined set of 94 users.
v Generate the features from the raw data attributes for every button pressed and action
type events. The features for X and Y coordinates are formed from the distance formula
1 as it corresponds to the distance from the screen for all keystrokes of letters. The
features from X and Y precisions are added to generate new features for every letter
in the passcode. The timestamps for the letters are formed from the derivatives. The
touch pressure and size of every letter corresponds to an individual feature.
Pre-processing the raw data generated 155 features for 77 users.
As illustrated in Figure 3.3.1, the first row contians the device-specific features.
At-tributes such as pressure and size are expanded to form 16 features each for various Down
action type (press) events.
• The features starting with ’p’ denote the touch pressure of the user while typing the
FIGURE 3.3.1: Extracted features from the raw data after pre-processing step.
• The features starting with ’a’ denote the touch area of the device.
• The features starting with ’xyc’ denote the distance between X and Y coordinates for
various button press and Down action type events (16):
q
X2
coordinate+Ycoordinate2 , (1)
whereY is the target.
• The features starting with ’xyp’ define the addition ofX and Y precision values for
various button press and Down action type events (16):
XP recisionDown+Y P recisionDown, (2)
whereY is the target.
• The timestamp differences for the button presses and various combinations of action
type events form features starting with du(16), ud(15), dd(15), uu(15) and du2 (15):
3. PROPOSED METHOD
whereY is the target.
• The features starting with ’du’ represent the dwell time for down up movements,
starting with ’ud’ denote the flight time for up down movements, starting with ’dd’
denote the flight time for down down movements, starting with ’uu’ denote the flight
time for up up movements, and starting with ’du2’ denote the flight time for di-graph
down up movements by a user.
• Finally, the average of down/up, up/down, down/down, up/up movements, touch
pressure, touch size, features forms a set of new features for the corresponding button
events.
• The class is the UUID which is encrypted to make the username anonymous.
Table 3.3.1 shows the different feature types, definition, and their number present in the
dataset after pre-processing. From the raw data, 155 features are formed through
computa-tion of the attributes. The keystroke measure includes digraph which denotes consecutive
key types and the latency which denotes the time interval between two key types [15].
The action type denotes whether it is an Up or Down press [13, 2]. This leads to various
latencies such as:
• Down-Up (du): time interval between press and release of a key
• Up-Down (ud): time interval between release and press of a key
• Down-Down (dd): time interval between presses of two consecutive keys
• Up-Up (uu): time interval between releases of two consecutive keys
The features are formed based on the passcode button presses and the action type associated
with it for these various latencies, touch pressure, size, X and Y coordinates and action
timestamps.
TABLE 3.3.1: 155 features extracted from raw data based on touch events for 77 users.
N Feature-Type Definition Number of features
1 Down-up Dwell time 16
2 Up-down Flight time 15
3 Down-Down Flight time 15
4 Up-Up Flight time 15
5 Down-up (2-graph) Flight time 15
6 Pressure Touch pressure 16
7 Size Touch area 16
8 X-Y P X-Y precision 16
9 X-Y C X-Y coordinates 16
10 Averages for timing features Average UD, DD, DU, UU, 2-graph 5 11 Average pressure Average pressure for all keys 1
12 Average size Average area for all keys 1
13 Device specific features Screen size, hardware information 8
Total 155
3.4
Feature Selection
Feature selection or variable selection or attribute selection is used to select the most
use-ful or relevant features which can be used to build the classification model. By ignoring
irrelevant features, the data is reduced, thus, reducing the runtime to run the model. It
also increases the performance metrics by running the classifier on the essential features.
Feature selection may help boost the performance and may aim to reduce the classification
errors. It selects a portion of the extracted features to apply the classification algorithm.
There are three major types of feature selection
algorithms:-• Filter methods
• Wrapper methods
• Embedded methods
3.4.1
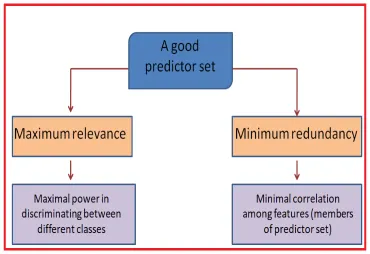
Minimum Redundancy Maximum Relevance approach
The Minimum Redundancy Maximum Relevance (mRMR) approach selects the features
that correlate very strongly with the classification variable. It can use sequential forward,
3. PROPOSED METHOD
efficiently are selected based on mutual information with the criteria of min-redundancy,
and max-relevance among the features by searching through the subspace of the extracted
features. This is a wrapper-based feature selection algorithm to maximize the conditional
likelihood of the iterations based on the testing/validation accuracy [26].
FIGURE 3.4.1: Description of the mRMR feature selection algorithm.
We also show that mRMR used as a wrapper approach produces a compact subset of
features from the large number of features which mainly contributes to better classification
at a lower computational expense. The feature set can be optimized by first picking the
best features and then building the classifier to use them. In mRMR, the forward feature
selection step, which is a sequential search method is used to consider the features one by
one for addition or removal to the optimized feature set. The selection heuristic approach in
this mRMR algorithm follows a greedy iterative maximization technique, where it does not
add another feature if the mutual information is zero but adds features that produce large
conditional likelihood. The mutual information for two variables of the data set is given
by:
I(x, y) =
Z Z
p(x, y)log p(x, y)
p(x)p(y)dxdy, (4)
between them. The features that have the most significant relevance have the most
sub-stantial mutual information and denotes that this feature depends more on the target class;
However, the features that are dependent on each other and are redundant are not the best
features that contribute to the classification task.
Table 3.4.1 describes the data set in terms of instances and features after the feature
extraction process. The total number of users after pre-processing are 77. These are the
users who typed every passcode correctly and submitted it after completing a single
pass-code in the Android interface. Every user has 10 correct instances, which leads to 770
instances that are used for classification. The pre-processing script forms the features that
contribute to 155 features. Among these, 146 are numerical features, and the rest 9 are
cat-egorical features. The catcat-egorical features contain string representations of the input data.
These categorical features are converted into numerical features by using label encoding
approach. All the features are then normalized and scaled before the wrapper based model
selects a good number of features. Using mRMR, 36 features are selected to yield better
classification results.
TABLE 3.4.1: Dataset description in terms of features and instances.
Total Instances Number of Features Numerical Features Categorical Features Selected Features
770 155 146 9 36
The 36 selected features include avga, avgp, al15,a58, aSH10, aDO16, aLN1, aLN9,
xyc.2, xycLN1, xycr11, xycn14, xycyLN3, xycl15, xycLN9, xycDO16, xyca13, xypLN1,
xypLN3, xypLN9, xypSH10, xyp58, xypl15, ud.2, uuLN1, udLN3, duLN1, du2LN1,
ddSH10, ddLN1, Hardware model, manufacture, timezone, country code, number of CPU
cores and screen size. These are the features that are responsible for classifying and
authen-ticating the users. We noticed that features such as average pressure, average size, device
specific features, latency features such as du, ud, dd, uu, du2, pressure, and size for
partic-ular button presses play a vital role to classify the users and to reduce the false acception
or false rejection rate. These selected features give high classification performance when
3. PROPOSED METHOD
3.5
Methods
In this chapter, the classification algorithms that were applied on different experiments
are explained. The classifiers discussed in this chapter are SVM-linear, SVM-RBF (grid
search optimization), and random forest. The experiments conducted on the dataset are
also discussed.
3.5.1
Classification
Classification is the process of approximating a mapping function to map input variables to
output variables. The mapping function is called the model which predicts the class for the
given set of data. The classifier can classify the data points into one or two or more classes
provided the input variables are real-valued or discrete. The different types of classification
problem
are-• One class classification
• Binary class classification
• Multi-class classification
• Multi-label classification
Classification algorithms have many parameters that have to be set based on the problem.
Python scikit library offers the classification algorithms which can be tailored according to
our problem [25]. For our dataset, we use multi-class classification approach to classify the
instances using various classifiers.
The block diagram in Figure 3.5.1 depicts how a user enrolls himself through inputting
data via his or her Android device. This legitimate user types the password .tie5Roanl
which is considered as a strong password by database administrators. These typing events
are stored as instances of the user behavior leading to data acquisition phase. The raw data
needs to be pre-processed by scaling and normalizing the attributes from which the features
can be extracted. The features are generated by applying computational logic from the