Contents lists available at Science-Gate
International Journal of Advanced and Applied Sciences
Journal homepage: http://www.science-gate.com/IJAAS.html117
Temperature control method optimization with global criterion genetic
algorithm in thermal vacuum chamber for satellite testing
Nor’asnilawati Salleh1, Salwani Mohd Daud2, *, Sharizal Fadlie Sabri1, Nur Syazarin Natasha Abd Aziz2
1Space System Operational and Development Division, National Space Agency of Malaysia, Selangor, Malaysia 2Advanced Informatics School, Universiti Teknologi Malaysia, Kuala Lumpur, Malaysia
A R T I C L E I N F O A B S T R A C T Article history:
Received 9 July 2017 Received in revised form 25 September 2017 Accepted 5 October 2017
The proportional integral derivative (PID) controller that is adopted in the temperature control system of thermal vacuum chamber (TVC) is manually tuned has caused the temperature profile required more time to stabilize and fluctuate during satellite testing. Thus, other method is required to do the tuning of the PID controller. An optimization algorithm is an alternative method that can be applied to do the PID tuning and an optimized system can be developed. In this study, the optimization algorithm that is able to do the PID tuning for temperature control system is investigated in order to be implemented in the TVC’s temperature control system. The genetic algorithm (GA) is found to be the suitable method that can be implemented as it is able to optimize the settling time and overshoot very quickly in temperature control system compared to other methods. However, due to more than one objective aimed in this study, the global criterion genetic algorithm (GCGA), a multi objective genetic algorithm (MOGA) method become the best approach to be chosen. Two models were designed using PID controller and GCGA-PID controller for the TVC’s temperature control system. Simulation testing is done and the settling time and overshoot value are measured to compare both models. Analysis suggests that the optimization tuning by using GCGA method improves the settling time 30% better than using the PID controller alone. Meanwhile, in terms of overshoot, the performance is increased by almost 99.85%. By applying the optimization algorithm, the TVC’s temperature control method can be enhanced during satellite testing compare to the current manually implementation.
Keywords:
Thermal vacuum chamber Temperature control PID
Global criterion genetic algorithm
© 2017 The Authors. Published by IASE. This is an open access article under the CC BY-NC-ND license (http://creativecommons.org/licenses/by-nc-nd/4.0/).
1. Introduction
*The thermal vacuum chamber (TVC) is satellite
test equipment used to simulate the space environment that will be experienced by the satellite in the orbit. During testing, the TVC will be heated up or cooled down depending on the satellite's temperature profile. Proportional integral derivative (PID) controller is used to control the temperature inside the TVC. However, the temperature profile is found to be fluctuated before it reaches the required temperature set point. Due to that, more time is needed in order to stabilise the temperature. This happened because the PID parameters are not properly tuned and some time is needed by the controller in order to understand the behaviour of
*Corresponding Author.
Email Address: [email protected] (S. M. Daud)
https://doi.org/10.21833/ijaas.2017.012.022
2313-626X/© 2017 The Authors. Published by IASE. This is an open access article under the CC BY-NC-ND license (http://creativecommons.org/licenses/by-nc-nd/4.0/)
the TVC. In this study, an optimization algorithm that is able to minimize the settling time for temperature stabilization and reduce fluctuation is proposed. A simulation and analysis is done to determine if the algorithm is feasible to be implemented. This paper explained on how the study conducted and the results obtained are discussed. Finally, the results of this study are concluded.
2. Problem statement and preliminaries
The operational framework is used to guide the study. It consists of three (3) phases which are Investigation; Modelling and Design; and Evaluation.
2.1. Investigation
118
this study, there are a few objectives that need to be achieved. Therefore, the Global Criterion Genetic Algorithm (GCGA), one of the Multi Objective Genetic Algorithm (MOGA) methods has been chosen.
2.2. Modeling and design
This phase aims to identify the TVC plant model and design a simulation model for temperature control system of the TVC. The simulation model is used because it may risk the TVC system if the actual system is used. Two (2) simulation models are designed in this study namely the PID controller and GCGA-PID controller. The PID controller simulation model is designed based on the algorithm given in the following equation (Stuart, 1994) (Eq. 1).
cv(t) = Kpe (t) + Ki∫ e(t)dt + Kd de(t)
dt (1)
where by, cv and e represent the control variable and the control error. While, Kp, Ki and Kd are the
parameters gain namely as proportional gain, integral gain and derivative gain. The appropriate parameter settings will improve the system dynamic response such as reducing overshoot, eliminating the steady-state error and improve settling time and also improve the system stability (Saad et al., 2012). Fig. 1 shows the PID controller simulation model for TVC System.
C(s) G(s)
PID Controller TVC Plant
r + e cv y
-Temperature Set Point Output
Fig. 1: PID controller simulation model for TVC’s temperature control system
Once the temperature set point is requested into the system, the control error, e is computed. The result from this computation is used to generate the PID parameters. Thus, this will produce the control variable, cv, which will be applied into the G(s), TVC plant model and new output signal will be obtained. Again, the control error, e, will be computed and it will be continuously processed until a steady state output signal or the temperature set point required is achieved.
Besides that, the PID parameters can also be determined by the operators based on their experience and knowledge on the process (Loh and Teo, 2009). This method had also been applied in the TVC.
Then, the GCGA-PID controller simulation model is designed to allow the parameters gain of the PID controller to be optimized using GCGA. In this study, there are two (2) main objectives that need to be achieved which are minimizing the settling time and overshoot. However, in order to achieve these main objectives which are to enhance the temperature control method of TVC, the error signal needs to be reduced. Besides that, the vacuum element also needs to be considered as the TVC system is a vacuum application system.
2.3. Evaluation
In this phase, the results from both simulation models are compared. After that, analysis of the results is done through a simulation model that is developed using MATLAB® SIMULINK®. A few tests were done by using different sets of data input in order to ensure the validity of the tests.
3. Global criterion genetic algorithm (GCGA)
In GCGA, the process flow is similar to the basis of GA. Whereby; firstly, the population is randomly initialized. Once the population is initialized, the evaluation is done. The difference between GCGA and the GA is only in how the evaluation is carried out.
In the evaluation phase of GCGA, a complete response of the system for each PID parameter set is acquired. Then, the fitness value for each chromosome or PID parameter set is computed by using the defined objective function. For this study, there are four (4) objective functions taken into account which are minimizing settling time (ts),
overshoot (os), integrated time weighted absolute
error (ITAE) and vacuum element (P). Due to the closed loop system, the evaluation is done through the simulation responses. The ts and os are evaluated
from the output (y) response. The ts value is defined
as the minimum time where the y settles in its desired position, while, os value is the minimum
value of y response. The following shows the objective function for ts and os evaluation (Eq. 2).
𝑓1𝑓2= 𝑚𝑖𝑛 (𝑡𝑠, 𝑜𝑠) (2)
Meanwhile, ITAE is evaluated as the following objective function; where T is the simulation period and N is the number of samples (Eq. 3).
𝑓3= ∑ 𝑦(𝑡).𝑡𝑇
𝑡
𝑁 (3)
For the vacuum element, the objective function is given based on the current vacuum level of TVC. In this study, the vacuum value that had been used is 1x10⁻⁵ mbar. Therefore, f4 is defined as Eq. 4.
𝑓4= 10−5 (4)
Then, this multi objective function will be evaluated based on two (2) different types of fitness assignment which are global criterion ranking procedure and popular non-dominated sorting procedure. The global criterion ranking procedure is used to rank the chromosome’s fitness based on the summation of the ranks of each objective. The global criterion ranking value, G for the chromosome xi is
given as Eq. 5:
𝐺𝑥𝑖= ∑𝑀𝑗=1𝑟𝑖, 𝑗 (5)
where M is the number of objectives and ri is the
rank of xi in the jth objective. For example, there are
119
value for four objectives (f1, f2, f3 and f4). Let’s say, for
the first objective, f1, x3 has the smallest objective
value, followed by x1 and x2. Therefore, r1(x3) =1,
r1(x1) = 2 and r1(x2) =3. This process will also be
implemented for other objectives f2, f3 and f4. Lastly,
the global criterion rank value, G is calculated by summing all of its sub-rank values as shown in Table 1. Then, the global criterion rank for all chromosomes is used in the binary tournament selection process that will be described later.
Table 1: Global criterion rank example
Chr Objective Sub-Rank
Global Rank, G f1 f2 f3 f4 r1 r2 r3 r4
x1 363 6.5 0.0681 10-5 2 3 1 3 9 x2 546 4.1 0.0788 10-6 3 1 2 2 8
x3 353 4.5 0.099 10-7 1 2 3 1 7
*Chr: Chromosome
The popular non-dominated sorting procedure is used to ensure the pareto concept can be incorporated into the GCGA process. The concept of Pareto is used in order to assign scalar fitness values to individuals. It performs clustering to reduce the number of non-dominated solutions stored. The solutions from resulted pareto gives flexibility in order to analyse a suitable PID parameters. Moreover, the guarantee of closed-loop stability in the presented parameters gives reliability property of tuning in GCGA. Meanwhile, the crowding distance is also used as the second separation procedure in the mechanism of elitism. In addition, other diversity preservation techniques such as K-Nearest Neighbours (K-NN) also had been used as it is able to estimate the density of the solution when the non-dominated solution that combines the current population and offspring exceeds the size of population (Rahairi, 2012). In the selection process, each chromosome is evaluated based on their fitness value. In this study, the binary tournament selection is chosen as the method of the selection. This is because it offers a better selection strategy. Whereby, it is able to adjust its selective pressure and population diversity to improve searching performance compared to other methods such as roulette selection which allows weaker chromosomes to be selected frequently (Stuart, 1994). In binary tournament selection, two chromosomes are randomly picked from the current population. Then, the fitness value between these two chromosomes is compared. One of it is chosen in term of ranking and included in the pool. This process is repeated continuously until it is completed. However, if the fitness value is similar, the crowding distance technique will be used.
Once the selection process is done, the crossover process will be preceded. In this study, simulated binary crossover (SBX) will be used. SBX will produce two offsprings (c1 and c2) by recombining
two parents (p1 and p2) as Eq. 6.
𝑐1=12[(1 − 𝐵)𝑝1+ (1 + 𝐵)𝑝2]
𝑐2=12[(1 + 𝐵)𝑝1+ (1 − 𝐵)𝑝2] (6)
where, the value of spread factor for the gene, B is computed based on Eq. 7.
𝐵 = { (2𝑢)
1
𝑛𝑐+1, 𝑢 ≤ 0.5
(2(1−𝑢)1
1
𝑛𝑐+1, 𝑢 > 0.5 (7)
The value of u is randomly generated between ‘0’ to ‘1’. However, not every parent chosen from the selection will go through the crossover operation, unless the crossover probability is ‘1’. Therefore, the decision whether the two chromosomes need to crossover or not depends on the crossover probability and user defined crossover distribution, nc (Rahairi, 2012).
The mutation is used to avoid premature convergence in searching process. In order to keep the diversity in the population, allele is changed. The mutation process prevents the solution from being trapped in local minima and maintains diversity in the population (Saad et al., 2012). However, the probability of mutation needs to be low to prevent the loss of fit solutions and affect the convergence of solutions (Loh and Teo, 2009). In this study, the polynomial mutation is used.
The polynomial mutation changes the chromosome value based on the defined mutation index, nm as shown in the Eq. 8:
𝛿̅𝑖= {
(2𝑟𝑛)
1
𝑛𝑚+1− 1, 𝑢 ≤ 0.5
1 − [2(1 − 𝑟𝑛)]
1
(𝑛𝑚+1), 𝑢 > 0.5
(7)
where, rn is a random number (0 or 1). Meanwhile, nm is usually chosen in the range between 20 and
100 (Deb, 2012). Then, the mutated offspring, mo is produced after the product of crossover operation of chromosome, xi as Eq. 9:
𝑚𝑜𝑖= 𝑥𝑖+ (𝑥𝑖𝑈− 𝑥𝑖𝐿)𝛿̅𝑖 (8)
where, 𝑥𝑖𝑈 and 𝑥𝑖𝐿 are the upper and lower bound of
the chromosome, xi. Similar with crossover
operation, the mutation operation will only be done if the value of mutation probability, pμ is ‘1’. A new set of PID parameters is sent to the PID controller to be computed for a new fitness value. This process will be repeated until the objective function is achieved or the end of generation process.
120
population. Meanwhile, K-NN is non-parametric algorithm which does not make any assumptions on the underlying data distribution. It’s memorized training data and use information as the basis nearest neighbour contribution. It will estimate the solution’s density when the number of non-dominated solutions in the combined current population and off spring exceeds the population size.
The crowding distance calculation requires the sorting of the population according to the ascending order of each objective. Consider a population of N individuals with M objective values. The smallest and largest values (boundaries) will be assigned as an infinite distance value. For other intermediate individuals, the distance of each objective, di, is
calculated based on Eq. 10.
𝑑𝑖= ∑ √∑ (
𝑓𝑖𝑚−𝑓𝑗𝑛𝑒𝑎𝑟𝑚
𝑓𝑚𝑎𝑥𝑚−𝑓𝑚𝑖𝑛𝑚) 2 𝑀
𝑚=1 𝑘
𝑗 =1 (10)
where, fi is the objective value for individual i, fnear is
the objective value for nearest neighbours and fmax
and fmin are the values of maximum and minimum
objective values respectively. In addition, k is calculated based on Eq. 11.
𝑘 = 𝑟𝑜𝑢𝑛𝑑 ‖√2𝑃𝑜𝑝∗‖ (11)
where, Pop* is the number of non-dominated
individuals in the combination of current and new population generated. The larger the value of the crowding distance, the smaller (better) its crowdedness property. As described previously, the survivors from the combination population that is generated from the genetic operation (SBX and polynomial mutation) are decided by the non-dominated sorting, the crowding distance and K-NN techniques.
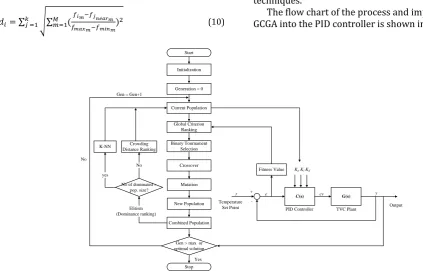
The flow chart of the process and implementation GCGA into the PID controller is shown in Fig. 2.
Start
Generation = 0
Crossover
Mutation
New Population
Combined Population
Gen > max or optimal solution
Stop Yes No
C(s) G(s)
PID Controller TVC Plant
r + e cv y
-Temperature
Set Point Output
Fitness Value Kp Ki Kd
Initialization
Gen = Gen+1
Current Population
Global Criterion Ranking
Binary Tournament Selection
No of dominated > pop. size?
Elitism (Dominance ranking) K-NN
yes
Crowding Distance Ranking
No
Fig. 2: GCGA-PID controller tuning flowchart
4. Modelling and design
In order to establish a mathematical model or plant model for the TVC, the thermal vacuum chamber dynamic model equation is investigated. There are different types of heat transfer that need to be considered for the temperature control system of the TVC such as convection, conduction and radiation (Robert, 2012). However, in this study, only radiation heat transfer will be considered in the TVC plant model. This is due to the low pressure inside the TVC system; there is no convection heat transfer that needs to be measured (Nadia and Luiza, 2007). Besides that, if the conduction heat transfer is measured, the value results are also very small and can be omitted (Robert, 2012). Meanwhile, the conduction heat transfer is negligible because there is no direct contact between the shroud and vessel that will be figured out in this study. Therefore, the
radiation heat transfer can be calculated using Eq. 11.
𝑄𝑖𝑟𝑟= 𝜎 × 𝜀 × 𝐴 × 𝑇𝑠ℎ4 (11)
where, σ is the Stephan Boltzman’s natural constant, 5.670373x10⁻⁸, Ɛ is the emissivity of a grey body, A is
the radiating area and Tsh is shroud’s temperature. Table 2 shows the parameter used in this study in order to calculate the radiation heat transfer, Qirr.
Table 2: Parameter for radiation heat transfer calculation
Parameter Value
σ 5.670373 x10⁻⁸Wm-2K-4
Ɛ 0.360 – 0.440 (Stainless Steel 304)
A 2πrh+2πr2 = 201.06m2
Tsh 27.55˚C
121 𝐺(𝑠) = 𝜃𝑜
𝜃𝑖(𝑠) =
1
(𝑇𝑠+1) (9)
where 𝑑𝑄𝑑𝑡⃗ ̅ is a heat transfer rate and 𝑇⃗ is the
temperature vector.
4.1. Thermal plant model
A simple thermal model has a transfer function as follows. Where, θo is the temperature output of the
system, θi is the set point temperature and Ts is the
sampling time or the time constant for the model (Eq. 13).
𝐺(𝑠) = 𝜃𝑜
𝜃𝑖(𝑠) =
1
(𝑇𝑠+1) (10)
Based on that, the plant measurement and assumption for the TVC can be modelled by the following transfer function (Eq. 14) (Stuart, 1994).
𝐺(𝑠) = 𝑘𝑒−𝐿𝑠
(1+𝑠𝑇𝑝) (11)
4.2. System dynamic
The system dynamic for temperature control system of the TVC is formulated based on previous equations and results as Eq. 15.
∆𝑇 = 𝑄𝑠ℎ+ 𝑑𝑄⃗ ̅
𝑑𝑡 (15)
where ΔT is temperature output for the TVC system, Qsh is shroud current heat and 𝑑𝑄⃗ ̅
𝑑𝑡 is the heat rate.
Meanwhile, the transfer functions or plant model for the TVC can be described as Eq. 16.
𝐺(𝑠) =𝑘𝑒−1800
(1+5𝑠) (16)
where the sampling time for the TVC is 5 seconds and delay is 1800s. Meanwhile, the transfer function of the PID controller is described as Eq. 17.
𝐺𝑐(𝑠) = 𝐾𝑝(1 + 1
𝐾𝑖𝑠+ 𝐾𝑑𝑠) (12)
5. System design
As mentioned in previous section, two (2) simulation models are designed in order to analyse the implementation of GCGA in TVC’s temperature control system. The first model is called PID controller which represents the current system and the second model is called GCGA-PID controller that represents the new approach of TVC’s temperature control system.
5.1. PID controller simulation model
The PID controller simulation model for the TVC’s temperature control system is designed using MATLAB® SIMULINK®. In order to achieve the
requested set point, the automatic PID tuner is used
to identify the PID parameter gain which is Kp, Ki and
Kd. Fig. 3 shows the PID controller simulation model
that is designed for this study.
Fig. 3: PID controller simulation model for TVC’s temperature control system
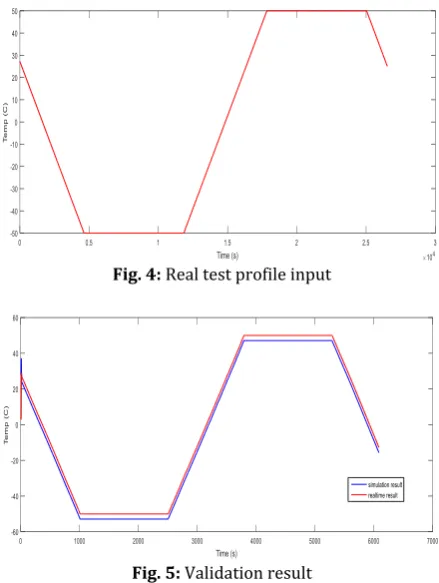
This PID controller simulation model for TVC’s temperature control system then needs to be verified before the GCGA-PID controller simulation model for TVC’s temperature control system can be designed. In order to do that, the simulated result is compared with the real measurements to ensure that the derived mathematical model describes the actual system behaviour (Robert, 2012). Therefore, the real time data that is gathered from the TVC which is the test profile input value is used to validate the simulation model as shown in Fig. 4.
From that, the validation is done by comparing the test profile output from the simulation with the real output test results. The comparison results are shown in Fig. 5.
Fig. 4: Real test profile input
Fig. 5: Validation result
122
valid and can be used in this study. Once the validation process is done, the GCGA-PID controller simulation model for the TVC’s temperature control system is designed.
5.2. GCGA-PID controller simulation model
The GCGA-PID controller simulation model for TVC’s temperature control system is also designed using MATLAB® SIMULINK®. The designs for both
models are similar but the different element in this model is that the PID parameter will be tuned using an optimization algorithm. The PID parameter gain (Kp, Ki and Kd) is identified using GCGA, a
multi-objective genetic algorithm method. Fig. 6 illustrates the GCGA-PID controller simulation model for TVC’s temperature control system.
Kp Ki Kd
GCGA
Fig. 6: GCGA- PID controller simulation model for TVC’s temperature control system
In addition, Table 3 illustrates the setting parameters for GCGA-PID that was used in this study in order to optimize the parameters gains of the PID controller.
The size of population is set to 100 in order to give a better choice for the optimal value (Mirzal et al., 2012). The crossover probability is set to 0.8 as it is able to provide good chromosomes (Rahairi, 2012). The mutation probability is set to 0.3333 for three (3) variables that represents the PID parameter. Lastly, the distribution index in SBX and polynomial mutation is set to 20 (Deb, 2012). Meanwhile, the variable bounds of the chromosomes are set based on the PID parameter generated by PID tuner in order to reduce the GCGA’s processing time and it is randomly generated. These PID parameter is the chromosomes value in the population.
In this study, simulation testing is used to predict how the temperature control system of the TVC will behave varying different testing parameters without risking the actual TVC system. The simulation testing result can then be evaluated based on model performance value (Murray-Smith, 2015).
6. Simulation and analysis
In order to see whether the GCGA implementation is able to improve and enhance the current TVC’s temperature control system, the thermal vacuum test is simulated in the TVC’s temperature control system simulation model. It consists of two (2) conditions namely hot case and cold case. These conditions are the extreme temperatures that need to be experienced by the satellite based on their requirements. The testing parameters that were used in this study are summarized in Table 4.
Table 3: Parameters of GCGA-PID controller
Parameters Values
Population size 100
Probability of crossover 0.8 Probability of mutation 0.3333 Distribution index in SBX 20 Distribution in polynomial mutation 20
Variable Bounds (Chromosome) PID KKpi [0, 2] [0, 2]
Kd [0, 2]
Table 4: Testing parameters
Parameter
Thermal Vacuum Test Condition Device Under Test
(DUT) Case Hot Cold Case Set Point
Temperature (˚C)
Satellite A +50 -50
Satellite B +60 -20
Satellite C +80 -80
Simulation Time (s) 14400
These testing parameters are collected based on real testing data parameters used for satellite thermal vacuum tests conducted by using TVC. Two (2) methods have been used which are automatic tuning and optimization tuning method. These methods are then compared in order to evaluate the results obtained. A series of tests had also been done in order to ensure the consistency of the results.
6.1. PID controller simulation model
The PID controller simulation model for TVC’s temperature control system is tuned automatically by using PID Tuner that is available in the MATLAB® SIMULINK® software. MATLAB® had claimed that this PID Tuner is able to find the set of PID parameter gains that is able to ensure the best performance of the control system. Therefore, by using this method, the parameters gain values are shown in Table 5.
Table 5: Control parameters in PID controller
Gains Values
Kp 0.0144066011574205
Ki 0.000298033586309446
Kd 0
6.2. GCGA-PID controller simulation model
Meanwhile, the GCGA-PID Controller Simulation Model for TVC’s temperature control system is tuned by using optimization method through the GCGA method. In order to get the best PID parameter gains, the tests have been run at least 5 times. From these tests, a few set of optimized PID parameter gains are generated as shown in Table 6.
Table 6: PID parameters gains Paramete
r Gains Kp Ki Kd ts (s) os (%)
Set 1 0.1351 2.9145e-04 0 381.5218 0.0088 Set 2 0.1711 2.9625e-04 0 423.7918 0.0094 Set 3 0.2297 3.2978e-04 0 390.2219 0.0095 Set 4 0.1654 2.9910e-04 0 404.3177 0.0012 Set 5 0.0169 2.2856e-04 0 489.1517 0.0024
123
TVC’s temperature control system as shown in Table 7. This PID parameter set was chosen because the settling time, ts value is the lowest and its overshoot,
os value is considered very low. Although, os value is
not the lowest, this value is much lower compared to the PID tuner results.
Table 7: Control parameters in GCGA-PID controller Gains Values
𝐾𝑝 0.1351
𝐾𝑖 2.9145e-04
𝐾𝑑 0
The following explains the performance results based on three (3) parameter test profiles for Satellite A, B and C that have been simulated in the TVC’s temperature control system simulation model by using PID controller and GCGA-PID controller. Then, based on the response results obtained, the settling time and overshoot value is measured in order to evaluate the performance of each model.
Fig. 7 and Fig. 8 show the performance results for Satellite A for both cases.
From the results, the TVC’s temperature control system shows better performance in terms of settling time and overshoots when using GCGA-PID controller compared to PID controller.
Secondly, the test profile parameter of Satellite B is used for simulation testing. Similar with Satellite A, once the response results is obtained; the settling time and overshoot value are measured and Fig. 9
and Fig. 10 show the performance results for Satellite B for both cases.
Based on the results, the TVC’s temperature control system shows better performance when using GCGA-PID controller compared to PID controller.
Fig. 7: Performance results: Satellite A (Hot Case: +50 ˚C)
Fig. 8: Performance results: Satellite A (Hot Case: -50 ˚C)
Fig. 9: Performance results: Satellite B (Hot Case: +60 ˚C)
Fig. 10: Performance results: Satellite B (Cold Case: -20˚C)
Finally, the simulation testing used the test profile of Satellite C and same as the previous testing that had been faced by Satellite A and B, once the response results are obtained, the settling time and overshoot value is measured in order to evaluate the performance of PID controller simulation model and GCGA-PID simulation model. Fig. 11 and Fig. 12 show the performance results for Satellite C for both cases.
Fig. 11: Performance results: Satellite C (Hot Case: +80 ˚C)
Based on the results, it also proved that when using GCGA-PID controller, the performance is better compared to PID controller.
Fig. 12: Performance results: Satellite C (Cold Case: -80˚C)
7. Discussion
From the comparison done, it shows that the TVC’s temperature control system can perform better when using GCGA-PID controller compared to PID controller. This is because the settling time, ts
and overshoot, os for GCGA-PID controller simulation
model resulted in a lower value compared to the PID controller simulation model for all tests that have been done. Table 8 summarizes all the results obtained.
Table 8: Result summary
DUT Condition Test PID Controller GCGA-PID Controller ts (s) os (%) ts (s) os (%)
Sat
A Cold Case Hot Case 551.7627 5.8331 551.3414 5.8344 381.5218 382.8271 0.0088 0.0014 Sat
B Cold Case Hot Case 551.7723 5.8330 551.7207 5.8328 381.5371 380.6192 0.0000 0.0071 Sat
C Cold Case Hot Case 551.7844 5.8329 551.4027 5.8328 381.5634 382.6099 0.0008 0.0065
124
better than using the PID controller alone. In terms of overshoot value, by using GCGA-PID controller, the performance is increased by almost 99.85%. This performance percentage is calculated based on the following equation (Waldemar, 2006).
𝑡𝑠% 𝑖𝑚𝑝𝑟𝑜𝑣𝑒𝑚𝑒𝑛𝑡=𝑡𝑠𝑃𝐼𝐷−𝑡𝑠𝐺𝐶𝐺𝐴−𝑃𝐼𝐷
𝑡𝑠𝑃𝐼𝐷 × 100
𝑜𝑠% 𝑖𝑚𝑝𝑟𝑜𝑣𝑒𝑚𝑒𝑛𝑡=𝑜𝑠𝑃𝐼𝐷−𝑜𝑠𝐺𝐶𝐺𝐴−𝑃𝐼𝐷
𝑜𝑠𝑃𝐼𝐷 × 100 (13)
Therefore, this study proved that by using GCGA-PID controller, the performance is better than using PID controller. With that, this study is able to enhance the TVC's temperature control system and a new approach of TVC’s temperature control system is achieved.
8. Conclusions and future works
As conclusions, an optimization of temperature control system of TVC is delivered and it is also considered as the new approach of TVC's temperature control system by using the GCGA-PID controller. Besides that, with this kind of research, indirectly it will become a key reference for the TVC improvements in the future. It also can be applied on a similar TVC system or any other testing equipment that uses PID as its control system. This improvement will enable the thermal vacuum test to be conducted in a more efficient manner. In general, it will help to reduce the duration to conduct the test, and indirectly save the electricity, human resource and utilities and so on. The suggestions for future enhancement are proposed as follows. Firstly, this study is done by using simulation testing methods. Therefore, if it can be executed and implemented in the real system, the simulation results can be compared with actual results and thus it will be able to provide better results and conclusions. Finally, the study could be improved further if the GCGA method is combined with other optimization algorithms such as a hybrid optimization algorithm that is lately becoming very popular among researchers.
Acknowledgment
We would like to express our gratitude to Ministry of Higher Education (MOHE Malaysia) for
providing financial support (research grant Q.K130000.2538.11H85) in conducting our study. Last but not least, we would also like to express our appreciation to Universiti Teknologi Malaysia (UTM) and specifically Advanced Informatics School (AIS) for realizing and supporting this research work.
References
Deb K (2012). Optimization for engineering design: Algorithms and examples. PHI Learning, New Delhi, India.
Loh CSX and Teo KTK (2009). Design and development of an auto-tuning proportional-integral-derivative controller using genetic algorithm. In the 2nd Seminar on Engineering and
Information Technology, Kota Kinabalu, Sabah, Malaysia: 70-74.
Mirzal A, Yoshii S, and Furukawa M (2012). PID parameters optimization by using genetic algorithm. ISTECS Journal, 8(arXiv: 1204.0885): 34-43. Available online at: https://arxiv.org/ftp/arxiv/papers/1204/1204.0885.pdf Murray-Smith DJ (2015). Testing and validation of computer
simulation models: Principles, methods and applications. Springer, Berlin, Germany.
Nadia N and Luiza DMM (2007). System engineering using particle swarm optimisation. Nova Science Publishers, Inc., New York. USA.
Rahairi RM (2012). Multi-objective optimization of pid controller parameters using genetic algorithm, Ph.D. Dissertation, Universiti Teknologi Malaysia, Johor Bahru, Malaysia. Robert H (2012). Temperature control of space simulation
chamber. M.Sc. Thesis, KTH Electrical Engineering, Stockholm, Sweden.
Saad MS, Jamaluddin H, and Darus IZM (2012). Implementation of PID controller tuning using differential evolution and genetic algorithms. International Journal of Innovative Computing, Information and Control, 8(11): 7761-7779.
Salleh N, Daud SM, Sabri SF, Ahmad NA, Shariff SA, Yusof YM, and Adam MZ (2016). Enhancing temperature control method of thermal vacuum chamber for satellite testing using optimization algorithm: A review. Jurnal Teknologi (Sciences and Engineering), 78(5–7): 1–6.
Srinivas N and Deb K (1994). Muiltiobjective optimization using nondominated sorting in genetic algorithms. Evolutionary Computation, 2(3): 221-248.
Stuart B (1994). Real-time computer control: An introduction. Prentice Hall PTR, Upper Saddle River, USA.