Abstract
Keith, Julia Elizabeth. Molecular Characterization of Microbial Populations
in Full-Scale Activated Sludge Plants and Bioaugmentation Sites. (Under the
direction of Francis de los Reyes.)
The application of molecular biology techniques to the study of wastewater
treatment and bioaugmentation was demonstrated in three studies. In the first study, full
scale activated sludge treatment plants in North Carolina were surveyed to (1) determine
the extent of filamentous bulking and foaming, and (2) relate these problems to the
microbial community structures in the activated sludge reactors. Oligonucleotide probes
targeting the rRNA of the major sublasses of the Proteobacteria, the mycolic acid
containing actinomycetes (mycolata) and Sphaerotilus natans were used in quantitative
hybridizations with samples from sixteen full scale plants. The survey results showed
that 88% and 63% of plants in North Carolina have experienced bulking and foaming,
respectively. No statistically significant correlations between the frequency and severity
of foaming and the levels of any of the microbial groups were observed. However,
several of the plants that had the most severe foaming problems had high levels of
mycolata and alpha Proteobacteria. Bulking in the sampled plants is probably not caused
by Sphaerotilus natans but by other filaments, or other floc characteristics. The sampling
protocol raised questions about possible change between collection and analysis, and a
second study was designed to determine optimal storage conditions. Quantitative
with chloramphenicol proved best in minimizing change over time in wastewater
samples. However, storage at room temperature was also a viable storage option. In the
third study, molecular methods were used to detect the bacterium Bacillus DA33 in
augmented wastewater and soil samples. A probe targeting the 16S rRNA of this
organism was designed and characterized for use in quantitative membrane
hybridizations. Because a unique target sequence was not available within the 16S
rRNA, another probe, this time targeting the 16S-23S intergenic spacer region, was
designed and characterized. Hybridization results showed that levels of Bacillus DA33
were higher in soil than in wastewater. In several bioaugmented soil and wastewater
samples, Bacillus DA33 had higher levels than in non-bioaugmented samples, but the
results were mixed in other cases. Molecular methods allow us to analyze environmental
samples in more detail. Integrating these methods in future studies of wastewater
treatment and bioaugmentation should provide more information that will help improve
Molecular Characterization of Microbial Populations in Full-Scale
Activated Sludge Plants and Bioaugmentation Sites
by
Julia Elizabeth Keith
A thesis submitted to the Graduate Faculty of North Carolina State University
in partial fulfillment of the requirements for the Degree of
Master of Science
Civil Engineering
Approved by:
Morton Barlaz Robert Borden
Dedication
This document is dedicated to my parents for their love and support, to Molly
Biography
Julia Keith received her B.S. in Biology from Duke University in May 2000.
During her undergraduate career, she was fascinated by biology and environmental
science. Upon completing the degree, she decided to apply the knowledge and skills
gained to environmental problems. As a graduate student, she worked at the interface
between environmental engineering and biology, applying molecular biology techniques
to the study of problems in wastewater treatment and bioremediation. Upon completion
of the Master of Science degree in Environmental Engineering, she will work in
Table of Contents
List of Tables... v
List of Figures ...vii
Introduction ... 1
Chapter 1, Bulking and foaming in North Carolina wastewater treatment plants and their relationship to microbial community structure ... 2
Abstract ... 2
Introduction ... 2
Materials and Methods ... 5
Results and Discussion... 10
Conclusions ... 18
References ... 19
Tables ... 22
Figures ... 27
Chapter 2, Effects of sample storage on the microbial community structure in wastewater treatment plant samples ... 36
Abstract ... 36
Introduction ... 36
Materials and Methods ... 41
Results ... 43
Discussion ... 47
Conclusions and Recommendations... 49
Acknowledgements ... 51
References ... 51
Tables ... 54
Figures ... 56
Chapter 3, Detection and quantification of a Bacillus strain used for bioaugmentation ... 65
Abstract ... 65
Introduction ... 66
Materials and Methods ... 68
Results and Discussion... 74
Conclusions ... 78
Future Research... 78
References ... 80
Tables ... 82
Figures ... 85
Appendix ... 94
List of Tables
Table 1.1. Probes and standards used for each group of
Bacteria.
Table 1.2. Survey results for the plants sampled.
Table 1.3. Percentages of plants in different studies
reporting foaming and bulking (when reported).
Table 1.4. Most common causes of and methods used to
control foaming, as reported by survey respondents.
Table 1.5. Most common causes of and methods used to
control bulking, as reported by survey respondents.
Table 2.1. Probes and standards used for each group of
Bacteria.
Table 2.2. Summary of levels of groups tested over
different sample treatments.
Table 3.1. 16S rDNA sequence of Bacillus DA33.
22
23
24
25
26
54
55
Table 3.2. Alignment of probe
S-Sp-B.DA33-1449-a-A-18 with other closely related species.
Table 3.3. Intergenic spacer region sequence and
portions of the 16S and 23S rDNA sequence of Bacillus
DA33.
83
List of Figures
1.1. Levels of Alpha Proteobacteria in North Carolina
Wastewater Treament Plants.
1.2. Levels of Beta Proteobacteria in North Carolina
Wastewater Treament Plants.
1.3. Levels of Gamma Proteobacteria in North Carolina
Wastewater Treament Plants.
1.4. Comparison of foam thickness to levels of Alpha
Proteobacteria.
1.5. Comparison of foam thickness to levels of Beta
Proteobacteria.
1.6. Levels of Mycolata in North Carolina Wastewater
Treament Plants.
1.7. Comparison of foam thickness to levels of Mycolata
1.8. Levels of Sphaerotilus natans in North Carolina
27
28
29
30
31
32
33
1.9. Relationship of SVI to levels of Sphaerotilus natans
in samples.
2.1. Diagram Demonstrating Experimental Design.
2.2. Results of the Membrane Hybridization for Cary
Alpha Proteobacteria.
2.3. Results of the Membrane Hybridization for Raleigh
Alpha Proteobacteria.
2.4. Results of the Membrane Hybridization for Cary
Beta Proteobacteria.
2.5. Results of the Membrane Hybridization for Raleigh
Beta Proteobacteria.
2.6. Results of the Membrane Hybridization for Cary
Gamma Proteobacteria.
2.7. Results of the Membrane Hybridization for Raleigh
Gamma Proteobacteria.
35
56
57
58
59
60
61
2.8. Results of the Membrane Hybridization for Cary
Mycolata.
2.9. Results of the membrane hybridization for Raleigh
mycolata.
3.1. Diagram of the plots used in the second soil
sampling experiment.
3.2. 16S rDNA, amplified with the primers 11f and
1492r.
863.3. Intergenic spacer region (ISR) DNA, amplified
with products KF17 and KF5
3.4. Td of the 16S probe. Probe washoff is expressed in
terms of the fraction of total.
3.5. Results of the Td study performed on the ISR probes.
3.6. Wastewater samples tested with the Bacillus DA33
16S probe.
63
64
85
86
87
88
89
3.7. Soil samples tested with the Bacillus DA33 16S
probe.
3.8 Soil samples representing treated and control plots
tested with the Bacillus DA33 16S probe. The treated
plots have been bioaugmented with B. DA33.
3.9. Soil samples representing treated and control plots
tested with the Bacillus DA33 ISR probe.
91
92
Introduction
The purpose of this study is to quantify specific microbial populations in
wastewater treatment plants and bioaugmentation sites using oligonucleotide probe
hybridizations. Molecular methods, particularly those targeting the ribosomal ribonucleic
acid (rRNA), have become important techniques in microbial ecology, and are
increasingly being used to investigate engineered systems such as wastewater treatment
plants. These techniques allow the identification and quantification of microbial
populations, without the limitations of traditional microbiological approaches.
Three separate projects were performed as part of the thesis research. Chapter 1,
“Bulking and Foaming in North Carolina Wastewater Treatment Plants and their
Relationship to Microbial Community Structure”, describes a survey designed to identify
problems in wastewater treatment plants in North Carolina and the analysis of microbial
community structure at those plants. Chapter 2, “The Effects of Sample Storage on the
Microbial Community Structure in Wastewater Treatment Plants” is an in-depth analysis
of samples collected from two of the plants studied in Chapter 1. The project analyzed
the effect of sampling procedures on group-specific changes in RNA levels in wastewater
samples and possible protocols that could be used to prevent change. Chapter 3,
“Detection and Quantification of a Bacillus Strain Used for Bioaugmentation”, examines
the design and characterization of oligonucleotide hybridization probes targeting Bacillus
Chapter 1, Bulking and foaming in North Carolina wastewater
treatment plants and their relationship to microbial community
structure
Abstract
A study was conducted to determine the prevalence of filamentous foaming and
bulking in wastewater treatment plants in North Carolina, and to relate these problems to
microbial community structure. Of the 47 plants surveyed, 88% had experienced
foaming. Plants that contained high levels of the alpha-subclass of the Proteobacteria and
relatively high levels of mycolata tended to experience the most severe foaming. Bulking
was not as common a problem as foaming and affected 63% of the plants surveyed.
There was no correlation between bulking and Sphaerotilus natans RNA levels,
indicating that some other filament or other floc characteristics are responsible for
bulking in these plants.
Introduction
Foaming and bulking problems in activated sludge wastewater treatment plants
can adversely affect environmental quality and in some cases cause a wastewater
treatment plant to violate its permit. Foaming refers to a thick brown scum that forms on
the surface of aeration basins and secondary clarifiers. This scum interferes with
equipment and can become a health and safety hazard (de los Reyes et al., 1997).
interfering with activated sludge settling (Jenkins et al., 1993). These problems have
been connected to the massive growth of specific filamentous microorganisms: foaming
has been related to Gordonia amarae and “Microthrix parvicella” among others (de los
Reyes and Raskin, 2002), and bulking can be caused by species including Sphaerotilus
natans and Eikelboom Type 1851 (Jenkins et al., 1993; de los Reyes et al., 1997).
The objectives of this study were 1) to determine the extent of foaming and
bulking, and 2) to perform an initial analysis of the microbial community structures
full-scale wastewater treatment plants in North Carolina. This analysis will generate baseline
data, and is the first step in forming recommendations to solve microbiologically-based
problems such as foaming and bulking.
A two-pronged approach was used to analyze the problems, the microorganisms
that cause them, and the conditions that allow the causative organisms to proliferate. The
first step in this approach was a written survey that asked wastewater operators questions
about problems that occur in their plants. This allowed the identification of plants that
have experienced bulking or foaming problems. The second step was collecting activated
sludge samples from several plants that have experienced problems, and quantifying the
microbial populations in the samples. By relating the levels of specific microorganisms
to plant processes, we can ultimately identify the niche of the specific microbial
populations. The challenge is to identify the problem-causing microorganisms, quantify
their levels, and determine the conditions that promote their growth. Activated sludge
systems can then be designed and operated to avoid conditions that lead to excessive
When applied to wastewater, many traditional methods of identification and
quantification give misleading results. Culture techniques are inherently flawed: it has
been shown that greater than 99% of microorganisms present in wastewater and other
environments cannot be cultivated, and analyses based on cultivation will overlook the
vast majority of organisms present (Wagner et al., 1993; Kampfer et al., 1996). Standard
light microscopy allows more reliable observation of microorganisms within a sample,
but many different bacteria have similar shapes, and it can be very difficult to distinguish
between the many rod-shaped or filamentous microorganisms present (Blackall, 1994).
The use of molecular methods circumvents these problems. Molecular methods
involving nucleic acid analysis allow us to analyze environmental samples without
cultivation. Because they are very specific, they also allow us to distinguish between
unrelated organisms, even those that are morphologically similar.
These molecular techniques include ribosomal RNA (rRNA) analysis, which can
be used to quantify the presence and the activity of different microorganisms within an
environmental sample. In this study, we used oligonucleotide probe hybridization
techniques targeting rRNA. This molecule, which includes a large subunit and small
subunit, is involved in protein synthesis and is therefore present in all organisms. Some
sequences within the molecule are highly conserved, while other sequences are variable.
Closely related organisms have high sequence similarities in their 16S rRNA. Because of
these properties, probes can be designed to target different phylogenetic levels. For
example, hybridizations may use a universal probe that targets all organisms, while
quantitative membrane hybridization then allows a description of the microbial
community structure within a sample.
A few studies have attempted to describe microbial community structure using
rRNA-targeted probes and correlate that structure to problems in wastewater treatment
(Juretschko et al., 2002; de los Reyes et al., in press). This study is only the second to
survey a large number of plants, and the only study that has evaluated plants in North
Carolina. The state contains an unusually high number of plants that perform biological
nutrient removal, and the associated long solids retention times (SRTs) may promote
filamentous foaming and bulking (Pitt and Jenkins, 1990; Jenkins et al., 1993).
Materials and Methods
Survey of North Carolina Activated Sludge Plants
A survey was developed to determine the extent of foaming and bulking in North
Carolina (Appendix). Approximately 200 surveys were sent to plants around the state; 47
of these were completed and returned. Contact information was obtained from the EPA
Envirofacts Warehouse Database (http://www.epa.gov/enviro/index_java.html).
The survey asked plant operators to describe their plants in terms of type of activated
sludge process (i.e. conventional activated sludge, oxidation ditch, etc) and the design
and operational conditions (hydraulic retention time [HRT], solids retention time [SRT],
flow rate, etc). The survey asked wastewater operators their opinions on the cause of
bulking or foaming at their plants and the success of control methods applied. Questions
frequency, and in the case of foaming, operators were also asked to estimate the average
foam depth.
Sample Collection
Based on survey results, the several plants with bulking or foaming problems
were selected. The descriptions of the wastewater treatment plants are summarized in
Table 1.2. Sampling packages consisting of a cooler, ice packs, and 50-mL centrifuge
tubes, were sent to these plants. Wastewater operators were asked to collect four grab
samples from each plant: one each from the aeration basin, secondary clarifier effluent,
return activated sludge line, and from any foam on the surface of the aeration basin.
Clarifier effluent samples contained too little biomass to analyze and were used to
visually examine effluent quality. Effluent quality was adequate in all cases.
RNA Extraction
RNA was extracted using a modified low pH, hot phenol method. (Stahl et al.,
1988; Raskin et al., 1994) Cell pellets were obtained in 2 mL screwcap tubes to which
silica zirconium beads (BioSpec, Bartlesville, OK), pH 5.1 buffer (2 mM
ethalenediaminetetraacetic acid [EDTA] and 10 mM sodium acetate), and phenol (pH
5.1) were added. The tubes were beaten on a BioSpec mini BeadBeater (BioSpec,
Bartlesville, OK) for 2 minutes, incubated at 60°C for ten minutes and then returned to the bead beater for two minutes. The beads were separated from the remaining material
beaten for another minute. Aqueous material was separated from the beads and
combined with the mixture of organic and aqueous material. The samples were
centrifuged for 10 minutes at 9300 x g, and the aqueous material was transferred to clean
tubes. The aqueous material was re-extracted once with phenol, twice with 4:1 phenol:
chloroform, and once with chloroform. RNA was precipitated overnight by adding ½
volume of 10 M NH4Ac and 2 volumes of absolute ethanol to the aqueous material.
After overnight storage in a -20°C freezer, the RNA was collected by centrifuging for 30 minutes at 16000 x g and resuspended in 250 uL of sterile water. The quality of
extracted RNA was evaluated using poylacrylamide gel electrophoresis and quantified
using the Gel-Pro Image Analysis software v. 3.1 (Media Cybernetics, Silver Spring,
MD) using E. coli 16S rRNA standards (Roche Diagnostics, Indianapolis, IN).
Temperature Dissociation (Td) Study
The dissociation temperature (Td) of the probe S-S-S.nat-656-A-a-18 was
experimentally determined by performing a Td study. The Td, which occurs at 50% probe
washoff, was used as the wash temperature in subsequent hybridizations.
Membrane Hybridizations
Quantitative membrane hybridizations were used to determine the rRNA fractions
of three major Bacterial groups in wastewater (the Alpha, Beta and Gamma subclasses of
the Proteobacteria (Kampfer et al., 1996)). We also tested individual genera and species
include the mycolic-acid containing actinomycetes (Mycolata), Gordonia, and Gordonia
amarae, which have been shown to cause foaming in wastewater treatment plants (de los
Reyes et al., 1997), and the filament Sphaerotilus natans which can cause bulking
(Wagner et al., 1994d). Probe names, sequences, target groups, and was temperatures are
shown in Table 1.1. RNA at an initial concentration of 100 ng/uL was diluted 1:3 in 2%
glutaraldehyde and denatured for 10 minutes at room temperature. Samples were then
diluted in sterile water containing RNase free bromophenol blue to a final concentration
of 1 ng/uL. Standards were denatured in the same manner, but a dilution series was
prepared following denaturation. Concentrations of the dilution series ranged from
0.025-1.28 ng/uL. Samples and standards were applied in triplicate to a MagnaCharge
nylon membrane (Osmonics; Minnetonka, MN).
Oligonucleotide probes were obtained from Sigma Genosys (The Woodlands,
TX), labeled with 32P, and membranes were prehybridized for 30 minutes to 2 hours in 18
mL PerfectHyb Plus hybridization buffer (Sigma-Aldrich Chemicals; St. Louis, MO).
The probe labeling reaction was performed using 1-5 µL probe, 1-3 µL 32P-γATP (ICN Biomedicals; Costa Mesa, CA), 1 µL T4 polynucleotide kinase (Promega Corp.; Madison,
WI), 3 µL 10x polynucleotide kinase buffer (Promega Corp.; Madison, WI), 1.5 µL 1%
Igepal type NP40 (Sigma-Aldrich Chemicals; St. Louis, MO) and water to a final volume
of 30 µL. The reaction proceeded for 30-45 minutes at 37oC. Labeled probe was
purified using mini-Quick Spin Oligo Columns (Roche Diagnostics Corp.; Indianapolis,
IN), following the manufacturer’s instructions. Purified probe was added to membranes,
and hybridized overnight at 40oC. Membranes were then washed twice for 30 minutes in
washed once for 30 minutes in 350 mL wash buffer at the probe-specific wash
temperature. The membranes were dried and exposed for 1-3 days on a Phosphorscreen.
The screen was scanned on a Phosphorimager (Amersham Biosciences; Piscataway, NJ)
and the resulting image was analyzed using the ImageQuant software package
(Amersham Biosciences; Piscataway, NJ).
Each set of membranes was tested against a group-specific probe as well as
Bacterial and Universal probes. The standards series on each membrane was analyzed
and linear regression was used to determine the relationship between signal intensity and
ng RNA. This relationship was used to determine the ng of group, Bacterial and total
rRNA for each sample. RNA quantities of group specific probes were then normalized
using the formula:
% RNA = [ ng group RNA / (ng Bacterial or Universal) ] * 100%.
Bacterial RNA values were occasionally inconsistent, so all analysis was
performed on a basis of total (Universal probe) values. RNA of standards and selected
samples were examined on a non-denaturing polyacrylamide gel.
Statistical analysis
Possible correlations between RNA levels within the samples to bulking or
foaming were compared using a z-correlation test. The data was analyzed in the
Results and Discussion
Survey Results
The average SRT of the activated sludge processes reported by survey
respondents was 22 days. This number is high when compared to those found in other
studies. This is unsurprising, as many plants in North Carolina maintain high solids
retention times (SRT), which have been connected to foaming (Pitt and Jenkins, 1990).
Although only 9 of the plants surveyed indicated that they performed biological nutrient
removal, several plant operators expressed plans to upgrade. Six of the plants sampled
performed biological nutrient removal. Survey results for the plants sampled are shown
in Figure 1.2.
Of the survey respondents, 88% and 63% reported having experienced episodes of
foaming and bulking, respectively. Table 1.3 shows how these results compare to those
obtained in other studies. The levels of foaming and bulking observed in this study are
high relative to the European studies and comparable to those observed in the Australian
study. Various studies have observed a higher frequency of foaming and bulking in
plants that perform biological nutrient removal (BNR) than in other wastewater treatment
plants (Krhutkova et al., 2002). Several researchers believe that this can be attributed to
the higher solids retention times used in biological nutrient removal plants (refs). In this
study, BNR plants had higher average foam depths (6.3 inches) than those that did not
perform BNR (3.6 inches), while both groups had similar foaming frequencies (3.6 vs.
4.0 out of 8). In this study, BNR plants had an average SRT of 361 hours, while
non-BNR plants had an average SRT of 510 hours. The higher average foam depths in non-BNR
The frequency and severity of foaming at the different plants sampled are shown
in Table 1. Most survey respondents that reported bulking observed it infrequently, and
foaming was more common. Frequency of foaming and bulking were rated on a scale of
1 = never to 8 = continually. On this scale, the average frequency of foaming was 4 and
the average frequency of bulking was only 2.
Table 1 shows that three plants sampled were bulking, and almost all were
foaming at the time of sampling. The thickness of foaming (in inches) was used as a
measure of the severity of foam. The severity of bulking was measured using the sludge
volume index (SVI). SVI is calculated based on the formula:
SVI = SV30 (mL / L ) SS (g / L)
Where: SV30 is the volume of sludge obtained by allowing 1 L of wastewater to settle
for 30 minutes;and SS is the suspended solids concentration (Jenkins et al., 1993).
An SVI of 150 or greater indicates that bulking is occurring. Samples 1, 2, 5 and
11 (Raleigh, St. Paul’s, North Cary, and Blowing Rock) were bulking. The Raleigh and
Cary plants had SVI values just over 150, but the St. Paul’s plant had an SVI of over
2000. Even if this value resulted from a misplaced decimal point, and the actual SVI was
approximately 200, the plant still has a bulking problem. The plant operator indicated
that bulking does not affect operation because the plant functioned with excess clarifier
capacity.
All but one of the plants sampled had experienced foaming. Foam occurred
relatively frequently at most of the plants, and several plants had foam at least two inches
interesting case: the plant operator insisted that foaming never occurred, but others’
observations indicated that foaming was always present, with a typical depth of at least 5
inches. Therefore we considered this plant to have foaming frequency of 8.
When analyzing the data, it is important to be cognizant of the subjective nature
of the survey and the fact that plant operators were the primary source of information.
Operators’ estimations of the severity of problems may be affected by their personal
experience. In plants near capacity, foam can spill onto walkways and create a safety
hazard but in a plant well below capacity, the same amount of foam may not interfere
with operation. The operator of the first plant would be very likely to report it, but the
operator of the second might deemphasize foaming. In most cases, the researchers
cannot determine the accuracy of values written on the survey. One questionable value
was the SVI of over 2000 obtained from the Saint Paul’s plant. The value written down
on the survey may be correct, or it may involve a misplaced decimal point. The
researchers felt that the additional data obtainable through surveys far outweighs the error
introduced by the occasional error in responses.
The personal opinion of wastewater operators can also be important in
understanding problems like foaming and bulking. Operators view the plant constantly,
and are personally familiar with any problems that occur in the treatment process. As
part of the survey, we asked operators to list what they perceived as the causes of
foaming and bulking and the most effective techniques to control these problems. Causes
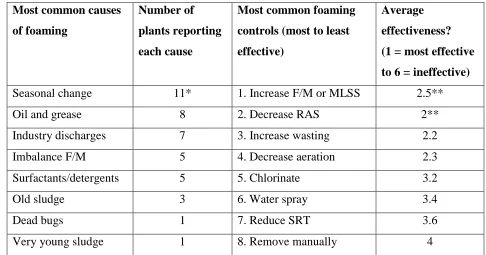
and controls of foaming are reported in Table 1.4, and those of bulking are reported in
Table 1.5. The most common cause cited for foaming was temperature change in fall or
effective control mechanisms for foaming were to increase wasting and decrease aeration.
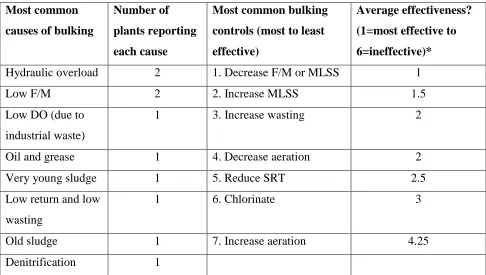
Fewer plants speculated about the causes of bulking; some of those reported included
hydraulic overload, low F/M ratio, and old sludge. One operator’s bulking control
method was an increase in MLSS, while another found a decrease in MLSS effective.
The causes of bulking may be plant-specific, but there is not enough data to draw definite
conclusions.
To determine what operational conditions lead to foaming and bulking, it was
beneficial to analyze the commonalities between plants that experienced these problems
but also how these plants differed from those that did not observe foaming or bulking.
Z-tests for correlation were used to compare depth of foaming and SVI to solids retention
time. The relationship was not statistically significant, but when depth of foaming was
grouped about appropriate values, it was found that plants with foam up to 1” deep had
average SRTs of 407 hrs. Plants with foam greater than 1” deep and up to 6” deep had
average SRTs of 470 hours, and plants with foam greater than 6” deep had average SRTs
of 519 hours. Non-bulking sludges had average SRTs of 424 hours, while bulking
sludges had average SRTs of 496 hours.
Based on operators’ suggestions for causes of bulking and foaming, data were
analyzed to determine whether foaming or bulking sludges had higher levels of industrial
waste or surfactant inflow. There was no significant difference between foaming and
non-foaming or bulking and non-bulking sludges. Sludges that did not suffer filamentous
Microbial Community Structure
Before hybridization, selected RNA of standards and samples was analyzed on an
acrylamide gel (data not shown). Clear bands showed for the 16S and 23S regions of
RNA. No obvious degradation was present in samples and standards tested.
Figures 1.1-1.3 show the levels of alpha, beta, and gamma Proteobacteria in
collected samples. All microbial groups were compared to SVI using a Z-correlation test.
There were no correlations between microbial group and SVI. For each plant tested, the
levels of a particular group RNA are approximately the same in the RAS line as in the
aeration basin, with a few exceptions. At plant 4, levels of beta and gamma
Proteobacteria rRNA are higher in the RAS line than in the aeration basin. At plant 16,
levels of beta Proteobacteria are significantly higher in the RAS line than in the aeration
basin. Plants 9 and 11 show higher rRNA levels of alpha Proteobacteria in the RAS line
than in the aeration basin. Plant 10 shows higher rRNA levels of beta Proteobacteria in
the aeration basin than in the RAS line.
The alpha-subgroup of the Proteobacteria is clearly the dominant phylogenetic
group at plants 1, 2, 5, 6, 7 and 8. With the exception of plant 2, foaming tended to be a
more severe problem at these plants than at other plants. Figure 1.4 compares foam
thickness to levels of alpha Proteobacteria found in the samples. Although there appears
to be some relationship between high levels of alpha Proteobacteria and higher values of
foam thickness, linear regression was not a good fit for the data. Z-tests for correlation
significance were used to compare levels of alpha Proteobacteria to foam thickness in all
samples tested and in the subset of samples where alpha Proteobacteria was dominant,
which has been the dominant phylogenetic group in many previous studies on
wastewater, (de los Reyes, 2002; Juretschko et al., 2002; Wagner et al., 2002) was
dominant only at plant 10 in the current study. This may be because of climate
differences, and the relatively high SRTs in North Carolina wastewater treatment plants.
Figure 1.5 compares the levels of beta Proteobacteria to foam thickness. As with the
alpha Proteobacteria, there appears to be some increase in foam height with increasing
levels of this phylogenetic group. This trend appears to be clearer than that seen in the
alpha Proteobacteria, but is also not statistically significant. There was no relationship
between levels of gamma Proteobacteria and foam height (data not shown).
Samples from 14 of the plants were analyzed for Mycolata, Gordonia, and
Gordonia amarae. Mycolata results are shown in Figure 1.6, but due to hybridization
errors the Gordonia and G. amarae results are not shown.
The mycolata is a bacterial group that contains many filamentous
microorganisms. Gordonia (formerly Nocardia) amarae is one of the best studied of
these species, but other members of the Mycolata group can cause foaming. Levels of
mycolata RNA are typically higher in the foam samples than in other samples taken.
Foaming members of this bacterial group can partition to foam and in some cases can
remain even if their levels decline in the MLSS (de los Reyes et al., 1997). Figure 1.7
compares foam height to levels of mycolata in the samples, and there was no clear
relationship between the two. Z-tests compared foam height to levels of mycolata in all
samples and in the subset of sample with elevated mycolata levels in foam, but failed to
show any correlations. This indicates that mycolata is not causing foam in all cases, but
foaming. The apparent relationships between alpha and beta Proteobacteria and foaming
was discussed earlier; perhaps this indicates that mycolata and some member(s) of the
alpha or beta Proteobacteria are both contributors to foaming in particular wastewater
treatment plants.
Plants 4 and 5 are likely candidates for mycolata foaming. In the foam sample
from plant, the Mycolata contribute 14% of total rRNA while they contribute less than
1% of total rRNA in the mixed liquor sample from the same plant. The foam at this plant
was estimated to be 5 inches thick. Although it does not cause problems in plant
operation, the researchers have observed that it appears on the aeration basin almost
continually. Plant 4 experiences very severe foaming, ranging from 18-36 inches deep.
This plant has elevated levels of mycolata in the foam sample, and mycolata levels in the
MLSS are also higher than average. It is likely that the mycolata contribute significantly
to foaming at these plants.
Levels of G. amarae and Gordonia in the samples were extremely low (data not
shown). This indicates that members of the Mycolata other than Gordonia are present,
and that non-Gordonia mycolata may cause foam.
To examine bulking, we compared levels of microbial groups in the samples to
sludge volume index (SVI). There was no relationship between alpha, beta, or gamma
Proteobacteria and sludge volume index. Assays were also performed on Sphaerotilus
natans. This filament contributes to bulking in wastewater treatment plants and lab-scale
reactors and is probably the best researched bulking filament. Levels of S. natans in the
samples are shown in Figure 1.8. Levels of S. natans range from 2.4 % to 13.1 % of total
natans in the samples. There does not appear to be a correlation between the presence of
this species and bulking in the wastewater treatment plants. SVI and levels of the
filament were compared using Z-correlation tests. There was no significant correlation
between SVI and S. natans either when all samples or when the subset of samples that
were bulking were analyzed. Resarch has also shown that Sphaerotilus natans does not
grow as well in environmental samples as in lab reactors; and that it may not be the most
common bulking-causing filament in wastewater treatment plants ((Blackbeard et al., 1986)).
This may indicate that a different filamentous bacterium might be causing the bulking. In
a recent study, our laboratory group has determined that EikleboomType 1851 was more
prevalent in several plants (unpublished data).
Relationship of observed microbial community structure to average conditions
In this study, we collected only one set of samples from each of the plants. While
this was the only feasible way to collect samples from many different plants, many of the
responses to survey questions gave average values of operational parameters (SVI,
MLSS) or problems (bulking, depth of foam). The microbial community structure in
individual samples may not represent the average microbial community structure for the
plant, and comparing it to the average values obtained through the survey may make it
more difficult to demonstrate statistically significant trends in the data. For example:
63% of surveyed plants reported experiencing bulking, but only 4 of the 16 (25%) plants
sampled were bulking at the time the sample was collected. This may indicate that there
an underestimate of the total amount of bulking filaments present. This does not
invalidate the research, but should be kept in mind when performing analysis.
Conclusions
Foaming appears to be a more severe problem in North Carolina wastewater
treatment plants than in studies conducted in Europe. Although more than half of plants
observed bulking, its occurrence was generally infrequent; the average frequency value of
bulking was 2 out of a possible 8. There was no correlation between bulking and the
levels of S. natans. Foaming was a widespread problem, occurring in a majority of
wastewater plants surveyed. 71% of plants reported at least moderate foaming, and 17%
of plants reported heavy foaming. In most cases, those plants that observed more severe
foaming had high levels of Mycolata or Alpha Proteobacteria.
This project is a preliminary analysis of bulking and foaming in North Carolina
wastewater treatment plants. More analyses need to be performed on the samples to draw
more definite conclusions. Because the usual suspects (i.e. Gordonia amarae and
Sphaerotilus natans) did not seem to be causing foaming or bulking in all of the plants, it
could prove worthwhile to probe for other filaments within the samples. Probing for
several different filaments should help us to determine which filaments are present in the
samples and also which filaments are the most important causes of foaming and bulking.
It is also important to remember that the experiments described in this section were
performed on grab samples. Conditions at the time of sampling may not reflect average
severity of bulking and foaming at every plant tested. A very important area of future
many samples taken from a few wastewater treatment plants over several months or
years, we can better understand the relationship between filament levels and operating
conditions at those plants. By combining these in-depth analyses with survey data, we
can extrapolate to other survey respondents.
The relatively high foam depths in BNR plants also bears further study. BNR
plants are often connected to foaming and bulking because the associated long solids
retention times are thought to promote growth of filaments. Surprisingly, although North
Carolina BNR plants suffered greater foaming than non-BNR plants, the non-BNR plants
had far higher average SRTs. This indicates that other operational conditions are more
likely to lead to foaming. One possibility would be lower oxygen levels, which favor the
growth of various filament types (Jenkins, 1992), in plants that perform biological
nitrogen or phosphorous removal vs. continuously aerated plants. Further research in this
area should help us better understand filamentous growth in the North Carolina plants.
References
Blackall, L., A. Harbers, P. Greenfield and A. Hayward (1991). “Foaming in Activated Sludge Plants: A Survey in Queensland, Australia and an Evaluation of Some Control Strategies.” Water Research 25(3): 313-317.
Blackall, L. L. (1994). “Molecular Identification of Activated Sludge Foaming Bacteria.” Wat. Sci. Tech. 29(7): 35-42.
Blackbeard, J. R., G. A. Ekama and G. R. Marais (1986). “A Survey of Bulking and Foaming in Activated Sludge Plants in South Africa.” Water Pollution Control 85:
90.
de los Reyes, F., W. Ritter and L. Raskin (1997). “Group-Specific Small-subunit rRNA Hybridization Probes to Characterize Filamentous Foaming in Activated Sludge Systems.” Applied and Environmental Microbiology 63(3): 1107-1117.
de los Reyes, F. L. and L. Raskin (2002). “Role of Filamentous Microorganisms in Activated Sludge Foaming: Relationship of Mycolata Levels to Foaming Initiation and Stability.” Water Research 36(445-459).
de los Reyes, F. L., D. Rothauszky and L. Raskin (in press). “Microbial Communities in Foaming and Non-Foaming Full-scale Activated Sludge Systems.”.
Eikelboom, D. H. (1994). “The Microthrix parvicella Puzzle.” Water Science and Technology 29: 271-279.
Jenkins, D., M. Richard and G. T. Daigger (1993). Manual on the Causes and Control of Activated Sludge Bulking and Foaming. Chelsea, Michigan, Lewis Publishers, Inc.
Jenkins, D. J. (1992). “Towards a Comprehensive Model of Activated Sludge Bulking and Foaming.” Water Science Technology 25(6): 215-230.
Juretschko, S., A. Loy, A. Lehner and M. Wagner (2002). “The Microbial Community Composition of a Nitrifying-Denitrifying Activated Sludge from an Industrial Sewage Treatment Plant Analyzed by the Full-Cycle rRNA Approach.” System. Appl. Microbiol. 25: 84-99.
Kampfer, P., R. Erhart, C. Beimfohr, J. Bohringer and M. A. Wagner, R. (1996). “Characterization of Bacterial Communities from Activated Sludge: Culture-Dependent Numerical Identification versus in situ Identification Using Group- and Genus-Specific rRNA-Targeted Oligonucleotide Probes.” Microbial Ecology
32: 101-121.
Krhutkova, O., I. Ruzickova and J. Wanner (2002). “Microbial Evaluation of Activated Sludge and Filamentous Populaiton at Eight Czech Nutrient Removal Activated Sludge Plants During the Year 2000.” Water Sci. Technol. 45(1-2): 471-478.
Pitt, P. and D. Jenkins (1990). “Causes and Control of Nocardia in Activated Sludge.” Research Journal WPCF 62: 143-150.
Raskin, L., J. M. Stromley, B. E. Rittmann and D. A. Stahl (1994). “Group-Specific 16S rRNA Hybridization Probes to describe Natural Communities of Methanogens.” Applied and Environmental Microbiology 60: 1232-1240.
Schwitzenbaum, M. S., T. R. Plante and B. K. Woodworth (1992). “Filamentous Bulking in Massachusetts: Extent of the Problem and Case Studies.” Wat. Sci. Tech. 25
(4-5): 265-271.
Seviour, E. M., C. Williams, B. DeGrey, J. A. Sodell, R. J. Seviour and K. C. Lindrea (1994). “Studies on Filamentous Bacteria From Australian Activated Sludge Plants.” Water Research 28(11): 2335-2342.
Stahl, D. A., B. Flesher, H. R. Mansfield and L. Montgomery (1988). “Use of
Phylogenetically Based Hybridization Probes for Studies of Ruminal Microbial Ecology.” Applied and Environemental Microbiology 54(May): 1079-1084.
Wagner, M., R. Amann, H. Lemmer, W. Manz and K. H. Schleifer (1994d). “Probing Activated Sludge With Fluorescently Labeled rRNA Targeted Oligonucleotides.” Wat. Sci. Tech. 29, 7: 15-23.
Wagner, M., R. Amann, H. Lemmer and K.-H. Schleifer (1993). “Probing Activated Sludge with Oligonucleotides Specific for Proteobacteria: Inadequacy of Culture-Dependent Methods for Describing Microbial Community Structure.” Applied and Environmental Microbiology 59: 1520-1525.
Wagner, M., A. Loy, R. Nogueira, U. Purkhold, N. Lee and H. Daims (2002). “Microbial Community Composition and Function in Wastewater Treatment Plants.” Antonie van Leeuwenhoek 81: 665-680.
Wanner, J. (1994). “The Implementation of Bulking Control in the Design of Activated Sludge Systems.” Wat. Sci. Tech. 29 ,7: 193-202.
Table 1.1. Probes and standards used for each group of Bacteria.
Target group Probes used Probe sequence Standard Wash Temperature (Td),
o C
Reference
α Proteobacteria S-Sc-aProt-0019-a-A-17c
CGTTCG C/T TCTGAGCCAG Gluconacetobacter hansenii 53 (Manz et al., 1992)
β Proteobacteria L-Sc-bProt-0042-a-A-17d
GCCTTCCCACTTCGTT Sphaerotilus natans 58 (Manz et al., 1992)
γ Proteobacteria L-Sc-gProt-0042-a-A-17d
GCCTTCCCACATGGTTT Leucothrix mucor 58 (Manz et al., 1992)
Mycolata S-*-Myb-0736-b-A-22
CAGCGTCAGTTACT (Nit 1) CCCACAC
Gordonia amarae 51 (de los Reyes et al., 1997)
Sphaerotilus natans
S-Sp-S.nat-656-a-A-18
Table 1.2. Survey Results for the Plants Sampled.
Sample
Number Town Plant Name Flow Rate
(106 L/day) SRT (hrs) F/M SVI at time of sampling Frequency of foaming Foam Thickness (in)
1 Raleigh Neuse River WWTP 227.1 240-360 n/r** 157 * 6 2.5
2 St. Paul's Town of St. Paul's WWTP 1.9 n/r 0.003 2414 * 7 0.5
3 Cramerton Eagle Road WWTP 15.1 > 720 n/r 120 7 0.5
4 Greenville Commission WWTP Greenville Utilities 66.2 264-480 0.1/.06 96 4 27
5 North Cary North Cary WRF 37.8 696 0.07 150 * Reported = 1, Observed = 8 5
6 Boone Town of Boone WWTP 18.2 288 0.15 n/r 5 4
7 Monroe Town of Monroe WWTP 34.1 396 < 0.1 14 6 6
8 Gastonia Long Creek WWTP 60.6 408 .08 95 4 7
9 Lenoir Lower Creek WWTP 22.7 sum.: 360 win.: 480 w: 0.09 s: 0.12 135 3 < 1
10 Hudson Gunpowder Creek WWTP 7.6 w: 672 s: 336 0.085 124 4 1.5
11 Blowing Rock Blowing Rock WWTP 3.0 n/r n/r 275 * 5 n/r
12 Charlotte Mallard Creek WWTP 30.3 240 n/r 117 8 4
13 Charlotte McAlpine Creek WWTP n/r n/r n/r n/r No surveys
14 Charlotte McDowell Creek WWTP 22.7 n/r n/r 92 No surveys
15 Charlotte Sugar Creek WWTP 50.9 13.9 .14 96 4 1
16 Charlotte Irwin Creek WWTP 43.3 11.47 n/r 82 No surveys
Table 1.3. Percentage of plants in different studies reporting foaming and bulking (when
reported).
*n/r indicates that the data were not reported
Reference: No. of plants
surveyed
% of plants
reporting foaming
% of plants
reporting bulking
North Carolina This study 47 88 63
Australia, 1990 (Blackall et al., 1991) 46 92 60 Australia, 1994 (Seviour et al., 1994) 65 68 82 California (Pitt and Jenkins, 1990) 134 66 n/r* Czech Rep., 1996 (Wanner et al., 2000) 78 28 n/r Czech Rep., 1997 (Wanner et al., 2000) 72 46 n/r
Denmark (Wanner, 1994) 50
Italy (Rossetti et al., 1994) 39 50 49
Illinois (de los Reyes, 2002) 33 97
Massachusetts
(Schwitzenbaum et al., 1992)
50
Table 1.4. Most common causes of and methods used to control foaming, as reported by
survey respondents.
Most common causes
of foaming
Number of
plants reporting
each cause
Most common foaming
controls (most to least
effective)
Average
effectiveness?
(1 = most effective
to 6 = ineffective)
Seasonal change 11* 1. Increase F/M or MLSS 2.5**
Oil and grease 8 2. Decrease RAS 2**
Industry discharges 7 3. Increase wasting 2.2
Imbalance F/M 5 4. Decrease aeration 2.3
Surfactants/detergents 5 5. Chlorinate 3.2
Old sludge 3 6. Water spray 3.4
Dead bugs 1 7. Reduce SRT 3.6
Very young sludge 1 8. Remove manually 4
*For 4 respondents, foaming increased in spring-summer. For 4, foaming increased in both spring and fall. The remaining 3 plants reported seasonal change but did not specify when it occurred.
Table 1.5. Most common causes of and methods used to control bulking, as reported by
survey respondents.
Most common
causes of bulking
Number of
plants reporting
each cause
Most common bulking
controls (most to least
effective)
Average effectiveness?
(1=most effective to
6=ineffective)*
Hydraulic overload 2 1. Decrease F/M or MLSS 1
Low F/M 2 2. Increase MLSS 1.5
Low DO (due to industrial waste)
1 3. Increase wasting 2
Oil and grease 1 4. Decrease aeration 2
Very young sludge 1 5. Reduce SRT 2.5
Low return and low wasting
1 6. Chlorinate 3
Old sludge 1 7. Increase aeration 4.25
Denitrification 1
0 10 20 30 40 50 60 70 80
1 2 3 4 5 6 7 8 9 10 11 12 13 14 15 16
Sample Number
%
to
ta
l RNA MLSS
0 10 20 30 40 50 60
1 2 3 4 5 6 7 8 9 10 11 12 13 14 15 16
Sample Number
% to
tal
rRNA MLSS
RAS FOAM
0 10 20 30 40 50 60
1 2 3 4 5 6 7 8 9 10 11 12 13 14 15 16
Sample Number
% tota
l r
RNA
MLSS RAS FOAM
0 5 10 15 20 25 30
0 10 20 30 40 50 60
% total rRNA
F
o
a
m T
h
ickn
ess (
in
)
MLSS RAS Foam
0 5 10 15 20 25 30
0 10 20 30 40 50 60
% total rRNA
Foam Thi
ckness (i
n)
0 2 4 6 8 10 12 14 16
1 3 4 5 6 7 8 9 10 11 12 13 14
Plant
Mycol
a
ta as % of Uni
v
ersal
S
ignal
MLSS RAS FOAM
0 5 10 15 20 25 30
0 2 4 6 8 10 12 14 16
% total rRNA
Foa
m he
ight (in)
MLSS RAS FOAM
0 2 4 6 8 10 12 14 16
1 2 3 4 5 6 7 8 9 10 11 12 13 14
Plant
% total r
RNA
aer RAS foam
0 50 100 150 200 250 300
0 2 4 6 8 10 12 14
% total rRNA
SVI MLSS
Chapter 2, Effects of sample storage on the microbial community
structure in wastewater treatment plant samples
Abstract
Oligonucleotide probe hybridizations targeting rRNA are sensitive tools for the
analysis of microbial community structure in wastewater treatment plant samples. This
sensitivity raises concerns for many researchers, because when collecting environmental
samples it is often not possible to analyze the samples immediately. If RNA levels
change in response to storage conditions, quantitative membrane hybridizations may not
accurately reflect in situ levels of microbial populations. We analyzed the effect of
different sample storage conditions on the relative RNA levels of major Bacterial groups
in wastewater. Results showed that RNA levels in samples treated with chloramphenicol
will remain approximately constant for at least 48 hours, while RNA levels in samples
stored at room temperature will remain constant for at least 24 hours. Either might be a
viable storage option for sample collection, but storage at room temperature is more
practical.
Introduction
Engineers and operators of wastewater treatment plants are interested in
desired organisms (e.g., phosphate accumulating organisms and nitrifiers) and to control
the growth of problem organisms, (e.g., filaments that promote bulking or foaming).
Molecular techniques have been used since the early 1990’s to identify and quantify
microorganisms in wastewater treatment systems. Using ribosomal ribonucleic acid
(rRNA) sequence analysis, engineers and operators can begin to optimize wastewater
treatment plant design and operation to favor microbial communities that effectively treat
wastewater while avoiding the occurrence of problems.
Membrane hybridizations (also known as Northern blots or hybridization after
extraction) are one method of rRNA analysis. Ribosomal RNA samples and standards
series are blotted onto a membrane in triplicate, and then labeled probe is added to the
membrane. The probe binds to the RNA of interest, and the levels of RNA in the sample
can be determined through quantification of the resulting signal. This method is powerful
because it is quantitative and allows analysis of many samples simultaneously. Statistical
analysis on the data shows that the results of this method are more quantitative and
precise than those obtained with many of the PCR-based methods common in
environmental microbiology (Reue, 1998).
When collecting samples for RNA- or DNA-based molecular characterization,
immediate analysis or immediate freezing for later analysis should show the microbial
community structure at the time of collection. When samples are not analyzed
immediately, changes in dissolved oxygen levels, biochemical oxygen demand (BOD),
temperature and other factors may begin to affect the microbial community structure.
RNA levels may shift in response to these changes, and thus affect the results of
A variety of studies have examined the stability of RNA in animal tissues (Barton
et al., 1993; Leonard et al., 1993; Marchuk et al., 1998; Fitzpatrick et al., 2002). These
studies have found that the stability of rRNA varies depending on the tissue of origin. In
one study, rRNA extracted from bovine reproductive tissues degraded between 24 and 96
hours (Fitzpatrick et al., 2002). In another study, rRNA extracted from connective tissue
remained stable but rRNA extracted from the liver was degraded in a sample stored for
48 hours. The authors believed that greater rRNA degradation in the liver was related to
the relatively high levels of RNases present in that organ (Marchuk et al., 1998).
Although these studies concluded that RNA degradation did not present significant
problems for further molecular analyses, this may not be the case for wastewater samples,
where Bacteria form a large fraction of the biomass. Because bacterial cells contain
approximately twice as much RNAse as eukaryotic cells (Sambrook et al., 1989), rRNA
levels in a bacterial sample might be expected to change more over time. This change
may also be group-specific or species-specific, with rRNA from some groups or species
more sensitive to degradation than others.
A few studies have examined the effect of sampling on the microbial community
structure of soil samples. One study examined the effect of varying substrate loading
rates and storage on a soil core (Griffiths, 1998). This study used %G+C analysis and
community DNA hybridization to examine microbial community structure, and does not
demonstrate the effects of storage on RNA. A recent study examines the effects of
freezing and storage at room temperature on soil samples (Sessitch, 2002). The authors
found that the quality of RNA was equivalent in frozen and room temperature samples,
leaving open the question of group-specific degradation or production. It should also be
noted that soil samples contain far lower biomass levels than do activated sludge samples,
so the results of a storage experiment in wastewater treatment plants may not correspond
to the results seen in soil.
Such changes after sampling can present many problems when trying to analyze
different wastewater treatment plants. It is unlikely that any wastewater treatment plant
could justify investing in the technology to perform molecular techniques, and treatment
facilities would most likely send samples to an outside lab for analysis. The sample may
spend several days in transit, during which time rRNA composition may change
significantly. We conducted a study of wastewater treatment plants in North Carolina
(Chapter 1) and examined several options for storage and shipment of samples. Dry ice
for immediate freezing was unavailable in most of the plants. Thus the collected samples
were shipped overnight on wet ice. Despite these precautions, some samples had reached
room temperature by the time they arrived at the laboratory.
Previous research into changes in microbial community structure in
environmental samples have used broad measurements (% G+C, community DNA
hybridization) (Griffiths, 1997) or more specific but less quantitative methods such as
restriction fragment length polymorphism (RFLP) (Tiedje et al., 1998). Although RFLP
and other similar signature technologies can be semi-quantitative, PCR-based methods
always raise concerns of PCR bias (Altwegg, 1995; Amann and Ludwig, 2000). We
wanted a reliable quantitative analysis to use in the current study that would lend itself to
statistical analysis and that could also be refined to show small-scale phylogenetic
hybridization because it allowed us to reliably quantify rRNA present in stored samples
and to analyze samples on a number of different phylogenetic levels. The current study
was designed to determine: 1) how the microbial communities in activated sludge
samples changed after collection as measured by rRNA hybridization and 2) how samples
can be handled to increase the reliability of rRNA hybridizations. In this study we
concentrated on group-specific rRNA, but if more specific identification were required
the analysis could be expanded using genus- or species-specific probes.
Four treatment conditions were identified to explore these questions. Storage at
4oC simulated shipment on ice, while storage at room temperature (20-25 oC) simulated a sample allowed to warm during shipment. Samples were also treated with
chloramphenicol (CM), a broad spectrum antibiotic that inhibits RNA production, and
with phenol to prevent RNA degradation (Sambrook et al., 1989). Studies have shown
that treatment with CM can improve results obtained by fluorescence in situ hybridization
and by stopping processing of rRNA in cells, preserving RNA for analysis (Ouverney and
Fuhrman, 1997; Oerther et al., 2000). Any change in rRNA levels in CM-treated samples
would therefore be due to RNA degradation, while change in rRNA levels in
phenol-treated samples would be due to from production of new RNA. The use of these two
chemicals should allow us to identify instances of group-specific RNA degradation or
production in the samples. By testing samples stored for different time periods, we
attempted to quantify how the microbial community structure changed over time under
Materials and Methods
Sample Collection
Activated sludge samples were collected from the North Cary Water Reclamation
Facility (Cary, NC) on July 24, 2001 and from the Neuse River Wastewater Treatment
Plant (Raleigh, NC) on July 25, 2001. The North Cary wastewater treatment plant is
permitted to treat 20 million gallons of wastewater per day, and uses a Kruger A2O
process to perform nitrogen and phosphorous removal. The Raleigh wastewater
treatment plant is an activated sludge plant performing nitrogen and phosphorous
removal, and is permitted to treat 64 million gallons of wastewater per day.
One liter of activated sludge mixed liquor was taken from the aeration basin of
each plant. The master sample was taken back to the laboratory and 96 14-mL aliquots
were prepared from a well-mixed sample. These aliquots were centrifuged at 3220 x g
for 5 minutes. After decanting the liquid, RNase free water was added to the samples to a
final volume of 2 mL and the samples were transferred to 2.0 mL screwcap tubes. The
samples were centrifuged at 3300 x g for 5 minutes and remaining liquid was decanted.
Samples were then stored under one of 16 different regimens. All samples were
processed within one hour after collection.
Storage of Samples
Storage conditions were designed as a randomized complete block. To test the
effect of storage over time, samples were stored for 0, 24, 48, or 72 hours before being
“phenol”, “CM”, “4o”, and “RT” (or room temperature). There were 2-3 replicate samples within each treatment-time combination. A schematic representation of the
treatment regimens is shown in Figure 2.1.
Room Temperature samples. Room temperature (RT) samples were stored at
room temperature for 0, 24, 48 or 72 hours before being frozen.
Refrigerated samples. Refrigerated samples were stored in a 4oC refrigerator for 0, 24, 48 or 72 hours before being frozen.
Phenol samples. Phenol-treated samples were suspended in 1 mL phenol and
stored in a 4oC refrigerator for 0, 24, 48 or 72 hours until frozen.
Chloramphenicol samples. In the CM-treated samples, CM was added to a final
concentration of 200 µg/µL based on the original 14 mL sample (500 uL of 5.6
g/L CM was added to the samples following centrifugation). Treated samples
were stored in a 4oC refrigerator for 0, 24, 48 or 72 hours until frozen.
RNA extractions
RNA extractions were performed as described in Chapter 1.
Membrane Hybridizations
Quantitative membrane hybridizations were performed as described in Chapter 1.
Hybridizations were used to determine the rRNA fractions of the major Bacterial groups
in wastewater (the Alpha, Beta and Gamma Proteobacteria, the
(Manz et al., 1992; de los Reyes et al., 1997). Initial experiments also tested some
individual species—Gordonia amarae, Leucothrix mucor—but because levels of these
species were extremely low when compared with the larger groups, they are not reported
here and further experiments only tested the group-level probes. Table 2.1 shows the
probes used for each group of bacteria and the corresponding species that provided
reference RNA.
Statistical Analysis
Analyses were performed separately on each microbial group. The results were
compared using Analysis of Variance (ANOVA) and Tukey’s test. The analysis was
performed using SAS (SAS Institute, Cary, NC). For the ANOVA, each combination of
treatment and time was treated as a separate category and plant (i.e Raleigh or Cary) was
considered to be a random factor. If the ANOVA determined that change across the
samples was significant, individual results were compared using Tukey’s test.
Results
Figures 2.2-2.9 show the results of the quantitative membrane hybridizations.
The trends seen in the membrane hybridizations are summarized in Table 2.2. In all
cases, controls are the average of all 0 hr 4oC and RT samples. These samples were frozen immediately, and the results obtained from these samples should be representative
of the original microbial community. Because this effectively removed two of the sample
4oC / 0 hr / replicate 3 and Raleigh / 4oC / 24 hr / replicate 1) were accidentally combined during the extraction process and were not analyzed. This left two replicates in the
Raleigh / 4oC / 0 hr and /24 hr sample blocks, and three in all other blocks.
Table 2.2 shows that the levels of the bacterial groups tested vary between the two
plants. At both plants, Alpha Proteobacteria was the dominant phylogenetic group,
followed by Beta Proteobacteria. The trends of change in rRNA fractions of the major
groups are quite different in the samples taken from each plant. Over time, all microbial
groups tested increased in samples taken from the Raleigh plant and treated with phenol.
This is not the case for the corresponding samples from the Cary wastewater treatment
plant.
Because the samples taken from the two plants behaved differently, the samples
from each plant are discussed separately.
Cary, Alpha Proteobacteria
The results of the alpha Proteobacteria analysis on Cary samples are shown in
Figure 2.2. Levels of alpha Proteobacteria in CM-treated samples remain statistically
constant up to 48 hours and decrease between 48 and 72 hours. Alpha Proteobacteria in
phenol-treated samples are lower than control at all time periods tested. Refrigerated
samples show increased levels of alpha Proteobacteria RNA (relative to control) by 72
hours, and the levels of this group do not change significantly in samples stored at room
Raleigh, Alpha Proteobacteria
The results of the alpha Proteobacteria analysis on Raleigh samples are shown in
Figure 2.3. Samples treated with phenol and chloramphenicol and samples stored at
room temperature do not differ significantly from control. Refrigerated samples
contained significantly higher levels of alpha Proteobacteria RNA than control by 24
hours. Those levels then declined between 24 and 48 hours.
Cary, Beta Proteobacteria
The results of the Cary beta Proteobacteria experiment are shown in Figure 2.4.
Levels of beta Proteobacteria RNA remain approximately constant in CM-treated,
phenol-treated, and refrigerated samples. By 48 hours, levels of beta Proteobacteria RNA
in room temperature samples are significantly higher than control.
Raleigh, Beta Proteobacteria
The results of the beta Proteobacteria analysis on Raleigh samples are shown in
Figure 2.5. CM-treated, Refrigerated, and room temperature samples do not differ
significantly from control throughout the 72-hour period. The levels of beta
Proteobacteria RNA in phenol-treated samples increased by approximately 50% between
Cary, Gamma Proteobacteria
The results of this experiment are shown in Figure 2.6. Phenol-treated,
refrigerated, and room temperature samples do not differ significantly from control.
Levels of gamma Proteobacteria RNA in CM-treated samples decreased by 72 hours.
Raleigh, Gamma Proteobacteria
The results of this experiment are shown in Figure 2.7. Refrigerated and room
temperature samples do not differ from control. CM-treated samples show an increase by
72 hours. The levels of this group in phenol-treated samples had increased by
approximately 50% by 72 hours.
Cary, Mycolata
Levels of mycolata RNA in Cary samples are shown in Figure 2.8. The standard
deviations of these measurements were relatively large. No sample shows statistically
significant change.
Raleigh, Mycolata
Levels of mycolata RNA in Raleigh samples are shown in Figure 2.9. CM-treated
and room temperature samples do not differ significantly from control. Refrigerated
samples contain significantly lower levels of mycolata RNA that control at 48 and 72