Soil Fertility & Crop Nutrition
Potassium Rate and Application Effect on Flue-Cured Tobacco
Matthew C. Vann,* Loren R. Fisher, David L. Jordan, W. David Smith,
David H. Hardy, and Alexander M. Stewart
Published in Agron. J. 105:304–310 (2013) doi:10.2134/agronj2012.0259
Copyright © 2013 by the American Society of Agronomy, 5585 Guilford Road, Madison, WI 53711. All rights reserved. No part of this periodical may be reproduced or transmitted in any form or by any means, electronic or mechanical, including photocopying, recording, or any information storage and retrieval system, without permission in writing from the publisher.
P
otassium fertilizer is essential to the production ofhigh yielding, high quality fl ue-cured tobacco, with a healthy crop typically requiring roughly 100 kg K2O ha–1 from the soil for optimum growth (Raper and McCants, 1967). Tobacco, in general, is considered to be a luxury consumer of K+ (Raper and McCants, 1967), and K application is oft en two to three times that needed to obtain maximum yield (Sims, 1985). Furthermore, K defi ciencies have long been observed across a variety of soil types and growing conditions, and the overapplication of K fertilizer has been justifi ed on the belief that defi ciencies would be avoided and leaf and burn quality would improve (Collins and Hawks, 1993). Overapplication has traditionally been possible because of low input costs for fertilizers and liming materials; however, in recent years certain aspects of production have altered how tobacco producers address crop nutrition.
Th e fi rst major issue is the cost of fertilizer inputs, specifi cally K, which has increased by 292% since the year 2000 (Huang, 2012). As a result of increasing K prices, overapplication of fertilizer is no longer an option and growers must become more effi cient in making applications. Second, nearly 85% of all traditional tobacco producing soils have a high (Mehlich-3 P 61–120 g P m–3) or
very-high (Mehlich-3 P > 120 g P m–3) P index (Hardy et. al., 2012; Smith, 2011). Years of overapplication of P have led to high P-indices and additional P is not required on most tobacco soils (Smith, 2011). Producers are now able to decouple N, P, and K, and move away from complete fertilizers which have traditionally been used. With independent applications of N and K producers now have more alternatives for sources and application methods of both nutrients.
With changing fertilizer demand, tobacco producers have the option of applying K in broadcast applications before transplanting, banded applications at or just aft er transplanting, or in banded applications split at transplanting and layby (roughly 4–6 wk aft er transplanting). Each method has advantages and disadvantages that must be considered.
Banded, sidedress applications between transplanting and layby are common in most fl ue-cured tobacco operations (Tso, 1990c). Banded applications of K aft er transplanting are common because the nutrient is placed near the root zone, thus improving use effi ciency. Research conducted by Collins and Hawks (1993) shows a slight yield increase in band applications of K over broadcast applications. Band applications can be made anytime between transplanting and layby, with common applications being one or two bands at transplanting, one band 10 d aft er transplanting, or a split application of equal rates at transplanting and layby. Split applications of K were found to be more effi cient than one single band application on soil types that are highly leachable (San Valentin et al., 1978).
Broadcast application of complete fertilizers on fl ue-cured tobacco is no longer a common practice due to the risk of fertilizer salt damage from N placement (Tso, 1990c; Collins and Hawks, 1993). As a result of alternative fertilizer programs and to improve ABSTRACT
Research was conducted at two locations in 2009 and 2010 to evaluate the eff ect of various K rates and application methods on the yield and quality of fl ue-cured tobacco (Nicotiana tabacum L.). Treatments included fi ve rates of K from sulfate of potash magnesia (0–0–22): 0, 84, 140, 196, and 252 kg K2O ha–1 that were applied: broadcast 1 mo before transplanting, broadcast 1 wk before
transplanting, banded at transplanting, and a split application with one-half rate banded at transplanting followed by one-half rate banded at layby. Tissue samples were collected throughout the season at three separate growth stages: layby, topping, and aft er curing. Tissue samples were analyzed for total alkaloid and reducing sugars, N, P, K, and Mg content. Soil samples were collected the same day as K fertilizer application from plots not receiving supplemental K. Data were subjected to ANOVA using the PROC GLM procedure in SAS. Treatment means were separated using Fisher’s Protected LSD test at p ≤ 0.05. Application method and timing had no eff ect on any measured parameters; furthermore, crop yield and quality was not aff ected by K rates >0 kg K2O ha–1 at three
of four locations. It is likely that early broadcast applications of K2O with current rate recommendations would only be of concern with combinations of conditions that included coarse soil textures, low K indices, and/or excessive leaching rainfall.
M.C. Vann, L.R. Fisher, and D.L. Jordan, Dep. of Crop Science, North Carolina State Univ., 101 Derieux Place, Raleigh, NC 27695-7620; W.D. Smith, Associate Dean for Research, North Carolina State Univ., 201 Patterson Hall, Raleigh, NC 27695-7643; D.H. Hardy, Agronomic Division, North Carolina Dep. of Agriculture and Consumer Services, 4300 Reedy Creek Rd, Raleigh, NC 27607-6465; A.M. Stewart, Research Station Division, North Carolina Dep. of Agriculture and Consumer Services, 2 W. Edenton Street, Raleigh, NC 27601. Received 10 July 2012. *Corresponding author ([email protected]).
Abbreviations: OTRS, Oxford Tobacco Research Station; UAN, urea ammonium nitrate; UCPRS, Upper Coastal Plain Research Station.
operating effi ciency, growers have begun to broadcast K before forming plant beds and in some cases before fumigation. Soil fumigants are typically applied in the raised bed about 3 to 5 wk before transplanting. Allowing for uniform application before bedding, K application must take place a signifi cant amount of time before transplanting as well. In the time between K application and transplanting, there is potential for K to leach out of the rooting zone. Th e practice of broadcast application of K fertilizer is also an option for producers who do not apply soil fumigants. Potassium fertilizer can be broadcast and land can be prepared by creating beds just before transplanting. In both situations, the producers’ intentions are to complete the K application before transplanting, therefore reducing workloads as the season progresses. Th e broadcast application of K fi ts very well with new fertilizer programs that apply N and K independently to reduce risk of salt injury.
Past research provides inadequate details as to when and how to apply K in diff erent management systems. With newer, alternative fertilizer plans now being implemented by growers, information is needed to provide accurate K recommendations. Th e objective of this study was to determine if alternative application methods of K are acceptable in tobacco production, and to determine their eff ect on application rate.
METHODS AND MATERIALS Field Procedures
Th e experiments were conducted at the Upper Coastal Plain Research Station (UCPRS) near Rocky Mount, NC, and the Oxford Tobacco Research Station (OTRS) in Oxford, NC, in 2009 and at two separate locations at the UCPRS in 2010 (designated as UCPRS-1 and UCPRS-2). An additional test site at OTRS in 2010 was lost to the disease tobacco mosaic virus (TMV). Test sites were selected based on soil type, soil texture, and proximity to major fl ue-cured tobacco production regions (Table 1). Individual plots were four rows wide by 12.19 m long, with all four rows treated and the two center rows harvested for yield and quality. Individual plant spacing was 55 by 122 cm. Cultivars used in this study were NC 71 (Goldleaf Seed Company, Hartsville, SC) at the UCPRS and NC 297 (Goldleaf Seed Company, Hartsville, SC) at the OTRS. Diff erent cultivars were selected because of their popularity among producers (Fisher et al., 2009) and because of the need for specifi c disease resistance at both locations (Mila and Radcliff , 2011). Tobacco was produced using recommendations from the North Carolina Cooperative Extension Service, except for treatments imposed. Cured tobacco was weighed for yield and assigned a USDA
government grade. Each government grade has an associated grade index value which describes the leaf maturity and ripeness (Bowman et al., 1988). Additionally, each USDA grade has an associated monetary value; this value was multiplied by crop yield to establish overall crop value.
Field Conditions
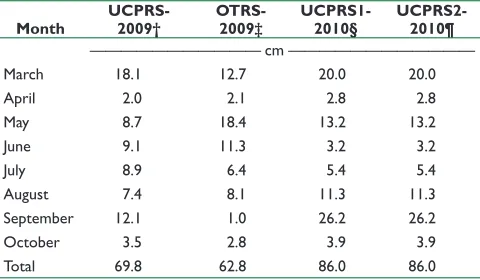
Field conditions (soil series, soil taxonomic class, pH, P-Index, and K-Index) and monthly rainfall are described by location in Tables 1 and 2. Treatments included 0, 84, 140, 196, and 252 kg K2O ha–1. Each rate was applied either broadcast 1 mo before transplanting, broadcast 1 wk before transplanting, banded at planting, or banded with one-half rate at transplanting and one-half rate at layby. Potassium application timings were chosen to represent diff erent crop management programs for producers. Applications made 1 mo before transplanting represent production systems in which producers would be applying a soil fumigant. Soil fumigants are applied roughly 1 mo before transplanting to avoid crop injury. Alternatively, applications made 1 wk before transplanting represent production systems where producers do not have a need to apply soil fumigants. Broadcast applications of K fertilizer occur before the formation of raised plant beds. Full rate applications made at transplanting as well as half-rate applications made at transplanting and half-rate applications made at layby are standard production practices which are common throughout tobacco-producing regions in the United States.
Transplanting dates, fertilizer application dates, and tissue sampling dates at each location are described in Table 3. Broadcast applications were made by hand before transplanting and Table 1. Soil series, soil taxonomic class, soil pH, P index, and K index at each location.
Location Soil series Soil taxonomic class pH† P Index† K Index†
mg dm3 cmol c kg–1 UCPRS-09‡ Goldsboro loamy sand fi ne-loamy, siliceous, subactive, thermic Aquic Paleudults 6.2 45.6 0.25 OTRS-09§ Helena sandy loam fi ne, mixed, semiactive, thermic Aquic Hapludults 5.8 49.2 0.19 UCPRS1-10¶ Norfolk loamy sand fi ne-loamy, kaolinitic, thermic Typic Kandiudults 5.8 162 0.30 UCPRS2-10# Goldsboro loamy sand fi ne-loamy, siliceous, subactive, thermic Aquic Paleudults 6.0 112.8 0.45
† Soil chemistry represents the upper 20 cm of the soil profi le. ‡ Upper Coastal Plain Research Station in 2009.
§ Oxford Tobacco Research Station in 2009. ¶ Upper Coastal Plain Research Station in 2010. # Upper Coastal Plain Research Station in 2010.
Table 2. Monthly total precipitation from pretransplant to harvest at each location.
Month UCPRS-2009† OTRS-2009‡ UCPRS1-2010§ UCPRS2-2010¶
——————————— cm ————————————
March 18.1 12.7 20.0 20.0
April 2.0 2.1 2.8 2.8
May 8.7 18.4 13.2 13.2
June 9.1 11.3 3.2 3.2
July 8.9 6.4 5.4 5.4
August 7.4 8.1 11.3 11.3
September 12.1 1.0 26.2 26.2
October 3.5 2.8 3.9 3.9
Total 69.8 62.8 86.0 86.0
incorporated into the soil using a fi eld cultivator. Posttransplanting applications were made with a single band application which was 12 cm away from the plant and 12-cm deep. Band applications were placed into a furrow created with a 140 Farmall tractor (Case International Harvester, Racine, WI). Following K application treated furrows were closed with single row rolling cultivators.
Tissues samples were collected at three growth stages: layby (when plants were roughly 38 cm tall), topping (just aft er fl ower was removed), and aft er curing (weighted composite sample
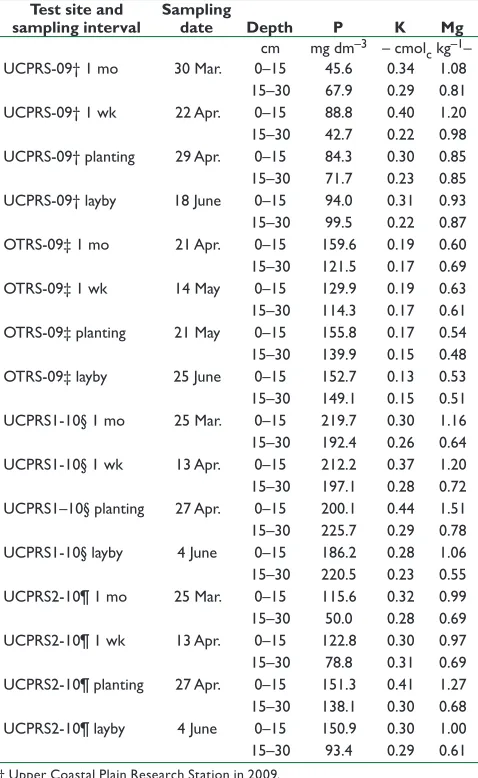
of all four harvested stalk positions). Sampling intervals were chosen because of the critical times they represent during the growing season. Layby occurs 4 to 6 wk aft er transplanting and is the last opportunity tobacco producers have to make fertilizer applications. Topping occurs 8 to 10 wk aft er transplanting and is the time when K defi ciencies are most oft en observed. Cured leaf samples were collected to determine fi nal nutrient content. Soil samples were collected from two depths (15 and 30 cm) at four separate intervals: 1 mo before transplanting, 1 wk before transplanting, at planting, and at layby. Soil sampling dates for each interval are described in Table 4.
All K was supplied as sulfate of potash magnesia (0–0–22) (K-Mag, Th e Mosaic Company, Plymouth, MN). Sulfate of potash magnesia also supplied Mg (11%) and S (22%), and rates were chosen that ensured adequate amounts of both nutrients for plant use. Nitrogen was supplied in split applications from 30% urea ammonium nitrate (UAN) applied at a total rate of 78 kg N ha–1 at the UCPRS and from calcium nitrate (15.5–0–0) applied at a total rate of 67 kg N ha–1 at the OTRS.
Analytical Procedures Total Alkaloids and Reducing Sugars
Total alkaloids and reducing sugars were determined by the Noth Carolina State University Tobacco Analytical Services Lab on campus. Fift y-gram cured leaf samples were prepared for each plot by compositing cured leaf from each stalk position on a weighted-mean basis. Oven-dried samples were ground to pass through a 1-mm sieve and analyzed for percent total alkaloids and percent reducing sugars using the method of Davis (1976).
Nitrogen, Phosphorus, Potassium, and Magnesium Percent N in the leaf tissue was determined by dry combustion using the method of Plank (1992) using a PerkinElmer PE 2400 elemental analyzer (PerkinElmer Inc., Waltham, MA). Percent P, K, and Mg in the leaf tissue was determined using the method of Plank (1992) using a PerkinElmer Optima 2000 DV elemental analyzer (PerkinElmer Inc., Waltham, MA).
Soil Samples
Soil samples were analyzed at the North Carolina Department of Agriculture and Consumer Services Agronomic Lab in Raleigh, NC. Samples were analyzed for P, K, Ca, Mg, S, Na, Mn, Cu, and Zn by means of Mehlich-3 extractant using inductively coupled argon plasma spectroscopy on a volume basis (Mehlich, 1984a). Cation exchange capacity (CEC) was determined by summation of basic cations (excluding Na) and buff er acidity (Mehlich et al., 1976). Soil Table 3. Dates for transplanting, fertilizer application, and tissue sampling at each location.
Location Transplanting
Fertilizer application Tissue sampling
Broadcast 1
mo Broadcast 1 wk transplantingBanded at Banded at layby Layby Topping After curing
UCPRS-09† 29 Apr. 30 Mar. 22 Apr. 29 Apr. 18 June 18 June 16 July 15 Sept.
OTRS-09‡ 21 May 21 Apr. 14 May 21 May 25 June 25 June 31 July 31 July
UCPRS1-10§ 27 Apr. 25 Mar. 13 Apr. 27 Apr. 4 June 4 June 28 June 10 Nov.
UCPRS2-10¶ 27 Apr. 25 Mar. 13 Apr. 27 Apr 4 June 4 June 28 June 10 Nov.
† Upper Coastal Plain Research Station in 2009. ‡ Oxford Tobacco Research Station in 2009. § Upper Coastal Plain Research Station in 2010. ¶ Upper Coastal Plain Research Station in 2010.
Table 4. Composite soil analysis of plots not receiving supple-mental potassium.
Test site and
sampling interval Sampling date Depth P K Mg
cm mg dm–3 – cmol c kg–1– UCPRS-09† 1 mo 30 Mar. 0–15 45.6 0.34 1.08
15–30 67.9 0.29 0.81 UCPRS-09† 1 wk 22 Apr. 0–15 88.8 0.40 1.20 15–30 42.7 0.22 0.98 UCPRS-09† planting 29 Apr. 0–15 84.3 0.30 0.85 15–30 71.7 0.23 0.85 UCPRS-09† layby 18 June 0–15 94.0 0.31 0.93 15–30 99.5 0.22 0.87 OTRS-09‡ 1 mo 21 Apr. 0–15 159.6 0.19 0.60 15–30 121.5 0.17 0.69 OTRS-09‡ 1 wk 14 May 0–15 129.9 0.19 0.63 15–30 114.3 0.17 0.61 OTRS-09‡ planting 21 May 0–15 155.8 0.17 0.54 15–30 139.9 0.15 0.48 OTRS-09‡ layby 25 June 0–15 152.7 0.13 0.53 15–30 149.1 0.15 0.51 UCPRS1-10§ 1 mo 25 Mar. 0–15 219.7 0.30 1.16 15–30 192.4 0.26 0.64 UCPRS1-10§ 1 wk 13 Apr. 0–15 212.2 0.37 1.20 15–30 197.1 0.28 0.72 UCPRS1–10§ planting 27 Apr. 0–15 200.1 0.44 1.51 15–30 225.7 0.29 0.78 UCPRS1-10§ layby 4 June 0–15 186.2 0.28 1.06 15–30 220.5 0.23 0.55 UCPRS2-10¶ 1 mo 25 Mar. 0–15 115.6 0.32 0.99 15–30 50.0 0.28 0.69 UCPRS2-10¶ 1 wk 13 Apr. 0–15 122.8 0.30 0.97 15–30 78.8 0.31 0.69 UCPRS2-10¶ planting 27 Apr. 0–15 151.3 0.41 1.27 15–30 138.1 0.30 0.68 UCPRS2-10¶ layby 4 June 0–15 150.9 0.30 1.00 15–30 93.4 0.29 0.61
pH was determined on a 1:1 soil/water volume ratio. Humic matter determinations were made using a NaOH digestion with colorimetric determination (Mehlich, 1984b).
Statistical Analysis
Treatments were replicated four times and arranged in a randomized complete block design. Data for crop yield, crop quality, crop value, percent total alkaloids, percent reducing sugars, and elemental leaf content were subjected to ANOVA using the PROC GLM procedure in SAS (SAS version 9.1, SAS Institute, Cary, NC). Treatment means were separated using Fisher’s Protected LSD test at p≤ 0.05.
RESULTS
A signifi cant location eff ect was noted across all parameters because of varying soil types and growing conditions; however, the interaction of location × rate × application method was not signifi cant and data are pooled where appropriate (Table 5).
Physical Characteristics, Chemical Characteristics, and Crop Value Yield
Th e response of leaf yield to increasing rates of K2O was diff erent at one location (Table 5). Th e only location that demonstrated a yield response was the 2009 OTRS site, a trend is diffi cult to establish based on application rate alone, but a response was observed as rates were increased to 252 kg K2O ha–1 at this site (Table 6). At all other locations, 0 kg K2O ha–1 was adequate. Th e lack of response to additional units of K2O is possibly due to soils having medium to high residual K (Table 1), which is common on >60% of tobacco producing soils in the state (Smith, 2011), as well as adequate soil moisture throughout the growing season (Table 2).
Grade Index
Th e quality of cured tobacco was not signifi cantly aff ected by increasing application rates of K2O from 0 to 252 kg K2O ha–1 (Tables 5 and 7). Results are similar to those from Chaplin and Miner (1980) and Collins and Hawks (1993) that did not consistently fi nd a correlation between K2O rate and leaf quality when rates in excess of those needed for maximum yield were used.
Crop Value
Th e value of cured tobacco was not aff ected by increasing rates of K2O (Tables 5 and 7). Results are similar to Collins and Hawks (1993) who could not establish a correlation between increased rates of K2O and leaf quality, which would increase value.
Total Alkaloids
Total alkaloid accumulation in cured leaves was not aff ected by K2O rate (Tables 5 and 7). Results are similar to those by Woltz et
Table 5. Probability > F values for yield, quality, value, total alkaloids, reducing sugars, and elemental leaf content.
Variable Location Application× Rate × ApplicationRate × Location × Rate ApplicationLocation × Rate Application
Yield 0.8086 0.8236 0.0202* 0.9788 0.0361* 0.9900
Grade index 0.5649 0.5869 0.7780 0.6872 0.5591 0.5936
Crop value 0.9429 0.8971 0.2356 0.9067 0.4577 0.6332
Total alkaloids 0.4944 0.4184 0.0528 0.1010 0.9177 0.6730
Reducing sugars 0.3991 0.8189 0.2936 0.1002 0.0238* 0.4340
N-layby 0.8889 0.1214 0.4202 0.4851 0.1477 0.5720
N-topping 0.9713 0.9809 0.3896 0.3775 0.9573 0.0643
N-after curing 0.7740 0.5395 0.3187 0.5575 0.0964 0.9103
P-layby 0.5589 0.6626 0.2123 0.9247 0.1385 0.1125
P-topping 0.3110 0.1928 0.7479 0.0204* 0.5022 0.1264
P-topping-UCPRS-09 – 0.7555 – – 0.4261 0.1200
P-topping-OTRS-09 – 0.1544 – – 0.7869 0.0891
P-topping-UCPRS1-10 – 0.7926 – – 0.4195 0.1995
P-topping-UCPRS2-10 – 0.8363 – – 0.1546 0.0658
P-after curing 0.9443 0.5425 0.5239 0.5852 0.3129 0.0323*
K-layby 0.7917 0.1237 0.6114 0.0015* 0.0584 0.3047
K-topping 0.4049 0.5651 0.6321 0.0343* 0.4800 0.1848
K-after curing 0.4558 0.7495 0.0319* 0.3898 <0.0001* 0.1847
Mg-layby 0.3930 0.4213 0.2272 0.1936 0.0054* 0.0101*
Mg-topping 0.3574 0.4499 0.6098 0.1131 0.6051 0.2137
Mg-after curing 0.2069 0.5926 0.5374 0.2082 0.0113* 0.1435
* Signifi cant at the 0.05 probability level.
Table 6. Yield response to increasing rates of K2O across all
treatments at individual locations.†
K2O Rate UCPRS-09‡ OTRS-09§ UCPRS1-10¶ UCPRS2-10#
————————————— kg ha–1—————————————
0 3364a 3428ab 3374a 3260a
84 3331a 3252b 3411a 3405a
140 3239a 3385ab 3387a 3404a
196 3183a 3234b 3514a 3206a
252 3126a 3644a 3627a 3422a
† Means followed by the same letter within the same category are not signifi -cantly different.
al. (1949), Elliot (1968), and Chaplin and Miner (1980) who could not establish a correlation between increased rates of K2O and total alkaloid content. Total alkaloids are typically only infl uenced by K2O rate when a corresponding yield aff ect is observed (Leggett et al., 1977; Chaplin and Miner, 1980).
Reducing Sugars
Reducing sugar content was aff ected by increasing rates of K2O (Table 5). As rates of K2O increased, the reducing sugar content of cured tobacco slightly decreased (Table 7); however, reducing sugar content is within the established range for fl ue-cured tobacco. Th ese fi ndings are in confl ict with Woltz et al. (1949), Elliot (1968), Chaplin and Miner (1980), and Tso (1990a) who could not establish a correlation between increased rates of K2O and reducing sugar content.
Elemental Leaf Content
Elemental leaf content for N, P, K, and Mg was measured at three separate intervals during the growing season: at layby, at topping, and aft er curing.
Nitrogen
Neither application method or application rate of K2O had an eff ect on total N content in leaf tissue at any sampling
interval (Table 5). Th is is in confl ict with Tso (1990a) who reported that as rates of K2O increase, total N content is decreased. Overall, additional K did not decrease the uptake of N from the soil which would have decreased overall N content in plant tissue.
Phosphorus
Application method of K2O had a signifi cant eff ect on P content in leaf tissue at topping when all locations are pooled (Table 5); however, once each test site was analyzed individually eff ects are not signifi cant (Table 5). Application method of K2O also had a signifi cant eff ect on P content in leaf tissue aft er curing (Table 5). Th e range of P content aft er curing was 0.21 to 0.24% (data not shown), which is not agronomically signifi cant because P content at each interval is above established defi ciency level of 0.12% for leaf tissue (Campbell, 2009) and therefore was not a limiting factor.
Potassium
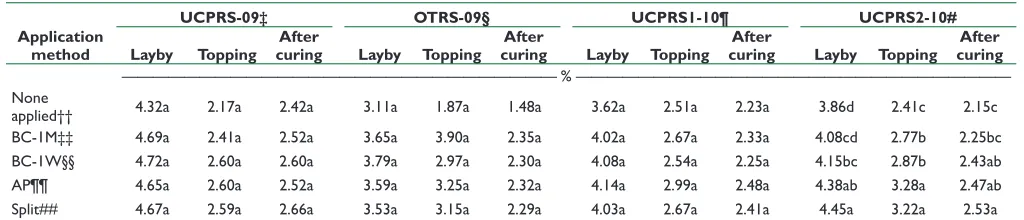
An application method response was observed at all sampling intervals at UCPRS2-10 (Tables 5 and 8). Alternatively, a rate response in K leaf content was observed aft er curing at three locations (Tables 5 and 9). Establishing a trend for application methods is diffi cult where a response was observed; however, K content tends to increase when the nutrient is applied closer to transplanting (Table 8). Potassium rate had a signifi cant eff ect on elemental leaf content aft er curing at UCPRS-09, OTRS-09, and UCPRS1-10 (Table 9). Elemental K content tends to increases as rates of K2O increase to 196 kg K2O ha–1 (Table 9). Overall, K content was suffi cient at all rates and application methods to maximize yield (Tables 8 and 9), and elemental leaf content at each interval was above the established defi ciency level of 1.00% (Flower, 1999). No visual K defi ciency symptoms were observed in this study, thus furthering the justifi cation for lower rates of applied K. Th e results are in agreement with Chaplin and Miner (1980) who determined that K content in cured tobacco leaves increased as rates of K2O increased.
Table 7. Physical and chemical response to increasing rates of
K2O. Data are pooled over all locations.†
K2O rate index‡Grade Value alkaloids§Total Reducing sugars§
kg ha–1 $ ha–1 %
————-0 80a 11287a 4.06a 12.39ab
84 79a 10502a 4.04a 12.65a
140 79a 10500a 4.07a 11.97ab
196 79a 10588a 4.08a 11.78b
252 78a 10914a 4.06a 11.84b
† Means followed by the same letter within the same category are not signifi -cantly different.
‡ Grade index is a measure of tobacco quality on a ranking scale of 1 to 100, with 100 having the highest quality.
§ Total alkaloid and reducing sugar data were collected from a weighted compos-ite sample of all four harvested stalk positions.
Table 8. Leaf K content by application method at layby, topping, and after curing at individual locations.†
Application method
UCPRS-09‡ OTRS-09§ UCPRS1-10¶ UCPRS2-10#
Layby Topping curingAfter Layby Topping curingAfter Layby Topping curingAfter Layby Topping curingAfter
———————————————————————————— % ———————————————————————————— None
applied†† 4.32a 2.17a 2.42a 3.11a 1.87a 1.48a 3.62a 2.51a 2.23a 3.86d 2.41c 2.15c
BC-1M‡‡ 4.69a 2.41a 2.52a 3.65a 3.90a 2.35a 4.02a 2.67a 2.33a 4.08cd 2.77b 2.25bc
BC-1W§§ 4.72a 2.60a 2.60a 3.79a 2.97a 2.30a 4.08a 2.54a 2.25a 4.15bc 2.87b 2.43ab
AP¶¶ 4.65a 2.60a 2.52a 3.59a 3.25a 2.32a 4.14a 2.99a 2.48a 4.38ab 3.28a 2.47ab
Split## 4.67a 2.59a 2.66a 3.53a 3.15a 2.29a 4.03a 2.67a 2.41a 4.45a 3.22a 2.53a
† Means followed by the same letter within the same category are not signifi cantly different. ‡ Upper Coastal Plain Research Station in 2009.
§ Oxford Tobacco Research Station 2009. ¶ Upper Coastal Plain Research Station 2010. # Upper Coastal Plain Research Station 2010.
†† None applied = control where 0 kg K2O ha–1 was applied.
‡‡ BC-1M = all potassium broadcast applied 1 mo before transplanting. §§ BC-1W = all potassium broadcast applied 1 wk before transplanting. ¶¶ AP = all potassium band applied at transplanting.
Magnesium
At layby, both application rate of potassium magnesium sulfate and application method had a signifi cant eff ect on elemental Mg leaf content (Table 5). As rates of applied potassium magnesium sulfate increased Mg leaf content increased; however, the range of Mg content was 0.52 to 0.57% (data not shown) which does not have an agronomic impact on the crop. Potassium magnesium sulfate applied at planting contained the highest amount of Mg in leaf tissue with 0.57% (data not shown); all other intervals contained 0.52 to 0.55% (data not shown). Aft er curing, leaf Mg content was only aff ected by application rate of potassium magnesium sulfate (Table 5). Magnesium content in the cured leaf was not signifi cantly improved above 140 kg K2O ha–1. Th e range of Mg content aft er curing was 0.60 to 0.63% (data not shown), which is not agronomically signifi cant because the nutrient was not limiting and leaf tissue from plots with the lowest Mg content were above the established defi ciency level of 0.15% (Tso, 1990b).
Soil Analysis Soil Analysis
Soil samples were only taken from plots receiving 0 kg K20 ha–1 and sampling occurred each time K applications were made to other plots. Two samples were taken, one from 0 to 15 cm and another from 15 to 30 cm. Soil samples were not statistically analyzed because they were not taken across all treatments; however, it is worth noting the data for each test site. Variability in soil fertility was observed across all locations (Table 4). Although there are no specifi ed critical nutrient levels for tobacco, it is possible that Piedmont soils with <30 g m–3 of P and Coastal Plain soils with <50 g m–3 of P may exhibit defi ciency symptoms without supplemental fertilization (Hardy et. al., 2012). Soils with <0.50 cmolc kg–1 of K and 0.25 cmol
c kg–1 of Mg may also exhibit defi ciencies when no supplemental fertilizer is applied (Hardy et. al., 2012). Soil samples taken from control plots during research were used to make generalizations about individual test site characteristics.
For all test sites, soil P and Mg levels were suffi cient for optimum tobacco growth for the entire season (Table 4). Before transplanting at UCPRS-09 soil P levels were below the critical level; however, at the time of transplanting soil P was adequate (Table 4). Visual P and Mg defi ciency symptoms were not observed at any test site. Soil K levels were below the previously mentioned limit of 0.50 cmolc kg–1 at all test sites (Table 4); however, visual
defi ciency symptoms were not observed. Soil fertility was adequate all season for the respective nutrients.
DISCUSSION
Application method and application timing had no signifi cant agronomic eff ect on yield, quality, value, or any measured leaf constituents. In both years, crop quality was not aff ected by application rate and application method, thus demonstrating that under conditions present at test sites alternative application methods are acceptable. Leaf yield demonstrated a favorable response to 252 kg K2O ha–1 at OTRS-09; however, at all other locations 0 kg K2O ha–1 was enough to produce favorable yields with all other measured parameters remaining unaff ected. Th e 0 kg K2O ha–1 rate is adequate, but according to the state soil testing lab a minimum rate of 84 kg K2O ha–1 would be recommended to overcome the possibility of unfavorable growing conditions as well as to prevent the mining of soil nutrients. Under the environmental conditions of these experiments, 84 kg K2O ha–1 applied broadcast 1 mo before planting, broadcast at planting, banded at planting, or applied in split applications provided adequate amounts of K to ensure suffi cient yield and quality at all locations. It is likely that early broadcast applications of K2O with current rate recommendations would only be of concern with combinations of conditions that included coarse soil textures, low residual soil K, and/or excessive leaching rainfall.
Soil texture and depth to clay have a major impact on K application rates, and both must be considered. Test sites for this study were selected based on soil type and texture, and these characteristics had a signifi cant eff ect on crop response to K application. Th e loss of K+ is also of concern on coarse-textured soils similar to the Norfolk soil series at UCPRS-1. Coarse textured soils have lower cation exchange capacities and monovalent cations are oft en lost from the rooting zone in the event of leaching rainfall. However, if the depth to clay is <25 cm it is likely that K+ lost to leaching is held in the clay subsoil where it can be used once adequate root growth has occurred. It is advisable for producers to take soil samples down to 25 cm to provide a reasonable estimate of the nutrient content in the soil. Subsoil K that remains unaccounted for is the reason why responses to K application are not observed, even when a soil test indicates it should. Additionally, coarse-textured soils have diffi culty maintaining adequate soil moisture during periods of drought or extended dry conditions. Soil moisture facilitates diff usion of the K+ ion from the point of application to the root zone, and in the absence of adequate moisture diff usion is greatly inhibited.
Th e considerations of soil texture and depth to clay are extremely important when making K recommendations and fi t very well with reports from Denton et al. (1987). Denton et al. (1987) report fi ndings similar to those from this study for fl ue-cured tobacco produced across a variety of soil textures. Optimum rates of K2O were found to diff er signifi cantly among Fertility Capability Classifi cation (FCC) soil groups; however, the highest optimum rates were on soils with a sand or loamy sand surface where the A and E horizons were >0.5 m thick (Denton et al., 1987). Alternatively, the lowest optimum K rates reported by Denton et al. (1987) were on soils with thin, loamy surfaces, which indicate a relatively shallow depth to clay. As previously mentioned, K+ can leach from the upper soil profi le when cation exchange capacity is low, such as with a sandy topsoil; however, if
Table 9. Leaf K content response to increasing rates of K2O
after curing at individual locations.†
K2O rate UCPRS-09‡ OTRS-09§ UCPRS1-10¶ UCPRS2-10#
kg ha–1 —————————– % ————————————
0 2.41b 1.48c 2.22b 2.15a
84 2.37b 2.13b 2.13b 2.40a
140 2.53ab 2.36ab 2.32ab 2.37a
196 2.80a 2.29ab 2.63a 2.43a
252 2.59ab 2.48a 2.39ab 2.47a
† Means followed by the same letter within the same category are not signifi -cantly different.
the depth to clay is <25 cm it is likely that K+ lost to leaching is held in the clay subsoil where it can be used once adequate root growth has occurred. Th e subsoil K is more accessible to tobacco plants on soils with thin, loamy surfaces than on soils with thick, sandy surfaces due to the increased depth to the B horizon (Denton et al., 1987). Ultimately, responses to increased rates of K2O would be expected under these conditions as a result of compensation for the loss of K+ due to leaching.
Additionally, the independent application of K works extremely well for producers using alternative fertility programs. As mentioned previously, additional application of P is not necessary on 85% of the soils used for tobacco production in the state (Smith, 2011), and as a result producers can decouple complete N–P–K fertilizers and apply N and K independently of one another. Th is has allowed producers to explore alternate sources for both nutrients. Sulfate of potash magnesia fertilizer (0–0–22) has gained popularity as a result of it being a cheaper source of K than when supplied in a complete fertilizer and because of the additional Mg and S it supplies. Also, as a part of alternative fertility programs, liquid N (28% UAN, 30% UAN, and 32% UAN) sources are now being implemented as the only source of N for the entire growing season by many producers. Liquid N sources are oft en cheaper than other N sources used in tobacco production, and are easier to apply for producers with experience applying them to other crops.
CONCLUSION
Applying K2O independent of other nutrients, as done in this study, fi ts extremely well with alternative fertilizer plans that fl ue-cured tobacco producers are now implementing. Furthermore, lower K recommendations and alternative fertilizer management plans are suitable for producers when both residual soil K as well as soil texture are considered. Early broadcast applications of K2O with current rate recommendations would only be of concern with combinations of conditions that included coarse soil textures, low K indices, and/or excessive leaching rainfall. Th ere is great potential for producers on fi ne- or medium-textured soils to reduce K2O rates and apply K2O through diff erent methods without limiting yield and quality, thus reducing workloads and creating larger returns.
REFERENCES
Bowman, D.T., A.G. Tart, E.A. Wernsman, and T.C. Corbin. 1988. Revised North Carolina grade index for fl ue-cured tobacco. Tob. Sci. 32:39–40. Campbell, C.R. 2009. Harvesting tobacco based on tissue analysis. North
Caro-lina Dep. of Agriculture and Consumer Serv., Raleigh. www.ncagr.gov/ agronomi/pdffi les/tobaccopta703.pdf (accessed 2 June 2011).
Chaplin, J.F., and G.S. Miner. 1980. Production factors aff ecting the chemical components of the tobacco leaf. In: R.H. Martin et al., editors. Th e 34th Tobacco Chemists’ Research Conference: Chemical, Physical, and Produc-tion Aspects of Tobacco and Smoke, Richmond, VA. 27 Oct. 1980. North Carolina State Univ., Raleigh. p. 3–63.
Collins, W.K., and S.N. Hawks. 1993. Fertilization. In: W.K. Collins and S.N. Hawks, editors, Principles of fl ue-cured tobacco production. 3rd ed. Hawks and Collins, Raleigh, NC. p. 97–140.
Davis, R.E. 1976. A combined automated procedure for the determination of reducing sugars and nicotine alkaloids in tobacco products using a new reducing sugar method. Tob. Sci. 20:139–144.
Denton, H.P., G.F. Peedin, S.N. Hawks, and S.W. Buol. 1987. Relating the fertility capability classifi cation system to tobacco response to potas-sium fertilization. Soil Sci. Soc. Am. J. 51:1224–1228. doi:10.2136/ sssaj1987.03615995005100050024x
Elliot, J.M. 1968. Eff ect of applied potassium on certain agronomic, chemical, and physical characteristics of fl ue-cured tobacco. Tob. Sci. 12:151–157. Fisher, L.R., W.D. Smith, G. Tart, and K. Barnes. 2009. Selecting a variety. In: L.R.
Fisher, editor, North Carolina State University: Flue-cured tobacco guide 2009. AG-187 (Revised ed.). North Carolina Coop. Ext., Raleigh. p. 19–43. Flower, K.C. 1999. Field practices. In: L.D. Davis, and M.T. Nielson, editors,
Tobacco: Production, chemistry, and technology. Blackwell Sci., London. p.76–103.
Hardy, D.H., M.R. Tucker, and C.E. Stokes. 2012. Crop fertilization based on North Carolina Soil Tests Circular no. 1. North Carolina Dep. of Agric. and Consumer Serv., Raleigh. www.ncagr.gov/agronomi/pdffi les/obook.pdf (accessed 29 Oct. 2012).
Huang, W. 2012. Fertilizer use and price. USDA, Washington, DC. www.ers. usda.gov/Data/FertilizerUse/ (accessed 6 July 2012).
Leggett, J.E., J.L. Sims, D.R. Gossett, U.R. Pal, and J.F. Benner. 1977. Potassium and magnesium nutrition eff ects on yield and chemical composition of bur-ley tobacco leaves and smoke. Can. J. Plant Sci. 57:159–166. doi:10.4141/ cjps77-023
Mehlich, A. 1984a. Mehlich-3 soil test extractant: A modifi cation of Mehlich-2 extractant. Commun. Soil Sci. Plant Anal. 15(12):1409–1416. doi:10.1080/00103628409367568
Mehlich, A. 1984b. Photometric determination of humic matter in soils, a proposed method. Commun. Soil Sci. Plant Anal. 15(12):1409–1416. doi:10.1080/00103628409367568
Mehlich, A., S.S. Bowling, and A.L. Hatfi eld. 1976. Buff er pH acidity in relation to nature of soil acidity and expression of lime requirement. Commun. Soil Sci. Plant Anal. 7(3):253–263. doi:10.1080/00103627609366638
Mila, M., and J. Radcliff . 2011. Managing diseases. In: L.R. Fisher, editor, North Carolina State University: Flue-cured tobacco guide 2011. AG-187 (Revised ed.). North Carolina Coop. Ext., Raleigh. p. 133–166.
Plank, C.O. (1992). Plant analysis reference procedures for the southern region of the united states. (No. 368). Th e Georgia Agric. Exp. Stations and College of Agric. and Environ. Sciences, Athens.
Raper, C.D., and C.B. McCants. 1967. Nutrient accumulation in fl ue-cured tobacco. Tob. Sci. 10:109.
San Valentin, G.O., W.K. Robertson, J.T. Johnson, and W.W. Weeks. 1978. Eff ect of slow release fertilizer on fertilizer residues and on yield and composition of fl ue-cured tobacco. Agron. J. 70:345–348. doi:10.2134/agronj1978.000219 62007000020030x
Sims, J.L. 1985. Potassium nutrition of tobacco. In: R.D. Munson, editor, Potas-sium in agriculture. ASA, CSSA, and SSSA, Madison, WI. p. 1023–1043. Smith, W.D. 2011. Managing nutrients. In: L.R. Fisher, editor, North Carolina
State University: Flue-cured tobacco guide 2011. AG-187 (Revised ed.). North Carolina Coop. Ext., Raleigh. p. 67–82.
Tso, T.C. 1990a. Interrelationship among plant-leaf-smoke. In: T.C. Tso, editor, Production, physiology, and biochemistry of tobacco plant. IDEALS, Inc., Beltsville, MD. p. 3–32.
Tso, T.C. 1990b. Nutrition-minor elements and heavy metals. In: T.C. Tso, editor, Production, physiology, and biochemistry of tobaco plant. IDEALS, Inc., Beltsville, MD. p. 313–368.
Tso, T.C. 1990c. Soil and fertilizer. In: T.C. Tso, editor, Production, physiology, and biochemistry of tobacco plant. IDEALS, Inc., Beltsville, MD P. 75–82. Woltz, W.G., W.A. Reid, and W.E. Colwell. 1949. Sugar and nicotine in cured