University of South Carolina
Scholar Commons
Theses and Dissertations
1-2013
A Method for Evaluating Power Generation
Concepts Considering the Optimal Concept of
Operations
Tianlei Zhang
University of South Carolina - Columbia
Follow this and additional works at:https://scholarcommons.sc.edu/etd
Part of theElectrical and Computer Engineering Commons
This Open Access Dissertation is brought to you by Scholar Commons. It has been accepted for inclusion in Theses and Dissertations by an authorized administrator of Scholar Commons. For more information, please [email protected].
Recommended Citation
A
M
ETHOD FORE
VALUATINGP
OWERG
ENERATIONC
ONCEPTSC
ONSIDERING THEO
PTIMALC
ONCEPT OFO
PERATIONSby
Tianlei Zhang
Bachelor of Science Xi’an Jiaotong University, 2006
Submitted in Partial Fulfillment of the Requirements
For the Degree of Doctor of Philosophy in
Electrical Engineering
College of Engineering and Computing
University of South Carolina
2013
Accepted by:
Roger A. Dougal, Major Professor
Charles W. Brice, Committee Member
Herbert L. Ginn III, Committee Member
Edward P. Gatzke, Committee Member
D
EDICATIONA
CKNOWLEDGEMENTSMy sincere acknowledgement goes to my advisor, Dr. Roger Dougal. His support
and instruction initiated my courage and belief to step into the world of research. His
unending guidance and valuable advices have helped me become a professional engineer
with the ability to explore wider and deeper knowledge. I am really grateful to him for
giving me the opportunity to realize my doctoral degree. More importantly, I would like
to thank him for teaching me the thinking of engineers, the altitude towards research, and
the skills of technical presentation, which are more important than a diploma and will
affect my career development.
I would like to express my gratitude to my dear committee members, Dr. Charles
Brice, Dr. Herbert Ginn, and Dr. Edward Gatzke. All of them provided invaluable
feedback and suggestions that kept my research work on the right track.
I am very thankful to all the EE faculties and administrative staffs. Especially, I
would like to thank Richard Smart for his valuable feedbacks and help with my writing
and presentation. I would like to thank Hope Johnson and Valuncha Paterson for their
great assistance and support during my study at USC.
I would like to thank all my fellows in Dr. Dougal’s research group, Asif Anwar,
Paul Young, Blanca Correa, Pietro Cairoli, Huaxi Zheng, Ugo Ghisla, and Dan Li. They
provided so many informative discussions and suggestions that made my research easier
such a friendly atmosphere with multi-cultural communications. I have learned so much
from all these friends in USC and wish to keep the friendship forever.
My special acknowledgement goes to all my precious friends that I met in
Columbia, SC. I specially want to thank Ron and Marianne Parker for their love, care,
and encouragement all these years. They made my life filled with parents’ love even
when I was so far away from my family. I would like to thank Bill Porter for his
friendship, help, and support. He brought the most amazing grace into my life that I
would keep pursuing. I would also like to give thanks to all my Chinese friends. They
made my life in Columbia colorful, meaningful, and memorable. I was so blessed to have
them all.
Last but not least, my deepest gratitude goes to my loving parents, Yongge Zhang
and Jie Bai. Thank you for your unconditional love and support when I made my decision
to fly thousands of miles away from you to pursue the Ph.D. in the US. Thank you for
your faith in me and your encouragement to let me realize my dreams without worries. I
am very thankful with my grandparents and all my families, especially my aunt, Ling
A
BSTRACTWhen trying to select an appropriate power generation plant for a micro-grid
power distribution system like an electric ship, designers must consider both the physical
characteristics (e.g., weight, volume, power ratings) and performance characteristics
(e.g., fuel consumption, quality of service) of all the design alternatives. Comparing the
design alternatives in terms of the physical characteristics is relatively straightforward,
but in terms of performance characteristics each design alternative has to be evaluated
within its own optimal performance points to make a fair comparison. However, at
present no effective method or software tools exist to enable this evaluation at the earliest
design stage.
To address this problem, we develop a concept evaluation method to determine
the optimized power system concept of operations (CONOPS). Incorporating this method
into the power generation plant development allows the design alternatives with
undesirable performance to be removed from consideration, and ensures a high level of
confidence that no quasi-optimal alternative is eliminated. The CONOPS in this
dissertation takes into account the operating setpoints of the generating units on the
primary power distribution buses. The optimality of a CONOPS is assessed with respect
to its yielded system performance metrics, namely, fuel consumption and the quality of
service (QOS). These two are paramount to the operating economy and mission success
design (SBD) of a shipboard power system to demonstrate its effectiveness. Research is
performed using a three step process.
First, we identify the full set of design variables that is applicable to generic
power generation and distribution architectures, and use it to formulate the optimization
problems of the CONOPS. The optimization problems fit both ac and dc distribution
architecture and include the parameters that we identify as essential to describe the
architecture. Also, we develop two QOS metrics to investigate the different aspects of
system reliability: failure probability, and failure magnitude and duration.
Second, we develop and improve a single-objective particle swarm optimization
(SOPSO) and multi-objective particle swarm optimization (MOPSO) to solve the
optimization problems of the CONOPS. Both are able to provide enhanced capability and
reliability of searching for the global optimum as compared with the previously reported
PSOs. For a given system concept and mission (i.e. a description of loading conditions),
the results derived by the SOPSO can rapidly reveal the performance tradeoffs of the
CONOPS and investigate how the definitions of the performance metrics affect the
optimal design of CONOPS. The results derived by the MOPSO, in contrast, help
designers identify the quasi-optimal set of design alternatives during SBD with a very
high confidence level.
Third, in order to generalize the formulation process of the optimization problems
for generic primary generation and distribution architectures and different expressions of
the performance metrics, we develop an optimization structure based on the concept of
control architecture. We define five broad categories of data to describe the essential
micro-grid power system application. We also identify the coupling relationship of these
categories of data to standardize the co-optimization algorithm of the optimization
problems. Therefore, we only need to develop one coding infrastructure that can be
applicable to a wide range of design scenarios. In addition, we develop a hierarchical data
structure to address the software implementation of this concept evaluation method
during SBD. This data structure contains two data exchange/flow block diagrams. One
block diagram defines the data sharing method between the early stage models in S3D
with an optimization simulation model in MATLAB. The other block diagram defines the
data implementation process of resolving the co-optimization problem of the CONOPS in
MATLAB. This data structure provides an effective guidance for software engineers to
implement the concept evaluation method automatically by means of the two software
T
ABLE OFC
ONTENTSDEDICATION ... iii
ACKNOWLEDGEMENTS ... iv
ABSTRACT ...v
LIST OF TABLES ... xii
LIST OF FIGURES ... xiv
LIST OF ABBREVIATIONS ... xviii
CHAPTER 1INTRODUCTION ...1
1.1 CONTRIBUTIONS OF THIS DISSERTATION ...1
1.2 MOTIVATION ...2
1.3 DIFFICULTIES AND CHALLENGES ...6
CHAPTER 2RESEARCH OBJECTIVES ...12
2.1 OVERVIEW OF RESEARCH OBJECTIVES ...12
2.2 DEVELOPMENT OF THE OPTIMIZATION PROBLEMS OF THE CONOPS ...13
2.3DEVELOPMENT OF OPTIMIZATION STRUCTURE FOR A UNIVERSAL SYSTEM DESIGN ...13
2.4DEVELOPMENT OF DATA STRUCTURE FOR SOFTWARE IMPLEMENTATION ...14
CHAPTER 3STATE OF THE ART ON THE EARLY-STAGE OPTIMAL DESIGN OF MICRO-GRID POWER GENERATION PLANTS ...16
3.1OPTIMIZATION PROBLEM FORMULATION ...16
CHAPTER 4BACKGROUND ON MICRO-GRID POWER GENERATION AND DISTRIBUTION
SYSTEMS ...28
4.1ELECTRIC ARCHITECTURE OF MICRO-GRID POWER GENERATION AND DISTRIBUTION SYSTEMS ...28
4.2CONTROL ARCHITECTURE ...32
CHAPTER 5DEVELOPMENT OF OPTIMIZATION ALGORITHM ...41
5.1 ORIGINAL DEFINITION OF PARTICLE SWARM OPTIMIZATION ...41
5.2IMPROVEMENT OF SINGLE-OBJECTIVE PARTICLE SWARM OPTIMIZATION ...42
5.3 IMPROVEMENT OF MULTI-OBJECTIVE PARTICLE SWARM OPTIMIZATION...49
CHAPTER 6FORMULATION OF THE ECONOMIC DISPATCH PROBLEM FOR MICRO-GRID POWER SYSTEMS ...51
6.1 DEFINITION OF BROAD CATEGORIES OF DATA ...51
6.2FORMULATION OF OBJECTIVE FUNCTION ...52
6.3FORMULATION OF OPTIMIZATION CONSTRAINTS...57
6.4THE DESIGN PROBLEM FOR DEMONSTRATION ...59
6.5QUALITY EVALUATION OF DESIGN ALTERNATIVES BASED ON THE ECONOMIC DISPATCH PROBLEM ...63
CHAPTER 7FORMULATION OF THE QOSOPTIMIZATION PROBLEM FOR MICRO-GRID POWER SYSTEMS ...69
7.1FORMULATION OF OBJECTIVE FUNCTION ...69
7.2ESTIMATION OF THE MTBFVALUES OF A PGM...77
7.3ESTIMATION OF THE MTTRVALUES OF A PGM ...78
7.4FORMULATION OF OPTIMIZATION CONSTRAINTS...79
7.5QUALITY EVALUATION OF DESIGN ALTERNATIVES BASED ON THE QOS OPTIMIZATION PROBLEM ...79
CHAPTER 8IMPLEMENTATION OF THE CO-OPTIMIZATION APPROACH FOR THE CONCEPT
EVALUATION METHOD ...90
8.1 THEORETICAL BASIS OF OPTIMIZATION STRUCTURE ...90
8.2PROBLEM FORMULATION STRUCTURE OF THE ECONOMIC DISPATCH PROBLEM ..91
8.3PROBLEM FORMULATION STRUCTURE OF THE QOSOPTIMIZATION PROBLEM. ...91
8.4 DEVELOPMENT OF OPTIMIZATION STRUCTURE ...95
8.5 DEVELOPMENT OF DATA STRUCTURE FOR SOFTWARE IMPLEMENTATION OF THE CO-OPTIMIZATION PROCESS ...96
8.6CONCEPT EVALUATION VIA CO-OPTIMIZATION OF THE ECONOMIC DISPATCH PROBLEM AND QOSOPTIMIZATION PROBLEM ...101
CHAPTER 9CONCLUSIONS AND FUTURE WORK ...125
9.1CONCLUSIONS ...125
9.2FUTURE WORK ...128
REFERENCES ...131
APPENDIX A–NUMERICAL SOLUTION TO THE ECONOMIC DISPATCH PROBLEM ...139
L
IST OFT
ABLESTable 6.1 The parameter list of the shipboard power system design ... 61
Table 6.2 The design alternative list of the shipboard power system design ... 61
Table 6.3 The load specifications of the theoretical shipboard power system ... 62
Table 6.4 The aggregate load during the given missions in our shipboard system design 63
Table 6.5 The parameter settings of the SOPSO ... 64
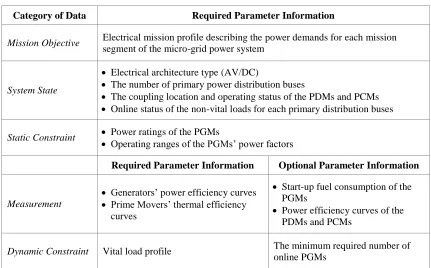
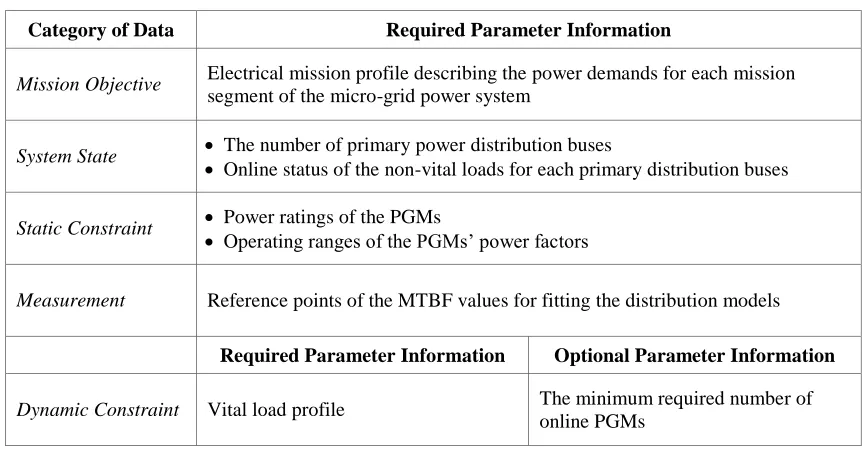
Table 8.1 Parameter list of the problem formulation structure of the EDP ... 92
Table 8.2 Parameter list of the problem formulation structure of the QOS optimization problem ... 95
Table 8.3 The concept of Pareto dominance when applying a MOPSO to the EDP and QOS optimization problem ... 100
Table 8.4 The parameter settings of the MOPSO ... 104
Table A.1 The MVAC ZEDS—the fuel consumption rate minimized via the SOPSO vs. the fuel consumption rate obtained in the worst-case scenario (W) of each design
alternative, respectively ... 139
Table A.2 The minimized fuel consumption rate for the MVAC ZEDS (AC) vs. the minimized fuel consumption rate for the MVDC ZEDS (DC) of each design alternative, respectively ... 140
Table A.3 The CONOPS of each design alternative corresponding to the fuel
consumption values minimized in Table A.2 ... 141
Table B.1 The MVAC ZEDS—the probability-based QOS determined by maximizing the QOS via the SOPSO vs. the probability-based QOS obtained from minimizing the fuel consumption (MF) of each design alternative, respectively ... 143
Table B.3 The MVAC ZEDS—the energy-based QOS failure determined by minimizing the QOS failure via the SOPSO vs. the energy-based QOS failure obtained from
minimizing the fuel consumption (MF) of each design alternative, respectively ... 145
Table B.4 The MVDC ZEDS—the energy-based QOS failure determined by minimizing the QOS failure via the SOPSO vs. the energy-based QOS failure obtained from
L
IST OFF
IGURESFigure 1.1 Navy Acquisition 2 Pass-6 Gate Acquisition Process and Stages of Design
[5][6] ... 7
Figure 4.1 Integrated fight thru power zonal electrical distribution architecture (NAVSEA 2007) [7]... 29
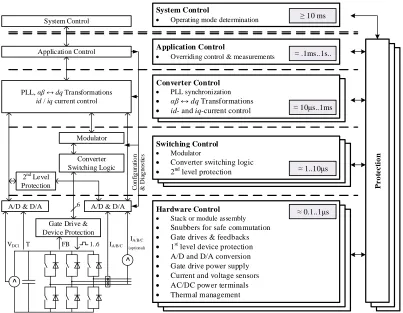
Figure 4.2 Control Architecture for PEBB-based electronics with modifications ... 36
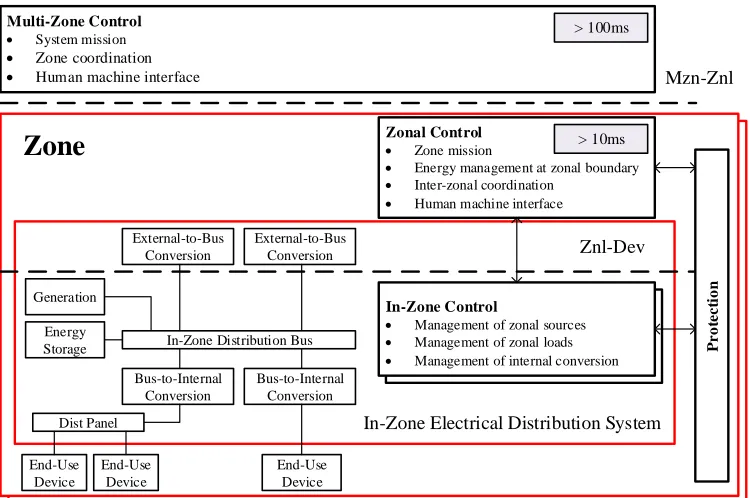
Figure 4.3 Control Architecture for zonal electrical distribution systems with power electronics open system interfaces ... 38
Figure 5.1 Pseudocode of the particle mutation process based on the influence rate ... 47
Figure 5.2 The data flow chart of applying the mutation operator and archive vector ... 49
Figure 6.1 Specific fuel consumption curve for a Gas Turbine rated at 30000 hp ... 54
Figure 6.2 Variation of power efficiency with the load and power factor for a generic generator rated at 80 MW (the line from the top down corresponds to pf = 1, 0.9, 0.85, and 0.8, respectively) [75] ... 56
Figure 6.3 The prototype of the shipboard ZEDS used for demonstrating our design method... 60
Figure 6.4 The MVAC ZEDS—the fuel consumption rate minimized via the SOPSO (left) vs. the fuel consumption rate obtained in the worst-case scenario (right) of each design alternative, respectively ... 65
Figure 6.5 Comparison of the fuel consumption rates of the design alternatives minimized via the SOPSO for the MVAC ZEDS (the bars on the left) and MVDC ZEDS (the bars on the right) ... 67
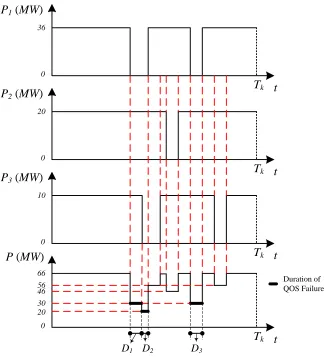
Figure 7.1 An example plot of the dynamic generation capacity of online PGM n based on the values of MTBFs (due to uncontrollable factors) and MTTRs ... 75
Figure 7.2 The dynamic generation capacity of PGM n modified by the reliability due to the controllable factors (i.e., the operating setpoints of the PGM) ... 75
Figure 7.4 The MVAC ZEDS—the QOS determined by maximizing the QOS via the SOPSO (left) vs. the QOS obtained from minimizing the fuel consumption (right) of each design alternative, respectively ... 80
Figure 7.5 The MVAC ZEDS— the maximal percent improvement of the QOS by consuming more fuel (blue) vs. the corresponding percent increase in fuel consumption from the minimum value (red) of each design alternative, respectively... 81
Figure 7.6 The MVDC ZEDS— the QOS determined by maximizing the QOS via the SOPSO (left) vs. the QOS obtained from minimizing the fuel consumption (right) of each design alternative, respectively ... 82
Figure 7.7 The MVDC ZEDS—the maximal percent improvement of the QOS by consuming more fuel (blue) vs. the corresponding percent increase in fuel consumption from the minimum value (red) of each design alternative, respectively... 83
Figure 7.8 The MVAC ZEDS— the QOS failure determined by minimizing the QOS failure via the SOPSO (left) vs. the QOS failure obtained from minimizing the fuel
consumption (right) of each design alternative, respectively ... 85
Figure 7.9 The MVAC ZEDS—the maximal percent decrease of the QOS failure by consuming more fuel (blue) vs. the corresponding percent increase in fuel consumption from the minimum value (red) of each design alternative, respectively... 86
Figure 7.10 The MVDC ZEDS— the QOS failure determined by minimizing the QOS failure via the SOPSO (left) vs. the QOS failure obtained from minimizing the fuel
consumption (right) of each design alternative, respectively ... 88
Figure 7.11 The MVDC ZEDS—the maximal percent decrease of the QOS failure by consuming more fuel (blue) vs. the corresponding percent increase in fuel consumption from the minimum value (red) of each design alternative, respectively... 89
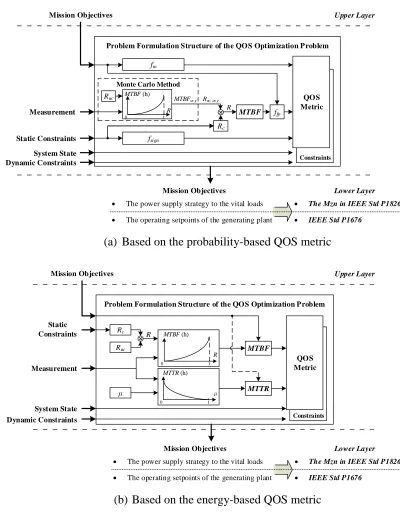
Figure 8.1 The block diagram of the problem formulation structure of the EDP ... 92
Figure 8.2 The block diagram of the problem formulation structure of the QOS
optimization problem ... 94
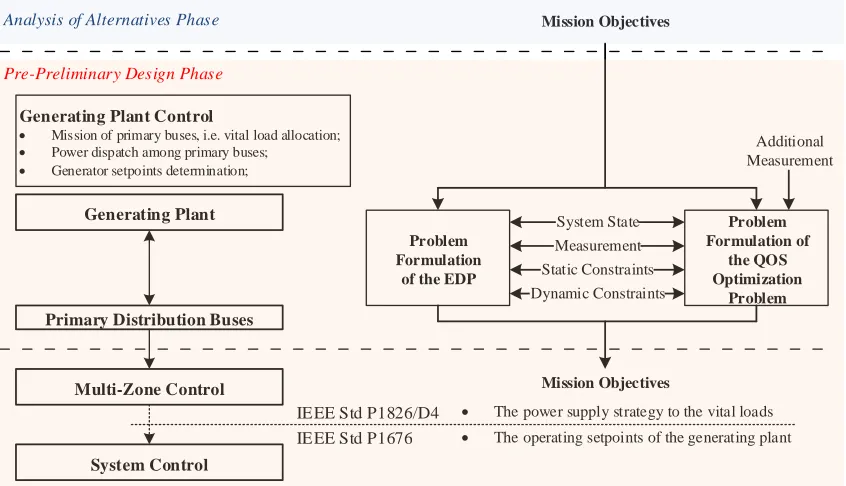
Figure 8.3 The block diagram of the optimization structure for the primary power generation and distribution level (right) corresponding to the control architecture for the same level (left)... 96
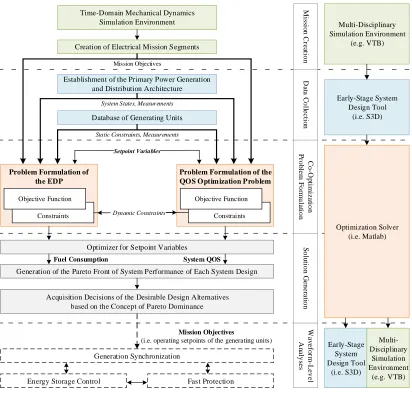
Figure 8.4 The block diagram of the data structure for software implementation of SBD accounting for the co-optimization of the CONOPS ... 98
Figure 8.6 Comparison of the Pareto fronts of all the design alternatives (DAs) over the whole mission for the MVAC ZEDS, based on the probability-based QOS metric ... 105
Figure 8.7 Comparison of the Pareto fronts of all the design alternatives (DAs) over the whole mission for the MVDC ZEDS, based on the probability-based QOS metric ... 106
Figure 8.8 Comparison of the Pareto fronts of all the design alternatives (DAs) over the whole mission for the MVAC ZEDS, based on the energy-based QOS metric ... 108
Figure 8.9 Comparison of the Pareto fronts of all the design alternatives (DAs) over the whole mission for the MVDC ZEDS, based on the energy-based QOS metric ... 109
Figure 8.10 The MVAC ZEDS—the Pareto fronts for the mission segments of design alternative 1, 2, and 3, based on the probability-based QOS metric ... 111
Figure 8.11 The MVAC ZEDS—the Pareto fronts for the mission segments of design alternative 4, 5, and 6, based on the probability-based QOS metric ... 112
Figure 8.12 The MVAC ZEDS—the Pareto fronts for the mission segments of design alternative 7 and 8, based on the probability-based QOS metric ... 113
Figure 8.13 The MVDC ZEDS—the Pareto fronts for the mission segments of design alternative 1, 2, and 3, based on the probability-based QOS metric ... 114
Figure 8.14 The MVDC ZEDS—the Pareto fronts for the mission segments of design alternative 4, 5, and 6, based on the probability-based QOS metric ... 115
Figure 8.15 The MVDC ZEDS—the Pareto fronts for the mission segments of design alternative 7 and 8, based on the probability-based QOS metric ... 116
Figure 8.16 The MVAC ZEDS—the Pareto fronts for the mission segments of design alternative 1 and 2, based on the energy-based QOS metric ... 117
Figure 8.17 The MVAC ZEDS—the Pareto fronts for the mission segments of design alternative 3 and 4, based on the energy-based QOS metric ... 118
Figure 8.18 The MVAC ZEDS—the Pareto fronts for the mission segments of design alternative 5 and 6, based on the energy-based QOS metric ... 119
Figure 8.19 The MVAC ZEDS—the Pareto fronts for the mission segments of design alternative 7 and 8, based on the energy-based QOS metric ... 120
Figure 8.20 The MVDC ZEDS—the Pareto fronts for the mission segments of design alternative 1 and 2, based on the energy-based QOS metric ... 121
Figure 8.22 The MVDC ZEDS—the Pareto fronts for the mission segments of design alternative 5 and 6, based on the energy-based QOS metric ... 123
L
IST OFA
BBREVIATIONSBBO ... Bio-geography Based Optimization
CDFR ... Condition-Dependent Failure Rate
CDRD ... Condition-Dependent Repair Duration
CONOPS ... Power System Concept of Operations
EDP ...Economic Dispatch Problem
EP ... Evolutionary Programming
ESM ... Energy Storage Module
GA ... Genetic Algorithm
GSI ... Gravitational Search Intelligence
HFAC ... High Frequency Alternating Current
HNN ... Hopfield Neural Networks
MLDT ... Mean-Logistics-Delay-Time
MOPSO ... Multi-Objective Particle Swarm Optimization
MTBF ... Mean-Time-Between-Failure
MTTR ... Mean-Time-To-Repair
MVAC... Medium Voltage Alternating Current
MVDC... Medium Voltage Direct Current
NGIPS ... the Next Generation Integrated Power System
QOS... Quality of Service
PBD ... Point-Based Design
PDB ... Primary Distribution Bus
PDM ...Power Distribution Module
PGM ... Power Generation Module
PLM ... Power Load Module
PMM ... Propulsion Motor Module
PSO ... Particle Swarm Optimization
SA ... Simulated Annealing
SBD ... Set-Based Design
SFC ... Specific Fuel Consumption
SOPSO ... Single-Objective Particle Swarm Optimization
VTB... Virtual Test Bed
CHAPTER
1
I
NTRODUCTION1.1.
C
ONTRIBUTIONS OF THISD
ISSERTATION Development of the optimization problems of the power system concept of
operations (CONOPS) for generic micro-grid power generation and
distribution systems. These optimization problems are developed to evaluate
the quality of power generation concepts in terms of two critical system-level
performance metrics—fuel consumption and the system quality of service
(QOS). Incorporating these optimization problems at the earliest design stage
can further reduce the number of feasible design alternatives compared to
traditional methods, considerably reducing the work of the multidisciplinary
research team in the preliminary design phase.
Improvement and validation of a single-objective Particle Swarm
Optimization (SOPSO) and a multi-objective Particle Swarm Optimization
(MOPSO). Both of the optimization algorithms present an enhanced capability
and reliability of locating the global optimum for constrained mixed-integer
problems as compared with the previously reported PSOs.
Application of the SOPSO and MOPSO to the optimization problems of the
CONOPS. We demonstrate the performance tradeoff analyses of the
CONOPS for different power generation concepts by using the SOPSO. We
power generation concepts via the MOPSO according to the stakeholders’
preferences on the performance metrics.
Development of the optimization structure to generalize the modeling process
of the optimization problems. Based on the optimization structure, we develop
a coding infrastructure of optimization problem formulation that can be
imposed on a generic type of micro-grid power generation and distribution
architecture. This work reduces the cost of problem formulation and design
validation during the exploration of the design space at the earliest stage.
Development of the data structure to facilitate the automatic software
implementation of the concept evaluation method, which accounts for the
optimization of the CONOPS, in the set-based design (SBD) phase.
1.2.
M
OTIVATION1.2.1. Accounting for the Optimized CONOPS during Concept Evaluation
The primary objective of the power system design process at the earliest stage is
to identify and fully explore the feasible regions of the design space. To this end, one
should be allowed to combine any applicable type of power generation and distribution
architecture (referred to in this dissertation as “system concept”) with any feasible
combination of generating units (referred to in this dissertation as “design alternative”).
However, for a given system concept, assessing the equipment specifications and
characteristics (e.g., quantities, power ratings, locations of generating units) is not enough
to truly quantify the quality of a design alternative at the earliest design stage. On one
hand, although different generation plants are characterized with different hardware
example, in order to build an 80 MW shipboard power system, one can choose either four
generators with the rated power at 5, 15, 20, and 40 MW or four identical generators with
rated power at 20 MW. To serve a light load at ¼ power capacity (20 MW), the former
design alternative can run two generators: the 20 MW generator is fully operated and
40 MW generator stays as a backup power source in an idling state without producing
any power; the latter design alternative can run two 20 MW generators, each producing
10 MW. Under these operating strategies, these two design alternatives may consume a
very similar amount of fuel because they all have two generators in service; they also
present the same level of QOS because if either operating generator goes offline, the
generator left online is still able to fully support the load power demand for the two
design alternatives.
On the other hand, the performance of a generation plant can also vary in a
significant range with different operating setpoint values. Let us continue with the
previous example. To serve the 20 MW load, a generation plant can either dispatch power
among all of its generators or just run the minimum number of generators sufficient to
support the load. The net fuel consumption of the former case can be several times that of
the latter case depending on the load power and quantity of the in-service generating
units.
Therefore, in order to derive a fair comparison among the design alternatives at
the earliest design stage, one has to identify the quasi-optimal performance of each
alternative at the certainty level that can be best achieved or estimated at the stage.
Specifically, at the earliest stage where waveform-level controls of power electronic
system-level operating setpoints into the evaluation of power generation concepts. It is
also demanding to generalize this optimization approach for a wide range of system
design possibilities (i.e., a “system design” is the combination of the given system
concept and one of its design alternatives).
For a micro-grid power system design, the CONOPS are originally referred to by
Doerry in [1] as “which power system components are used as well as their configuration
for different mission system requirements.” In this dissertation, we extend this definition
to include more detailed setpoint information of power system components, that is, how
much active and reactive power (only for ac distribution system) each in-service power
generating unit produces.
1.2.2. Developing the Co-Optimization Problem for Determining the CONOPS
Usually each performance metric requires a design alternative to be operated
under specific setpoints to achieve the desired design objectives. When the quality of a
design alternative is simultaneously determined by more than one performance metric,
these metrics have to be co-evaluated to determine the optimal values of the CONOPS,
otherwise, the selection of the best design alternative for a given mission based on one
performance metric’s optimal value may actually not be valid when considering another
performance metric. Similarly, for each design alternative, the selection of the optimal
operating point based on one performance metric’s value may not be optimal when
considering another performance metric.
For example, a shipboard power system with 80 MW power capacity may contain
either a few generators with high power ratings (e.g., four 20 MW) or many generators
with lower power ratings (e.g., eight 10 MW). If the ship’s mission profile includes
the former design may outperform the latter in terms of fuel consumption because the
former requires a smaller number of generators in service to fulfill the power demand (i.e.
two 20 MW compared with four 10 MW, although both combinations of online
generators can be operated at their optimal fuel-saving status, the base fuel consumption
to keep a machine operational accounts for a considerable proportion of operating fuel
consumption, leading to a high probability that having more generators in service will
consume more fuel.) However, the latter design appears to be better in terms of the QOS
because the power is dispatched among more generators, offering greater generation
redundancy (i.e., 20 MW vs. 30 MW). Therefore, in order to identify the true quality of a
design alternative, we need an effective method to fully investigate the performance
tradeoffs between fuel consumption and the QOS with different CONOPS.
1.2.3. Incorporating the Concept Evaluation Method Considering the Optimal
CONOPS into Set-Based Design
SBD is an important design principle used to fully explore a design space at the
early stages. It enables the design process to converge to the best set of potential design
alternatives, which will most likely lead to the best solution, in a time frame as short as
possible [2][3]. Following the traditional point-based design (PBD) approach, designers
quickly assess a range of design alternatives and then arbitrarily select one for further
refinement with respect to a range of desired capabilities. In contrast, following SBD,
designers do not rush into making decisions but rather eliminate undesirable answers
from the design space. This screening process proceeds as additional detailed analyses
are added in along design steps until some point when a single design “converges” [4].
Therefore, a far greater range of design alternatives can be evaluated with respect to the
Since SBD produces better solutions faster and offers more flexibility for
continued system improvement and integration [2], it has been widely used for
applications in the automotive and aerospace industries. Recently, the U.S. Navy has
taken actions to adopt SBD for the shipboard power system design process. The SBD
model is expected to improve design discovery in the Pre-Preliminary Design (Pre-PD)
phase as indicated in Figure 1.1. It will allow more of the design effort to proceed
simultaneously and defers detailed specifications until tradeoffs are more fully
understood [2][4]. However, the current SBD approach is constructed with the analysis
framework only based on physical properties, such as weight, volume, and power
capacity. Because of this, the outcome is unable to reflect optimal tradeoffs of system
performance. Hence, the design alternatives with inferior performance tradeoffs may also
be selected in the Pre-PD, increasing evaluation costs and slowing down design cycles.
Therefore, it is paramount to integrate the optimization of the CONOPS into the
current concept evaluation method of SBD. This accomplishment will effectively narrow
down the feasible design space at the earliest design stage according to the stakeholders’
preferences on the system performance tradeoffs. This work can be done by developing a
software coupling method between an external optimization solver, which is
advantageous to model and resolve generic optimization problems, and a SBD tool,
which is used to generate early stage system models.
1.3.
D
IFFICULTIES ANDC
HALLENGES1.3.1. Formulation and Solution of the Optimization Problems of the CONOPS
In previous literature, fuel consumption, the QOS, and survivability are suggested
micro-grid power systems [10]-[45]. Fuel consumption is usually minimized for a given
mission (or a mission segment) by resolving an economic dispatch problem (EDP). The
QOS is the measure of the system’s ability to continue serving loads when some
generating elements become suddenly unavailable. Survivability measures a system’s
ability to restore the power supply on a damaged system (i.e., the ability to preserve the
power for critical mission loads after damage occurs to the distribution system). In this
dissertation, we are only concerned with fuel consumption and the QOS because they are
more affected by the refinement of the CONOPS than survivability. In contrast,
survivability is mostly predetermined by physical characteristics of both the electric and
thermal cooling system layouts (e.g., locations of equipment, the quantity of zones, the Figure 1.1 Navy Acquisition 2 Pass-6 Gate Acquisition Process and Stages of Design
distance between buses) rather than sophisticated operation strategies of power system
components when serious damage occurs [35].
However, for micro-grid power systems, the optimization approach for the
CONOPS with respective to fuel consumption and the QOS has not been fully addressed
at the earliest design stage up to this point. Three main challenges are summarized as
follows:
First, the EDPs are previously formulated in terms of the setpoint variables of the
CONOPS that mainly reflect the characteristics of terrestrial power plants (i.e., only the
real power dispatch is necessary at the end of the generation plant; switching generating
units on or off is not necessarily considered; the configurability of a power distribution
system is not taken into account.). When applying these variables to the EDPs of
micro-grid power systems, the minimum fuel consumption of a system design cannot truly be
predicted for acquisition decisions. In addition, the generation redundancy, which is
central to micro-grid power systems, is seldom concerned in the previous EDPs.
Second, the optimization problem of the CONOPS with respect to the QOS
(referred to in this dissertation as “QOS optimization problem”) has not been properly
related to any setpoint variables. It has been well acknowledged that ratings of generating
units, setpoints of power modules, and the operating status of distribution systems
considerably affect the system QOS [44]. However, the existing QOS optimization
problems only focus on the QOS enhancement at static operating points of a generation
plant rather than the discovery of the optimal operating point of a generation plant for
maximizing the QOS. Thus, we need to reformulate the QOS optimization problem from
Last but not least, although it is essential to have fuel consumption and the QOS
co-optimized (see Section 1.2.2), in the past, they have been optimized only in sequence.
Specifically, the QOS is always evaluated or improved based on the outcome of an EDP,
which determines the power plant setpoint. Thus, it is highly possible to encounter the
situation (demonstrated in Chapter 7) that one can never get a satisfactory QOS no matter
how he adjust the system hardware around an operating point that implicitly
compromises the QOS; or he may have to afford a large investment at that operating
point to achieve an acceptable QOS.
How to model these optimization problems and solve the co-optimization problem
is also a big challenge for us to address. Considering the complexity of the objective
functions and constraints, which are non-convex, nonlinear, and mixed-integer, existing
evolutionary algorithms are not effective enough to derive the solution in a reasonable
time; thus, this dissertation also has to develop an effective optimization technique to
support the optimization process of the CONOPS.
1.3.2. Development of Optimization Structure for a Universal System Design
One has to face two difficulties to impose the optimization problems of the
CONOPS on different potential system designs: 1) there is no generic format of the
optimization problems that can fit an arbitrary system concept (e.g., the optimization
problems formulated for the system with a ring bus cannot be applied for the system with
the breaker-and-a-half bus configuration); 2) it is time-consuming in reality to formulate
the optimization problems for each system concept one at a time. To address these
difficulties, we need to generalize the modeling process and the coding infrastructure of
As stated by IEEE Std 1676 [46] and recently drafted IEEE Std P1826/D4 [47],
control architecture can be effective to generalize the description of normative control
functions for different application levels, disregarding a wide range of system
architecture types. Specifically, the low level control architecture divides the functional
analysis of a generic power electronics system into the control functions ranging from
establishing the system mission to managing the specific power devices. The mid-level
control architecture (i.e., for power system controls) defines the control functions of a
generic zonal electrical distribution system (ZEDS) for properly serving the loads by a
customer-supplier agreement, ranging from allocating duties to zones for supporting a
mission to identifying the management strategies of zonal power electronic equipment.
The optimization of the CONOPS does not involve the actual control
implementations of power system components in time domain, but it determines the
overall control objectives of a power system from the primary power generation and
distribution level (the power level), that is, how the generating units should be operated in
order to guarantee the carrying out of the mission. Since the determination of the
CONOPS dictates the operation of the ZEDSs and power electronics system, it is
regarded as the control function belonging to the highest level of a power system.
Obviously, if the control architecture for this level of a generic micro-grid power system
is available, we will be able to develop an optimization structure based on that to
standardize the optimization problem of the CONOPS for a universal system design.
Unfortunately, at the moment, the concept of the control architecture is explored
high-level power systems (the primary power generation and distribution level). Thus, we
are missing the basis to develop the corresponding optimization structure.
1.3.3. Automatic Software Implementation of the Concept Evaluation Method
The early stage design software, S3D [48], is developed to provide an
environment that enables simultaneous collaborative design across multiple disciplines in
the early design process. S3D facilitates the project’s transition from a conceptual phase
to a detailed design phase. It provides a mechanism for mapping vendor equipment
directly to models that are available for detailed designs. It is also able to provide the
simulation capability of detailed time-domain design by means of a coupled simulator,
called Virtual Test Bed (VTB). Although S3D is advantageous for its quality and
efficiency of capturing representative electrical architecture, it lacks the potential to
investigate the optimality of a system due to the shortage of an optimization solver.
In contrast, MATLAB contains a large group of powerful tools for numerical
computations with vectors and matrices, and offers sophisticated commands for
customizing optimization techniques [49]. However, it is insufficient in exploring the
design space for system concepts and design alternatives at the earliest design stage.
Therefore, the integration of S3D with MATLAB can be an effective solution to
incorporate the optimization analysis of the CONOPS into the concept evaluation
method. However, at the moment, an effective data sharing method has not yet been
developed between the early stage model and the simulation model. Specifically, the
transmitted and processed data has not been identified within each software environment
and between the two environments. In addition, the procedure to automate software
CHAPTER
2
R
ESEARCHO
BJECTIVES2.1.
O
VERVIEW OFR
ESEARCHO
BJECTIVESThe objective of this dissertation is to develop a methodology for evaluating the
potential power generation concepts for a given micro-grid power system concept, such
as a shipboard power system, and selecting a set of quasi-optimal solutions at the earliest
design stage.A four-step methodology is developed to meet this goal:
1) Develop the standard optimization problems of the CONOPS with respect to
the two critical performance metrics—fuel consumption and QOS—for a
generic system design.
2) Formulate the appropriate formats of the optimization problems for each given
system concept based on its architecture characteristics.
3) Apply an effective optimization algorithm to co-optimize the optimization
problems for the distinct metrics. The quasi-optimal performance tradeoffs are
determined based on the concept of Pareto dominance for each potential
system design.
4) Compare the quasi-optimal performance tradeoffs of all the potential system
designs to select the non-dominated (quasi-optimal) design alternatives and
understand their optimal operating strategies.
The entire work is only based on the system-level analyses and eventually applied
2.2.
D
EVELOPMENT OF THEO
PTIMIZATIONP
ROBLEMS OF THECONOPS
The first objective in this subsection is to identify a set of design variables for a
universal system concept and design alternative. This set should be essential to
identifying the CONOPS of the micro-grid power generating units. Also, it should be
sufficient to allow for tradeoff study between fuel consumption and the QOS for a system
design at the earliest stage.
The second objective in this subsection is to formulate the optimization problems
of the CONOPS with respect to the distinct metrics. The objective function should be
able to quantify the fuel consumption and system QOS in terms of the variable set. The
optimization constraints should reflect the operating requirements common to generic
micro-grid power systems.
Considering that there are multiple potential topologies of a system concept (e.g.,
ring bus, split bus, breaker-and-a-half), it is important to identify the appropriate forms of
the optimization problems to fit the given one. Therefore, the third objective in this
subsection is to identify the essential parameters that characterize a system concept (e.g.,
the number of independent primary distribution buses, the power distribution
configuration of the load zones, the operating status of circuit breakers) and to
incorporate them during the optimization problem formulation.
2.3.
D
EVELOPMENT OFO
PTIMIZATIONS
TRUCTURE FOR AU
NIVERSALS
YSTEMD
ESIGNThe objective in this subsection is to develop an optimization structure for
defining a universal modeling and coding process of the optimization problems
categories for the data that must be involved in the optimization problems of the
CONOPS. This is for generalizing the description of system designs, design
requirements, and the formulation procedure. Then we need to identify the relationship
among all these categories of data to regulate the co-optimization procedure of the
CONOPS. Finally, we need to develop one standard coding infrastructure for imposing
the optimization algorithm to the optimization problems, which may correspond to any
regular system concept and contain different metric expressions.
We also need to develop a powerful single-objective and multi-objective
optimization algorithm to support the optimization and co-optimization approach,
respectively. These algorithms should be able to reliably converge to the accurate global
optimal solutions in a reasonable number of iterations when dealing with constrained
mixed-integer problems. In order to facilitate acquisition decision, we will employ the
concept of Pareto optimality to visualize the quality comparison of the design alternatives
with the co-optimization approach.
2.4.
D
EVELOPMENT OFD
ATAS
TRUCTURE FORS
OFTWAREI
MPLEMENTATIONDue to software limitations, modeling early stage system designs and optimizing
their CONOPS are currently accomplished in two independent software environments—
S3D and MATLAB. Therefore, the information of each early stage model studied in S3D
has to be manually collected and hard-coded in MATLAB one at a time to generate the
appropriate formats of the optimization problems.
The objective in this subsection is to develop a data structure for realizing the
automated simulation process by using the two tools. Specifically, we need to identify the
to MATLAB for customizing the optimization functions of the CONOPS. In addition, we
need to identify the data that are required, processed, and output at each simulation phase
of the concept evaluation process implemented in MATLAB. We will finally develop the
CHAPTER
3
S
TATE OF THEA
RT ON THEE
ARLY-S
TAGEO
PTIMALD
ESIGN OFM
ICRO-G
RIDP
OWERG
ENERATIONP
LANTS3.1.
O
PTIMIZATIONP
ROBLEMF
ORMULATIONIn the previously published efforts, the quality of a micro-grid power generation
system design is mainly evaluated in the following aspects at the earliest stage [7][9]:
mission-oriented fuel cost, minimization of the number of prime movers, electric power
QOS, and benefits of including energy storage devices.
3.1.1. Minimizing Mission-Oriented Fuel Costs
In previous literature, the EDP has been extensively studied for terrestrial power
generation plants with various evolutionary optimization algorithms [10]-[24]. Given the
mission segments depicting the discrete load power demands, fuel consumption of a
power generation plant is minimized by optimizing the operating setpoint of each
installed generating unit subject to the operating constraints of interest.
The fuel cost (usually measured in dollars) of each generating unit is formulated
by a quadratic or occasionally cubic polynomial in terms of its generated power, P. The
quadratic function is expressed as the term in the parentheses of (1). The three
coefficients, ai, bi, and ci, are specific to a power generating unit. The fuel cost of a
generation plant is expressed as the sum of fuel costs of all N generating units, as shown
in (1). When valve point loading effects of generators are concerned, another sinusoidal
operators of (2). The coefficients of ei and fi can be determined by fitting the
experimental efficiency curve of a generator. However, the sinusoidal term will turn the
original convex function into a non-convex one, requiring more advanced evolutionary
algorithms to solve the problem [17]-[22].
2
1 N
n n n n n
n
F a P b P c
(1)
2
n,min 1
sin N
n n n n n n n n
n
F a P b P c e f P P
(2)Constraints imposed on an EDP vary depending on the application of a power
generation plant and the accuracy level that designers aim to achieve. Generation
capacity and power balance are the compulsory constraints for all situations [15][16].
Apart from these two, extra operating constraints, such as prohibited operating zones
[13][15][17]-[20], ramp rate limits [14][21], generator startup fuel consumption [23],
transmission line loading limits [1][13], power loss in the transmission lines (normally
modeled using the standard or simplified Kron’s loss formula) [1][14][17]-[20], the
augmentation of spinning reserve capability of a system [22], and the maintenance of the
QOS at certain levels [50] can be taken into account for more accurate analysis.
However, it has to be noted that all the previous work fails to address three design
concerns, which unfortunately are very significant to micro-grid power systems and SBD
applications:
First of all, the reported concepts of EDPs are developed to discover the optimal
performance of an already-defined generation plant and system concept, but not to help
choose or optimize the specifications of the generation plant for a system concept.
discovering the minimum number of prime movers and generating units for a system that
can yield the minimum fuel consumption for a given mission.
Second, the reported EDPs fail to investigate the effect of the type of electric
architecture on the fuel-saving performance of a power generation plant. Since the
distributed power factor compensators are installed along the terrestrial AC distribution
buses close to the end-use load, the reactive power balance constraint is not required on
the side of the generation plant. Therefore, the formulation of the EDP is always regarded
to be the same for AC and DC systems. However, considering the weight and cost, a
micro-grid power system like an electric ship usually has a limited installation of reactive
power compensators. Thus it is necessary to study how the reactive power balance at the
end of the generation plant affects the performance of a micro-grid AC power system.
Third, the EDPs formulated for terrestrial generation plants do not consider
generation redundancy or any other reliability constraints because of the excessive power
support from the grid. However, the power generation capacity of a micro-grid system is
always closely sized to the load demands, thus the system usually has little spinning
reserve during operations. Therefore, reliability has to be taken into account with fuel
consumption when resolving the EDP. Unfortunately, the reported EDPs in literature fail
to address this concern.
3.1.2. Improving the Electric Power QOS
The QOS evaluates the ability of a generation plant to preserve the power to loads
when certain power generating modules suddenly become unavailable. The QOS is a
very important factor to characterize system optimality of a micro-grid power system
alternative at the earliest design stage has not been properly developed. There are three
problems with the current existing QOS metrics:
1) Most of them are described in prescriptive languages like “standards” or
customer-supplier agreements rather than in algebraic expressions, making the
quantitative analysis hard to apply in practice [44].
2) For those very few reported mathematical models of the QOS, they are
defined in terms of event-based, not status-based variables and parameters. As
a result, a value of the QOS can only represent system reliability measured in
a specific failure scenario rather than a good prediction of system reliability in
an operating condition. Since the failure scenarios are normally not known at
the earliest design stage, these QOS models turn out not to be applicable for
SBD purposes [25].
3) Although the determinant factors of the QOS have been well-acknowledged as
the generator sizing and CONOPS [44], these factors have not yet been
incorporated in the QOS optimization problems.
There are two main methods proposed in literature to determine the QOS of a
power generation plant:
The first method involves time-domain analyses, which directly measures certain
system state values (e.g., the frequency and bus voltage at certain nodes, the rotor angle
of generators, the angle difference between certain buses) to see if any violation occurs
for the predefined contingencies [45]. This method can only provide qualitative analysis
of the QOS with two states—QOS survival or QOS failure. Therefore, this method is
by other means, but not to optimize the CONOPS. In addition, this method requires too
many system details that are, unfortunately, not accessible at the earliest design stage.
The second method employs failure and repair rates of generating units to
indirectly quantify the QOS. This method provides more flexibility to evaluate the QOS:
1) it allows one to study the individual effect of each generating unit on the QOS of a
system; 2) it allows one to estimate the QOS of a system at the preferred level of
accuracy by just considering the generating units of interest. This method does not rely
on the time-domain analyses; instead, it capitalizes on the accurate estimation of the
failure and repair rates of the generating units involved in the system.
Here are the summary of the several important algebraic forms of the QOS metric
proposed in literature. Doerry [25] defines the QOS in terms of three factors, namely,
mean-time-between-failure (MTBF) values of power components, mission duration, and
power interruption events. A QOS failure is defined to occur if a given mission segment
cannot be fulfilled in the face of a set of predefined power interruption events during a
specified duration. A QOS failure is only regarded to be caused by aggregate component
failures; hence a QOS failure rate is directly related to the MTBF values of components.
By definition, the QOS failure rate of each component is weighted by the duration of
mission segment and that of component online status, as expressed in (3); the weight is
calculated in (4). The QOS failure rate of a system is then calculated as the summation of
the weighted QOS failure rates of all the components, as shown in (5). The QOS metric is
finally defined as the reciprocal of the QOS failure rate of a system, as expressed in (6).
This definition of QOS metric is straightforward to comprehend; however, as the author
level because these events can be associated with multiple possibilities and random
factors, such as operating-based wear, glitches due to long time operating out of
allowable ranges, and human misapplications. In addition, it is costly to test the QOS
failure for each failure event (i.e., the time-domain simulation and detailed information of
a system design are required).
qos n
failure n
c n
f r
r
(3)
,n ,
1 n
K
qos n om k om k om k pi j k
f f p q
(4)
1 N
failure failure n n
r r
(5)1
failure QOS
r
(6)
For more comprehensive design purposes, Doerry updates the formula of the QOS
in [44]. The concept of operational ability, which is defined in terms of three factors of a
power component, namely, MTBF, mean-time-to-repair (MTTR), and
mean-logistics-delay-time (MLDT), is introduced to evaluate the probability of multiple simultaneous
failures, as expressed in (7). This paper points out the necessity to examine multiple
simultaneous failures with an Ao less than about 0.995. However, the author does not
provide a complete method to estimate the MTTR and MLDT, making this QOS metric
difficult for calculation.
o
MTBF A
MTBF MTTR MLDT
(7)
Zapata, et al. [27] measure the QOS in terms of two indices, namely, expected
expressed in terms of component failure rates, preventive maintenance rates, false
component operating rates, and outage rates due to backup actions. Except for component
failure rates, all of the other rates are given as constant parameters, averaged from the
historical database. The definition of a QOS failure varies based on the specific system
topologies, but the QOS is computed following the same procedures of sequential Monte
Carlo simulation. In some literature, the QOS can also be estimated in terms of the
capability that a plant can produce the power to the end-use loads at some acceptable
levels [28]-[32]. This capability can be evaluated in several measures including
loss-of-load probability, loss-of-loss-of-load duration, and loss-of-energy amount. This measure of the
QOS is usually based on the observed or historical data of reliability (i.e., MTBF) and
maintainability (i.e., MTTR) of power plant components.
3.1.3. Calculating Failure and Repair Rates of a Generating Unit
Despite the diverse forms of the QOS metric proposed for the second method
explained in Section 3.1.2, the factors in common are the failure and repair rates of power
plant components. The failure rate of a power plant component is observed to be affected
by several factors related to both controllable CONOPS factors (e.g., loading conditions,
switching frequency, frequency of setpoint changes) and uncontrollable factors (e.g.,
aging effect, wear-and-tear, fatigue failure, maintenance schedules, random
contingencies). In contrast, the repair rate of a component is more affected by
uncontrollable factors (e.g., environmental conditions, nature of failure, diagnostic
ability, equipment, repair resources, skills of personnel). At the moment, it is still a
problem for manufacturers to estimate or predict these two rates at an acceptable cost
[25]. In traditional design practices, designers usually treat failure and repair rates of a
scenarios. Their values are given as the averaged value of the inspected historical data of
similar products. As a result, one may be surprised to see that the system design
appearing to offer a high-level QOS by theoretical analyses behaves far below the
expectations during real life operations [28]. In order to make more reliable acquisition
decisions, one needs an effective approach at the earliest stage to model dynamic failure
and repair rates like those observed from daily operations. Several condition-dependent
failure rate (CDFR) models and condition-dependent repair duration (CDRD) models are
proposed in recent publications and summarized as follows:
The impact of the setpoint of an electric machine on its failure rate is revealed
from the mechanical point of view in [33]. Considering a generation plant with a fixed
frequency and sufficient thermal cooling capabilities, the loading condition of each
generating unit (i.e., the generated power) is implied to be the most significant factor
affecting its dynamic failure rate. Increasing the generated power causes greater torque
exerted on the bearings and reduces the fatigue life. This relationship is specified in
mathematical expressions in [34]. The author introduces two different CDFR models for
a generating unit in terms of its active instantaneous load, PL. One CDFR model is
expressed in (8) as a natural exponential function, which is also employed for the survival
analysis in biostatics. The coefficients, λo and β, can be determined from a few tested
points by data fitting techniques. The other CDFR model is expressed in (9) based on
some reference loading points. The parameter λC and PL,C are the reference failure rate
and the corresponding load, respectively. The parameter y denotes the load dependent
exponent. Both models need to capitalize on the historical failure database to determine
P tL o
t e
(8)
, y
L C
L C P t t
P
(9)
The uncontrollable factors affecting failure and repair rates are addressed by
means of various distribution models and stochastic simulation methods in previous
literature. Zapata et al. [27] employ the stochastic point processes (SPP) to model the
time-varying failure and repair rates of a generating unit. By evaluating the tendency of
randomly generated failure events to change during a period, the appropriate SPP model
can be selected from six options. Garazas et al. [28] use a two-parameter Weibull
probability distribution (cumulative distribution function) to characterize wear-out and
fatigue failures of a gas turbine and adopts a lognormal distribution to derive the repair
rate, as expressed in (10) and (11), respectively. These two equations represent statistical
reliability and maintainability of a system at time t. In (10), the parameters β and 𝜂 denote the shape parameter and characteristic life of the Weibull distribution, respectively. In
(11), the parameters 𝛾 and 𝜎 denote the mean value and standard deviation of the lognormal distribution, respectively; the function Φ(∙) denotes standard normal
distribution cumulative function. These parameters need to be determined based on the
historical data.
1 t
e
(10)
lnt
Wu et al. [23] express the dynamic failure and repair rates in the corresponding
bounded ranges. These rates are regarded as the design variables that can be optimized.
However, the physical meaning of these optimal rates is not presented.
3.2.
O
PTIMIZATIONA
LGORITHMSAn effective optimization algorithm is prerequisite to solving the co-optimization
problem of the CONOPS. The co-optimization problem contains both real and binary
variables in the objective functions and constraints. The objective functions are
non-convex and thus cannot be resolved by conventional gradient-based methods. In contrast,
heuristic techniques are more suitable to be employed.
Heuristic optimization methods, most of which belong to the class of the
population-based evolutionary algorithm, do not impose the requirements that systems
must be differentiable or continuous; do not limit assumptions regarding the forms or
characteristics of the objective functions and constraints; present less likelihood for
solutions to be trapped on local optima [51]. However, different heuristic algorithms
present different advantages in favor of specific situations.
Popular heuristic methods used for single objective optimization problems include
the evolutionary programming (EP) [52], genetic algorithm (GA) [53], simulated
annealing (SA) [53], bio-geography based optimization (BBO), gravitational search
intelligence (GSI) [54], Hopfield neural networks (HNN) [55], particle swarm
optimization (PSO) [56], and various hybrid algorithms [56]-[59]. The limits of these
algorithms are summarized as follows: GA, EP, and EA have the common problem that
they always fail to guarantee the global optimal solutions compared to the other
decoding schemes and presents degraded efficiency in applications where design
parameters are highly correlated; EP converges to near-optimum rather slowly due to its
mutation and selection schemes, and can get trapped in sub-optimal states for large scale
complex problems; SA is very time-consuming and has difficulties to find the appropriate
annealing schedule to account for distinct problems. BBO is typically time-consuming in
tuning the parameters, especially for complex systems; its parameters are also
problem-specific. The performance of GSI starts degrading significantly in contrast to the other
methods when the number of iterations is extended to be large, typically >1000. HNN is
more suitable to solve piecewise nonlinear functions but may suffer from excessive
numerical iterations, resulting in huge calculations for training the neural network.
In contrast, PSO outperforms all these algorithms in several aspects when tested
with the benchmark problems [60]. PSO retains the advantages of the population-based
algorithms, being less susceptible to getting trapped in local minima. It balances the
global and local exploration such that it converges to the global optimum in shorter time.
It is easy to implement with basic mathematics and a limited number of parameters. Its
performance does not depend on a user-defined initial point where the simulation
iteration starts. Additionally, it can be improved through integrating with other
optimization techniques to solve a wide range of problems (e.g., mixed integer problems,
multi-objective problems, objective function with stochastic nature, problems with
time-sensitive global optima). Hence, we will pick PSO as the algorithm prototype to be
improved for solving our co-optimization problem.
The previously reported versions of single-objective PSO (SOPSO) suffer from an
constrained mixed-integer problems. The previously reported versions of multi-objective
PSO (MOPSO) also bear the same problem; even worse, when the constraints contain the
mixed integers like our co-optimization problem, current MOPSOs are even unable to
converge to a valid solution. Therefore, it is essential to develop an improved SOPSO and
MOPSO with better capabilities to deal with mixed-integer variables and avoid premature
convergence. In this dissertation, we apply SOPSO to generate the global optimal
CONOPS with respect to fuel consumption and the QOS independently. The outcomes
are used as the reference to demonstrate the efficacy of the improved MOPSO. The
conclusions drawn via these two methods are compared to testify the design improvement
CHAPTER
4
B
ACKGROUND ONM
ICRO-G
RIDP
OWERG
ENERATION ANDD
ISTRIBUTIONS
YSTEMS4.1.
E
LECTRICA
RCHITECTURE OFM
ICRO-G
RIDP
OWERG
ENERATION ANDD
ISTRIBUTIONS
YSTEMSThis dissertation adopts the next generation integrated power system (NGIPS) [7]
as the architecture prototype of micro-grid power generation and distribution systems,
including those that do not contain electric propulsions. The NGIPS is configured as a
zonal electrical distribution system (ZEDS) that represents a simpler, cheaper, and better
productivity of commodities (e.g., electricity, chill water) than other system architecture
types, such as traditional radial distribution systems or locally producing the commodities
[61]. In addition, ZEDSs provide considerable improvement for three measures, namely,
survivability, the QOS, and the cost [62].
The NGIPS has three popular types of power generating architecture, namely,
medium voltage ac (MVAC), high frequency ac (HFAC), and medium voltage dc
(MVDC). Although the details of power interfaces differ from each of them, they all
adhere to the same concept of ZEDS and the same types of power modules, as shown in
Figure 4.1.
The standard NGIPS power modules are introduced as follows:
Power Generation Module (PGM): the power source that converts the fuel to
(e.g., a prime mover such as a gas turbine or a diesel engine) and an electric
generator (e.g., a synchronous machine).
Propulsion Motor Module (PMM): the load type that converts electric power
into the propelling force of a ship, which is the major power consumer at the
most of time.
Power Distribution Module (PDM): the essential elements, including
switchgears and cabling, that transport electric power between functional
elements.
Power Conversion Module (PCM): the functional elements, including power
transformers and power electronics-based converters, that convert electric
power from one type (e.g., voltage, frequency) to another. Load Load Load Load Load Load Emergency Load via CBT
Emergency Load and Un-interruptible Load via Auctioneering Diodes P D M ( 4 5 0 V A C ) P D M ( 6 0 0 V D C ) P D M ( 4 5 0 V A C ) P D M ( 6 0 0 V D C )
PCM – 2A
P C M – 1 A P C M – 1 A Load Load Load Un-interruptible Load Un-interruptible Load Variable Speed Variable Voltage Special Frequency Load MVAC HFAC MVDC or 1000 VDC via PCM-4 MVAC HFAC MVDC or 1000 VDC via PCM-4
![Figure 1.1 Navy Acquisition 2 Pass-6 Gate Acquisition Process and Stages of Design [5][6]](https://thumb-us.123doks.com/thumbv2/123dok_us/8424018.1387389/27.612.151.466.78.360/figure-navy-acquisition-pass-acquisition-process-stages-design.webp)
![Figure 4.1 Integrated fight thru power zonal electrical distribution architecture (NAVSEA 2007) [7]](https://thumb-us.123doks.com/thumbv2/123dok_us/8424018.1387389/49.612.107.508.70.368/figure-integrated-fight-power-electrical-distribution-architecture-navsea.webp)