appreciably on many similar ranges. Use of light weight steers should provide livestock operators on these ranges with maximum returns considering both weight gains and grazing efficiency.
LITERATURE CITED
HEDRICK, D. W., J. A. YOUNG, J. A. B. MCARTHUR, AND R. F. KENI~TON. 1968. Effects of forest and grazing practices on mixed coniferous forests of northeastern Oregon. Oregon Agr. Exp. Sta. Tech. Bull. 103:1-24.
MCLEAN, ALASTAIR. 1967. Beef production on lodgepole
Pocket Gophers on Seeded
Mountain Range1
ODELL JULANDER, JESSOP B. LOW, OWEN W. MORRIS
Utah
AND
pine-pinegrass range in British Columbia. J. Range Manage. 20:214-216.
MCLEAN, A., AND E. W. TISDALE. 1960. Chemical com- positions of native forage plants in British Columbia in relation to grazing practices. Canada J. Plant Sci. 40: 405-423.
YOUNG, JAMES A. 1965. Forage production and utilization in a mixed conifer forest in the Wallowa Mountain foot- hills. PhD Thesis. Oregon State Univ. 108 pp.
YOUNG, J. A., J. A. B. MCARTHUR, AND D. W. HEDRICK. 1967. Forage utilization in a mixed-coniferous forest of northeastern Oregon. J. Forest. 65:391-393.
Formerly Principal Plant Ecologist,2 Intermountain Forest and Range Experiment Station, U.S. Dep. Agr., Forest
Service, Provo; Leader, Utah Cooperative Wildlife Research Unit, Logan; and Formerly District
Agent, Predator and Rodent Control, Bu- reau of Sport Fisheries and Wildlife,
Salt Lake City, Utah.
Highlight
Observation of two comparable areas of mountain range- land seeded to grass the same year showed that uncontrolled populations of pocket gophers were very destructive. Pro- tection of seeded areas resulted in good stands of grass and forbs. No ideal measure for controlling pocket gophers has yet been developed.
In 1959 we reported results of a 6-year study (1952 through 1957) on the effect of pocket gophers (Thomomys talpoides) on seeded mountain range- land in the Monte Cristo area of Cache National Forest, Utah. The present paper chiefly reports observations during the S-year period following the original study. Study areas, transects, and methods were the same for both periods, but different de- grees of gopher control were used in the later period.
Recent Literature
A few pertinent reports have appeared since our earlier article. Marston and Julander (1961) re- ported serious gopher damage to several important tall forb species along the Wasatch Front in north- ern Utah. Richens’ Z-year study (1965) on the na- tive range that surrounds the two seeded areas we 1 Received September 2 1, 1968; accepted for publication
April 1, 1969.
2No~ Professor of Botany, Brigham Young University, Provo, Utah.
studied evaluated the effect of 1, 2, 3, and 4
years
of control on the size of the gopher population. Treatment the first year reduced population by about 48 percent, but additional years of treat- ments failed to reduce it significantly. Richens found high positive correlation between counts of mounds and winter casts with numbers of gophers as determined by saturation trapping. He devised an index for estimating the number of gophers per acre from counts of mounds or casts.In Colorado, Reid et al. (1966) also reported that mounds were a good index to size of population. Average number of mounds raised per gopher in a 4%hour period was 9.9 at Grand Mesa and 9.7 at Black Mesa. Feeding trials in Colorado also showed that a pocket gopher consumes about 80 grams, fresh weight, of plants in a 24-hr period (Colorado Cooperative Pocket Gopher Project Committee, 1960).
Keith et al. (1959) reported that spraying a forb- grass cattle range in Colorado with 2,4-D resulted in an
87%
reduction of pocket gophers, an 83% reduction of perennial forbs, and a 37% increase in production of grass. As a result, the diet of pocket gophers changed from 82% forbs and 18% orass to approximately equal amounts of both. ibout two-thirds of the gophers’ diet during sum- mer months was above-ground plant material.Methods and Treatment
Stand indexes (frequency)3 were determined for perennial grasses on 1/-ft2 plots on seeded Areas I and II. For peren- nial forbs and tarweed (Madia glomerata Hook.) l-f@ plots were used, which also gave frequency counts of gophers’ winter casts; but current summer mounds were counted on 0. l-acre plots to determine relative gopher populations.
On Area I, gophers were closely controlled from the year of seeding (1952) through 1962. From 1963 through 1965, though, the landowner only partially controlled gophers, and some invaded the area. On Area II, gophers were un- controlled from 1952 through 1957; but from 1958 through 1962 they were effectively controlled by poisoning with
326 JULANDER ET AL.
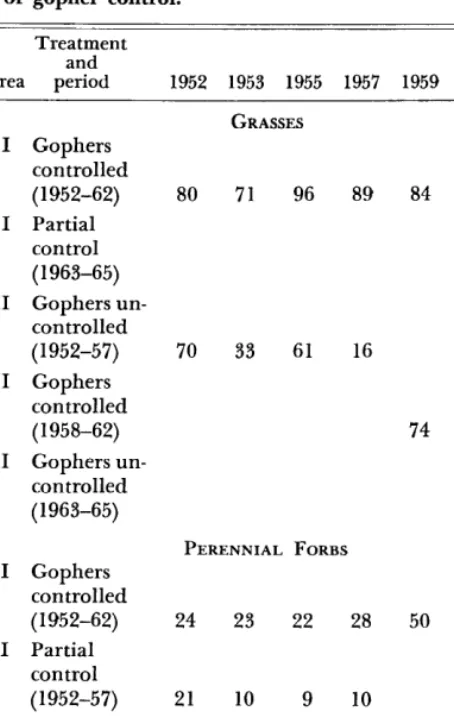
Table 1. Stand index of grasses and perennial forbs on Table 2. Gopher mounds per acre and percent frequency seeded range at Monte Cristo (Utah) in selected years of winter casts on seeded Areas I and II in selected
of gopher control. years.
Treatment and
Area period 1952 1953 1955 1957 1959 1962 1965
Area 1952 1953 1955 1957 1959 1962 1965
Mounds
I 8 96 24 20 18 35 760
II 125 495 777l 1,410 25 54 1,210
Casts
I - 3 4 3 4 2 36
II - 71 87 83 16 3 42
1 Interpolated from original data to represent same length of season as other years.
GRASSES I Gophers
controlled (1952-62) 80 I Partial
control (1963-65) II Gophers un-
controlled (1952-57) 70 II Gophers
controlled (1958-62) II Gophers un-
controlled (1963-65)
71
33
96 89 84 90
81
Results
61 16 Stand Index
PERENNIAL FORBS I Gophers
controlled
(1952-62) 24 23 22 28
I Partial control
(1952-57) 21 10 9 10
II Gophers controlled (1958-62) II Gophers un-
controlled (1963-65)
74
50
17 78
75
40 45
61
whole oats treated with 1080 and supplemental trapping in conjunction with control on a large surrounding area of native range; then from 1963 through 1965 they were un- controlled. To summarize treatments: Area I had 11 con- secutive years of close control followed by 3 years of partial control; Area II had no control for 6 years, close control for the next 5, then 3 years with no control.
Both study areas were protected from grazing until 1957. From 1957 to 1965 they were grazed moderately by sheep in late summer.
Our first study (1952-1957) showed that on Area I, where gophers were closely controlled, an excellent stand of seeded grasses developed and was maintained. On Area II, where gophers were not controlled, an excellent stand of seeded grasses emerged but was subsequently depleted by gophers. Gophers damage grass stands in five ways. (1) They under- mine plants and destroy their roots and sometimes pull small plants into their tunnels. (2) In winter and early spring they eat, or otherwise destroy, root crowns and stem bases of well established plants. (3) Their mounds and win- ter casts cover and often kill young plants. (4) Winter casts partially seal the soil against water infiltration. (5) Gophers burrow tunnels, which excessively aerate the soil and thus aggravate summer drought (Julander et al., 1959)
Grasses.-On Area I, where a good stand of seeded grasses prevailed, the stand index for grasses remained high throughout the study (Table 1). Yearly fluctuations in frequency of grass plants ap- peared to be due primarily to varied growing con- ditions; but the decrease in frequency of grass plants in Area I after 1962 was apparently due largely to increased gopher activity as indicated by the fact that mounds and casts accounted for considerable bare ground in 1965, and established plants are not readily subject to drought. In 1965 there were 760 mounds per acre-a spectacular in- crease from the number usual during the decade of close control (Table 2). Likewise the frequency of winter casts increased from the usual 3 or 4% to 36% in 1965.
On Area II the stand index for grass from 1952 to 1957 dropped markedly. The rise to 61 y. in 1955, caused by a good seed year, was wiped out by 1957. The grass stand in 1957 was poor, and gopher damage was severe (Julander et al., 1959). Except for a few patches, the seeded grasses had been destroyed by 1957, and native species (not- ably Agropyron trachycaulum (Link) Malte, and Bromus carinatus Hook. & Am.) were the chief survivors. When gophers were closely controlled (1958-62) the stand index increased rapidly, and a fair stand of both native and seeded grasses be- came established. Then when gophers were un- controlled for three seasons (1963-65), the stand index dropped sharply. Gophers reinvaded Area II rapidly and the number of mounds per acre in- creased phenomenally (Table 2).
Table 3. Yields (lb/acre, air dry) of seeded and native grasses, in selected years, Areas I and II, under varied in- tensities of gopher control.
Area I Area II
Grass type 1955 1957 1959 1962 1965 1955 1957 1959 1962 1965
Seeded 1,170 1,275 1,110 1,079 634 265 81 3.58 530 267
Native 35 15 160 58 16 135 31 257 297 55
Total 1,205 1,290 1,270 1,137 650 400 112 615 827 322
areas. The gain in forb stand index on Area I was maintained during the 3 years of partial control, and in 1965 the vegetative stand had the appear- ance of a mixed grass-tall forb type.
On Area II the forb stand index increased while the gophers were uncontrolled (1963-65), but this increase was made mainly by some of the less de- sirable perennials including Achilles millefolium L., Potentilla spp., and Erigeron flagellaris A. Gray. This increase may have been permitted by a simul- taneous decrease in grasses. At the same time, the more desirable forbs decreased. Consequently, in 1965 the stand on Area II appeared as a rather poor mixed grass-low forb type, which had much lower forage value than Area I.
Forage Production
Grasses.-On Area I, grass production continued high throughout the 1 l-year period when gophers were closely controlled (Table 3); it averaged about 1,200 pounds per acre air dry. More than 90% of the production was from seeded species. How- ever, production decreased noticeably in 1965 after 3 years of only partial control of gophers. This de- crease appears to have been due partially to con- siderable gopher activity (Table 2) and possibly to increased competition with forbs. Total herbage of grasses and perennial forbs was still fairly high in 1965 (more than 1,000 lb per acre, air dry) and consisted mainly of good forage species.
On Area II (uncontrolled), the large gopher population rapidly reduced grass production from 1952 through 1957. Under subsequent protection from gophers, 1958 through 1962, grass production increased from a low of 112 lb per acre in 1957 to 827 lb in 1962. Both seeded and native grasses increased, but seeded species made greater gain (Table 3). During reinvasion by gophers in 1963- 65, grass production decreased to 322 lb per acre -only half the production on Area I. Native spe- cies decreased more than seeded species in pro- duction but not in percent frequency. Seeded species produced more grass per plant than the natives.
Perennial forbs.- Perennial forbs contributed little to the herbage produced on Areas I and II from 1952 to 1957. Many of them were destroyed during the seeding operation, and their reinvasion required several years even on the controlled area. From 1957 to 1965, production of perennial forbs increased greatly on Area I (Table 4). Further- more, the increase was by the more desirable forbs. Geranium fremontii Torr. and Aster foliaceus Lindl. were not completely eliminated in tilling the ground for seeding, and they were the first to show increase. Some of the more palatable species (Senecio serra Hook., Lupinus spp., Polemonium foliosissimum Gray, and Ligusticum porteri Coult. & Rose [the latter not on production plots]) were not present on either area before seeding. These
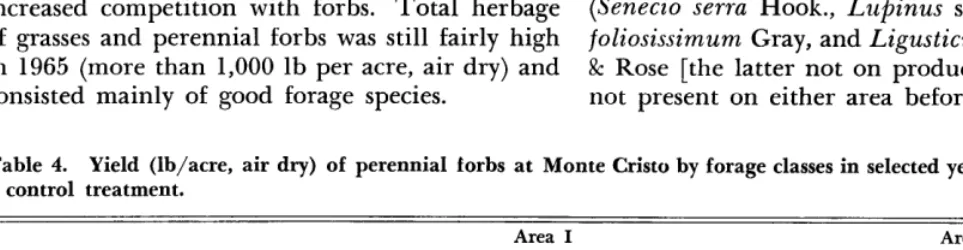
Table 4. Yield (lb/ acre, air dry) of perennial forbs at Monte Cristo by forage classes in selected years of varied gopher control treatment.
Area I Area II
Forage class 1955 1957 1959 1962 1965 1955 1957 1959 1962 1965
Poor species:
Achilles, Potentilla, Erigeron
and others
Better species: Geranium and Aster
Senecio, Lupinus, and
Polemonium
25 14 90 71 29 10 0 36 130 32
70 120 156 316 211 50 87 97 191 97
0 0 124l 652 16g3 0 0 0 26l 13l
Total 95 134 379 452 409 60 87 133
1 Includes Senecio serra; Lupinus was present on the Area but not on sample plots.
2 Includes Senecio, Lupinus, and Polemonium; Ligusticum was present on this Area, but not on sample plots. 3 Includes Senecio and Lupinus; Polemonium was present on this Area but not on sample plots.
328
JULANDER
ET AL.
Table 5. Percent occurrence of tarweed on I-ft2 plots, Areas I and II, in selected years.
Area 1952 1953 1955 1957 1959 1962 1965
I 28 18 2 0 5 0 2
II 20 65 47 72 88 56 90
species apparently invaded from adjacent aspen areas in 1958 or 1959, and increased substantially thereafter. During partial gopher control in 1962- 65 some of them decreased, but in 1965 the yield of palatable forbs was still 380 lb per acre com- pared to only 120 lb in 1957. Furthermore, while the more palatable forbs had increased, the species having lower palatability decreased.
Production of perennial forbs on Area II re- mained low until after 1959, the second year of control (Table 4). Apparently the forbs reinvaded this Area much more slowly than Area I, prob- ably because gopher occupation had modified soil and water conditions (Julander et al., 1959). After 5 years of gopher control, though, some of the tall desirable forbs mentioned previously were growing on the Area, and substantial recovery was evident. Then after 3 years of no control (1962-65), produc- tion of all classes of perennial forbs on this Area decreased considerably. By 1965 the main herbage contributors on Area II were Geranium fremontii Torr. and Achilles millefolium L.
Tarweed
Tarweed was abundant on both study areas be- fore they were seeded, but was practically elimi- nated by spring cultivation in the seeding opera- tion. Tarweed is an unpalatable aggressive annual and readily invades areas bared by gopher mounds and casts and by dead plants. Frequency of its oc- cupation indicates, to some degree, the condition of seeded stands.
On Area I tarweed grew in openings not com- pletely occupied by grasses for the first 2 years (Table 5). As the grass stand and the tall forbs increased and more fully occupied the soil, tarweed was sharply reduced for the remainder of the study period. On Area II tarweed increased as the grass stand deteriorated from 1952 to 1957. By the end of the gopher control period (1958-62) grasses and tall forbs had increased and by 1962 had crowded out much of the tarweed. After heavy reinvasion by pocket gophers (1963-65) in Area II, tarweed again became abundant.
Gopher Control and Populations
Effectiveness of gopher control on Area I has already been noted. On Area II it was effective during the 1958-62 control period. In 1958 we
Table 6. Mound counts per acre on open herbland and aspen native range adjacent to Areas I and II, in selected years.
Type
3-yr
1957 1958 1959 avg 1960 1961 1962 Open herbland 1,693 1,730 1,503 1,642 410 1,113 3,677 Aspen 1,333 1,593 1,127 1,351 613 1,827 4,037
estimated the kill at 90%. Poisoning during sub- sequent years, supplemented by trapping, kept the population low through 1962. Then when control was relaxed in 1963, gopher population on Area II returned to about the lo-year average for untreated areas. Richens (1965) found a dense population (27 to 39 per acre) on native range adjacent to our study areas.
Other records on native range indicate that gopher populations build up rapidly following con- trol or die-off. Richens reported a rapid buildup in 1961 and 1962 on control areas after 1 and 2 years of nontreatment. Mound counts on the na- tive range near our study areas showed a drastic die-off of gophers in 1960 on noncontrolled areas, but no cause was apparent. During 196 1 the pop- ulation built up again to near the 3-year average; 2 years later the population had more than doubled the 3-year average, as indicated by mound counts (Table 6).
Discussion and Conclusions
Pocket gophers destroy vegetation, and large populations may completely destroy seeded grass stands. They also destroy some valuable tall suc- culent forbs or may prevent their becoming estab- lished; this is evident by noting the difference be- tween presence of such plants on controlled areas and their absence from noncontrolled seeded areas. The population of 27 to 39 gophers per acre that Richens found at Monte Cristo in 1961 and 1962 might consume 4% to
7
lb fresh weight of vegeta- tive material per day. At this rate, in a year they might consume 435 to 670 lb of air-dry plant ma- terial per acre. This represents a large percentage of total annual production of some depleted ranges. Since roots, root crowns, and regenerative organs (corms, bulbs, rhizomes) make up a good share of gophers’ year-round diet, their foraging may be more destructive than foraging of surface-feeding animals.We have questioned how such dense populations of pocket gophers could build up on nearly pure seeded grass areas at Monte Cristo. The answer may be that at Monte Cristo several corm and fleshy-rooted forbs had nearly 100yO frequency in the grass stands. These plants completed their life cycle before grasses started rapid growth, and their underground parts supplied considerable gopher food.
Spraying to kill such plants would have to be done in very early spring, and it may be desirable to investigate the possibility of reducing gophers by this practice. Spraying to destroy other forbs may be desirable on some areas, but could not be used on deer or sheep ranges or on some cattle ranges where forbs are important forage plants. For many areas of rough, brushy, steep, and tim- bered rangelands inhabited by pocket gophers, the problem of efficient gopher control as a practical range improvement practice awaits development of some more effective method.
LITERATURE CITED
COLORADO COOPERATIVE POCKET GOPHER PROJECT COM- MIl-l-EE. 1960. Pocket gophers in Colorado. Colo. State Univ. Exp. Sta. Bull. 508s.
JULANDER, ODELL, JESSOP B. Low, AND OWEN W. MORRIS. 1959. Influence of pocket gophers on seeded mountain range in Utah. J. Range Manage. 12:219-224.
KEITH, JAMES O., RICHARD M. HANSEN, AND A. LORIN WARD. 1959. Effect of 2,4-D on abundance and foods of pocket gophers. J. Wildlife Manage. 23: 137-145.
MARSTON, RICHARD B., AND ODELL JULANDER. 1961. Plant cover reductions by pocket gophers following experi- mental removal of aspen from a watershed area in Utah. J. Forest. 59: 100-102.
REID, V. H., R. M. HANSEN, AND A. L. WARD. 1966. Counting mounds and earth plugs to census mountain pocket gophers. J. Wildlife Manage. 30:327-334.
RICHENS, V. B. 1965. An evaluation of control on the Wasatch pocket gopher. J. Wildlife Manage. 29:413-425. WARD, A. LORIN, AND RICHARD M. HANSEN. 1960. The
burrow-builder and its use for control of pocket gophers. Spec. Sci. Rep. Wildlife 47. U.S. Dep. Interior, Fish and Wildlife Serv.
8
Effects of Fire on Grasses of the
Texas High Plains1
M. J. TRLICA, JR.2 AND J. L. SCHUSTER
Research Assistant and Associate Professor of Range Management, Rangel Management Department, Texas
Technological College, Lubbock, Texas
Highlight
Fall, spring, and summer burning significantly reduced total forage production on a Texas High Plains range. Although herbage yields were less on burned plots, the vigor of the desirable blue grama (Bouteloua gradis Willd. ex HBK) appeared to be benefited by fires while the vigor of two less desirable grasses appeared to be decreased. Spring burning is recoummendei bver fall burning when moisture accumulation and erosion potential are considered.
8
Recovery from fire was quickest alter a summer burn.
Fire has been an important factor in shaping vegetation patterns for thousands of years (Sauer, 1950; Cooper, 196 1; and Humphrey, 1962). It in- fluences the growth, reproduction, and distribu- tion of many plants species (Ahlgren, 1960) by affecting such factors as soil temperature, moisture, and nutrients.
There are many accounts of the influences of
lcontribution number 62 of the International Center for Arid and Semi-Arid Land Studies, Texas Technological College, Lubbock, Texas. Received November 9, 1968; accepted for publication February 24, 1969.
2Present address: Department of Range Science, Utah State University, Logan.
accidental or planned fires upon vigor, production, and composition of plant communities. Fire ap- parently favors some species while detrimentally affecting others. This usually results in a change in composition of the plant community. The ex- tent of the change depends upon many factors such as the environmental conditions at the time of burn, plant morphology, phenological development of the individual plants, ability of plants to re- spond after fire damage, fire intensity, and environ- mental conditions after the burn.
The voluminous literature concerning fire and its use shows the importance placed upon fire as an ecologic and economic factor. Fire can be as beneficial as it is destructive. This is pointed out by the approximately equal number of published documents on the use of fire as a tool and on its control. An extensive search of the literature on fire revealed few reports concerning the influence of fire on the native vegetation on the High Plains of Texas (Trlica, 1967). Consequently this study was initiated in 1965 to study the effects of burn- ing upon the community and individual plants on a deep hardland site in the Texas High Plains. The findings should be useful in planning the use of burning as a range practice when similar environ- ments are involved.
Experimental Area and Procedure