1
Physico- Chemical and Microbial Properties of Surface and Groundwater Resources: Case Study of Kogi State, Central Nigeria
Seyi, Mepaiyeda1* and Kakaba, Madi 1
1 Department of Geology, University of Fort Hare, Private Bag X1314, Alice 5700, South
Africa.
* Correspondence; [email protected], [email protected], Tel; +27 632129422
2 ABSTRACT
Analysis of water resources of this area was carried out in order to assessing the water quality by determining the concentrations of cations, Anions, Heavy metals, Trace elements, PH, Alkalinity, Total Dissolved Solids and microbial loads in water samples. Ten (10) water samples were collected from the study area - samples each of rain water, two pond waters - 1 and 2, stream water, four (4) hand-dug wells, hand pump water and a motorized borehole. The results obtained were compared with WHO standards and it showed that all the cations in water samples are within the limits. The water samples at locations B, E, F, G, H, I, and J have high alkalinity and HC0
-3 content. The heavy metals (Pb, Ni and Cd) and trace elements (Fe and Cu) are
dominantly high in the surface waters. Microbiological substances in the water samples from the study area revealed indicator organisms higher than the WHO standard for drinking water. Samples obtained from location G, I and J recorded an absence of E. coli and are fit for human consumptions but needed to be treated due to high MPN (Most Probable Number) index of viable microorganisms as against WHO standard. This research showed that the water resources of the study area are gradually polluted and in the near future may not be good for drinking.
3 1.0 INTRODUCTION
A large number of communities in Nigeria, especially those in the Eastern highland, Western highland and central parts of Nigeria depend largely on ground water supply from Basement complex rocks from boreholes. The development of ground water resources in these parts of Nigeria are carried out under severe budgetary constraints, with little opportunity for fundamental hydro geological studies. Hard rock masses such as the basement-rock masses covering about two third (2/3) of the land surface of Nigeria in their under -formed state possess little or no primary inter-granular porosity or permeability and the hydro-geological properties are thus mainly determined by secondary storability and transmissivity.
It is not possible to find absolutely pure water in nature even rain water, when it drops just emitting from the clouds, may be considered pure, but as the drops fall down, certain gasses get dissolved in it and make impure (1). Depending largely upon the sources from which they are derived, surface and groundwater so obtained may differ greatly in purity and suitability for the purposes for which they are required (2). Ground water is the water which is stored by nature, underground in the water bearing formation of earth’s crust. This could be natural springs, well and boreholes, infiltration galleria and radial collector wells (2).
4
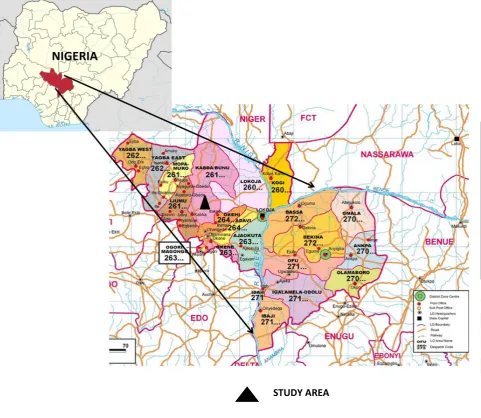
This research examined the quality of drinking water around Agbadu- Bunu in Kabba Local Government Area of Kogi State, central Nigeria. The area has a fast growing population and increasing level of diverse socio-economic activities. Factors responsible for water contamination and the type of contaminants in water to determine its deviance from the normal were examined.
Figure 1; Map of Nigeria showing the study area
5
KEY
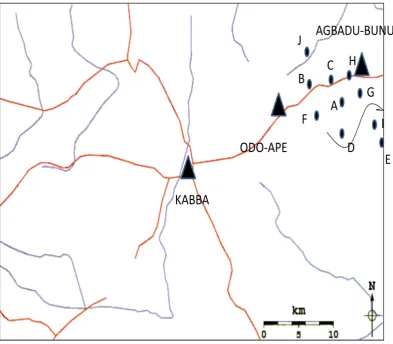
Figure 2; Location map of the study area showing the sample points Stream channel
Stream channel Settlement
6
Agbadu - Bunu Community lies between latitude 7.917860 and longitude 6.269110. The
Community is located within Kogi state, central Nigeria and it is accessible by motorable road along Obajana - Kabba road. Agbadu - Bunu Community experiences distinct dry and wet seasons. There is a fairly high amount of rainfall in the wet season and water is readily available during the wet season but may be come dried the dry season. This is particularly so in areas underlain by crystalline rocks of the basement complex where many rivers are intermittent and the underlain lithology does not favor large accumulation of ground water (4). Therefore the major task in such area is to locate ground water while the issue of ground water qualities receives little attention. The study area lies within the tropical savannah climate with distinct dry and wet seasons with an average maximum temperature of 33.2o and an average minimum
temperature of 22.8o
c having distinct dry and wet seasons. The dry season occurs between
November and February while the rainy season is between March and October (7-8 months). Mean annual evaporation for the study area ranges between 750mm-1200mm. The mean annual rainfall in the area is 2000mm-2500mm. There is usually severe harmattan in December and January; this is the period when the north-east trade wind begins to blow towards the country from the Sahara belts.
7
Table 1; Sample points and their coordinates
SAMPLE POINTS A RW B PW1 C PW2 D SW E HDW1 F HDW2 G HDW3 H HDW4 I HPW J MBW
Location/ (N) Coordinate (E)
N
00785.69
E 00625.65
N
07.55.655
E 006015.75
N
07.55.655
E 006015.75
N
07055.477
E 066016.032
N 0755.025 E 0061.6138 N 0755.051 E 00616.160 N 0755.055 E 00615.7552 N 0755.087 E 06615.757 N 0755.27 E 0061.614 N 0755.03 E 0061.613
KEY: RW: Rain Water, PO: Pond Water, HDW: Hand Dug Well, HPW: Hand Pump Water, MPW: Motorized Pump Water
Previous work on the physico-chemical characteristics of surface and ground water in central Nigeria has been carried out (5). It was reported that the concentration of cations and Anions in the water resource of certain parts of central Nigeria conformed to the World Health
8 2.0MATERIALS AND METHODS
2.1 FIELD WORK
A preliminary (reconnaissance) survey of the study area was carried out in order to study the various sources and kind of drinking water available in Agbadu - Bunu community in Kogi state, central Nigeria. This survey helped in the locations of various water sources and was marked out for random sample collection. Global Positioning System (GPS) was used to measure the longitude and the latitude of the respective sample locations as well as the distance above sea level. The source of data for this research work is divided into two, the Primary Source and the Secondary Source of data. Primary data were water samples rain water, two pond water sources, stream water, 4 Hand dug wells and 2 borehole water samples. Two samples each of the above water sources were collected. One set of samples were analyzed for physico-chemical properties while the other set of samples were analyzed to determine the microbial components. Secondary data source was the review of published research works, journals, textbooks, scientific discussion and first hand information and other relevant works on water quality.
2.2 SAMPLING TECHNIQUES
Two different types of containers were used for collection of sample for analysis in the laboratory. Bottles for microbiological samples were first washed with detergent, rinsed with distilled water, dried and sterilized at 1500c for 2hours while other plastic bottles were washed
9
(Hand Pump Water and Motorized Borehole) were collected after the mouth of the tap was first swabbed with cotton wool soaked with alcohol (ethanol) for sterilization. Some quantities of the water were first pumped out to create room for fresh water from the source and also help in flushing out bacteria or other possible contaminants along the lining of the pipe.
After collection, the samples were protected from reacting with air by tightening the cork properly, packed into a small cooler and transported to the laboratory for analysis. There it was kept in the refrigerator awaiting analysis. The water samples taken from both surface (Stream, Rain, Pound) and ground (Hand Dug Wells/Boreholes) water were collected at random and labeled accordingly as A, B, C, D, E, F, G, H, I and J respectively.
2.3 LABORATORY ANALYSIS
The chemical analytical procedures employed the use of Atomic Absorption Spectrophotometer (AAS). The concentrations of cations, Anions, Heavy Metals and Trace elements were analyzed. Physico-chemical parameters were analyzed based on the physical changes associated with chemical reactions. The different methods used were in accordance with Hydrological Project Technical Assistance (HPTA) method for standard analytical procedure for water. The PH of the samples was determined using a PH meter (Mode: HP 2211 PWORP meter). 10ml of each of the sample was poured in to a sterile beaker and the anode of the PH meter was inserted into it, allowed to stay till for some time before the readings were taken and recorded one after the other. The stainless sensor was rinsed with distilled water after each reading.
2.3.1 DETERMINATION OF CATIONS IN WATER
10
PROCEDURE; Reagents used for cations concentration in water sample are basically 1000ppm of each of the elements to be determined. In this case, 1000ppm of Ca, Mg, K, Na, Pb, Mn, Fe and Cu were prepared and used accordingly.From the stock solution, i.e. 1000ppm of each of the element, 1000ppm was prepared by diluting 10ppm stock solution to 100ml, then 2, 4, 6, 8 and 10ppm working standard of each element to be used for AAS calibration. Then concentration (in PPM) determination for the water samples using the respective Cathode lamp of the element in question were carried out.
2.3.2 DETERMINATION OF ANIONS IN WATER
A. NITRATE (N03) (7)
APPARATUS AND REAGENTS; Spectrophotometer (Model Genesys 20), Analytical balance and Standard flasks
- 4ml of sodium hydroxide 160g (NaOH) in 1000ml of distilled water.
- 5% Salicylic acid in concentrated H2SO4 made to 100ml, prepared a day before use and
allowed to be stable for seven (7) days.
- Standard Nitrate: 7.223g dry KN03 was dissolved and made up to one litre with distilled
water. This solution gave 1000ppm of N03.
- The stock solution was distilled to 50ppm and then 1, 2, 4 and 8ppm were prepared as working standard.
11
one (1) hour for color development and twelve hours for stabilization. The absorptions were read from spectrophotometer at 410nm
B. DETERMINATION OF SULPHATE (S04) (TURBID METRIC METHOD)
APPARATUS; Spectrophotometer (Model Genesys 20), Analytical balanceand standard flask
REAGENTS AND THEIR PREPARATION
- Bacl2 reagent: 0.6g gelatin in 200ml of hot (700c) distilled water was allowed to cool and
kept on the refrigerator at about 40c for sixteen (16) hours. The semi-gelatinous fluid was brought
to room temperature and 2g of analytical grade of Bacl2 was dissolved in the fluid.
- 0.543g of H2S04 was dissolved in 100ml distilled water which gave 50ppm of S04. Then
1, 2, 3 and 4ppm standards were further prepared.
PROCEDURE; 25ml of each water samples were pipetted in to different 50ml standard flask followed by 20ml of distilled water, then 2ml of gelatinous Bacl2 solution was also added and
made up to 50ml mark of the standard flask. The mixture was allowed to stand for about 30minutes. The absorbance of standard solutions were read from the spectrophotometer at 420mm
C. DETERMINATION OF CHLORIDE (Mohr’s Method)
APPARATUS AND REAGENTS; Titration Apparatus, Analytical Balance, 0.025m silver nitrate solution, 5% potassium chromate indicator
12
precipitate persisted. The titre value was recorded as VI. The titration was repeated twice and the
average volume used was determined for each sample of water.
Cl (ppm) = VI X 0.025 X 35.5 X 1000
13 3.0 RESULTS
The results of the concentrations of cations, Anions, Heavy Metal, Trace Elements, PH, Alkalinity and Total Dissolved Solids in the water resources (Surface and Ground water) are shown in the tables 3.1, 3.2, 3.3, 3.4 and 3.5 respectively. While the average concentrations in the study area are shown in tables 3.6, 3.7, 3.8, 3.9, 3.10, 3.11, 3.12, 3.13, 3.14, and 3.15 respectively. Tables 3.16, 3.17, 3.18, 3.19, and 3.20 shows the comparisons of the average concentrations of Cations, Anions, Heavy Metals, Trace Elements and PH, Alkalinity and Total Dissolved Solids of the water resources of the study area with the World Health Organization (WHO) standard for drinking water. Figure 3 to 6 shows the plots of the respective concentration parameters against the sample locations
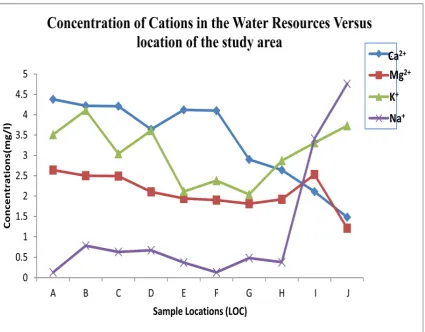
Table 3.1: Concentrations of cations in the Water Resources of the Study Area (mg/L)
Sample A = Rain Water (RW), sample B and C = Pond Water (PW1 & PW2),
Sample D = Stream Water (SW), samples E, F, G, and H= Hand Dug Well (HDW1 – 4), Sample I and J = Boreholes (Hand Pump Well and Motorized Borehole) respectively Samples Location/ Parameter A (RW) B (PW1) C (PW2) D (SW) E (HDW1) F (HDW2) G (HDW3) H (HDW4) I (HPW) J (MBH)
Ca2+ 4.38 4.22 4.21 3.64 4.12 4.101 2.90 2.64 2.11 1.48
Mg2+ 2.64 2.50 2.49 2.103 1.94 1.90 1.81 1.92 2.53 1.21
K+ 3.51 4.11 3.04 3.61 2.11 2.38 2.04 2.87 3.31 3.73
14
15
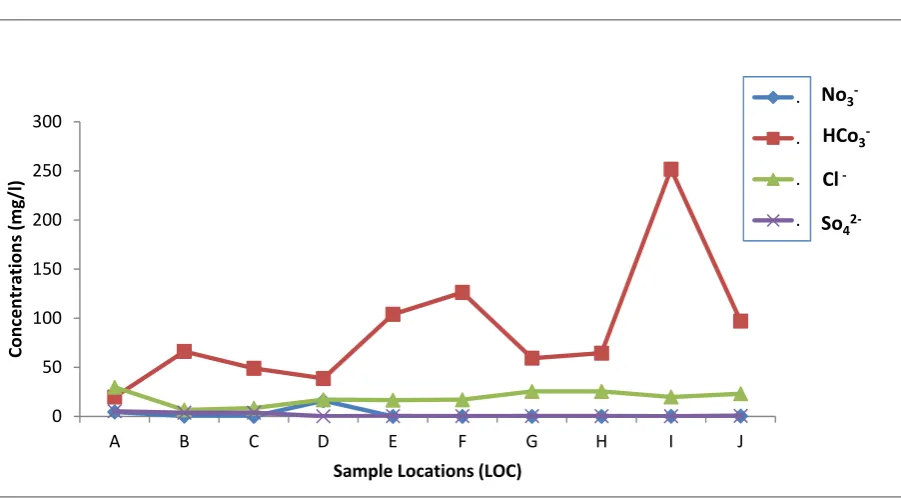
Table 3.2: Concentrations of Anions in the Water Resources of the Study Area (mg/l) Samples Location/ Parameter A (RW) B (PW1) C (PW2) D (SW) E (HDW1) F (HDW2) G (HDW3) H (HDW4) I (HPW) J (MBH) N0
-3 4.53 0.27 0.019 15.943 0.019 0.016 0.024 0.016 0.142 0.39
HC0
-3 19.76 66.15 48.97 38.67 103.95 126.30 59.30 64.43 251.72 97.08
CL- 29.78 6.62 8.51 17.02 16.54 17.02 25.53 25.52 19.85 23.16
S0-4 5.32 3.801 3.803 0.25 0.38 0.36 0.38 0.39 0.25 0.66
Sample A = Rain Water (RW), sample B and C = Pond Water (PW1 & PW2),
Sample D = Stream Water (SW), samples E, F, G, and H= Hand Dug Well (HDW1 – 4), Sample I and J = Boreholes (Hand Pump Well and Motorized Borehole) respectively
Figure 4:Plots of Concentrations of Anions in the Water Resources Versus Locations of the Study Area A- Rain Water, B- Pond Water 1, C- Pond Water 2, D- Stream Water, E- Hand dug Well 1, F- HDW 2, G- HDW 3, H- HDW 4, I- HPW and J- MBH
0 50 100 150 200 250 300
A B C D E F G H I J
Co nc en tr at io n s (m g/ l)
Sample Locations (LOC)
.
.
.
.
No3
-HCo3
-Cl
2-16
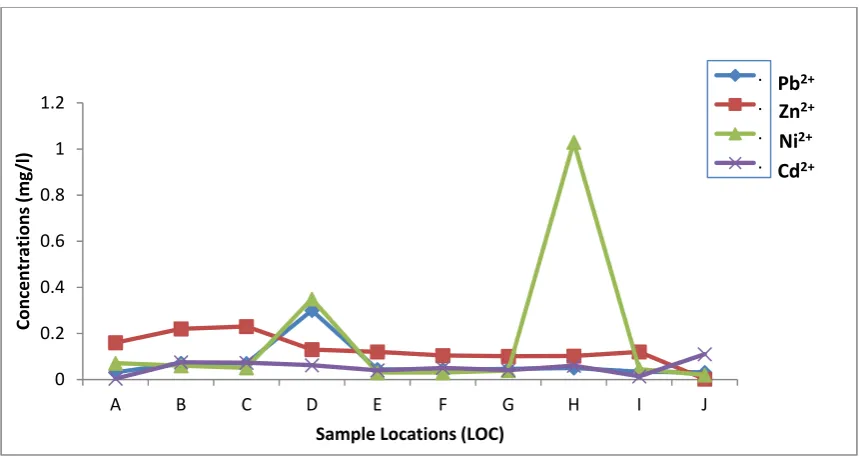
Table 3.3: Concentrations of Heavy Metals in the Water Resources of the Study Area in (mg/L) Samples Location/ Parameter A (RW) B (PW1) C (PW2) D (SW) E (HDW1) F (HDW2) G (HDW3) H (HDW4) I (HPW) J (MBH)
Pb2+ 0.031 0.071 0.07 0.30 0.044 0.043 0.046 0.05 0.034 0.031
Zn2+ 0.16 0.22 0.23 0.13 0.12 0.104 0.101 0.102 0.12 0.002
Ni2+ 0.071 0.06 0.051 0.35 0.03 0.03 0.039 0.03 0.045 0.02
Cd2+ 0.004 0.075 0.073 0.062 0.04 0.05 0.041 0.06 0.014 0.011
Sample A = Rain Water (RW), sample B and C = Pond Water (PW1 & PW2),
sample D = Stream Water (SW), samples E, F, G, and H= Hand Dug Well (HDW1 – 4), sample I and J = Boreholes (Hand Pump Well and Motorized Borehole) respectively
Figure 5: Plots of Concentration of Heavy Metals in the Water Resources Versus Locations of the Study Area
0 0.2 0.4 0.6 0.8 1 1.2
A B C D E F G H I J
Concentrations
(mg/l)
Sample Locations (LOC)
17
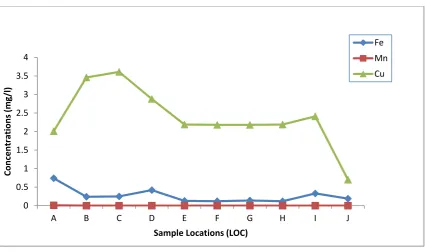
Table 3.4: Concentrations of Trace Elements in the Water Resources of the Study Area (Mg/L) Samples Location/ Parameter A (RW) B (PW1) C (PW2) D (SW) E (HDW1) F (HDW2) G (HDW3) H (HDW4) I (HPW) J (MBH)
Fe 0.74 0.241 0.25 0.42 0.13 0.12 0.14 0.12 0.33 0.19
Mn 0.01 BDL BDL BDL 0.00 0.00 0.00 0.00 0.00 0.00
Cu 2.01 3.46 3.61 2.88 2.19 2.18 2.18 2.19 2.41 0.70
Sample A = Rain Water (RW), sample B and C = Pond Water (PW1 & PW2),
Sample D = Stream Water (SW), samples E, F, G, and H= Hand Dug Well (HDW1 – 4), Sample I and J = Boreholes (Hand Pump Well and Motorized Borehole) respectively
Figure 6: Plots of Concentrations of Trace Elements in the Water Resources versus Locations of the Study Area
0 0.5 1 1.5 2 2.5 3 3.5 4
A B C D E F G H I J
Co ncen tr at io ns (m g/l)
Sample Locations (LOC)
18
Table 3.5: Value of PH, Alkalinity and Total Dissolved Solids (TDS) in the Water Resources of the Study Area
Samples Location/ Parameter
A (RW)
B (PW1)
C (PW2)
D (SW)
E (HDW1)
F (HDW2)
G (HDW3)
H
(HDW4) I (HPW)
J (MBH)
PH 6.95 7.18 6.96 7.06 7.22 7.01 6.82 6.76 7.21 7.66
Alkalinity 43.33 133.33 100.00 80.00 206.67 250.00 120.00 130.00 493.33 193.33
TDS 0.00 20.00 20.00 20.00 380.00 20.00 20.00 20.00 360.00 20.00
Sample A = Rain Water (RW), sample B and C = Pond Water (PW1 & PW2),
Sample D = Stream Water (SW), samples E, F, G, and H= Hand Dug Well (HDW1 – 4), Sample I and J = Boreholes (Hand Pump Well and Motorized Borehole) respectively
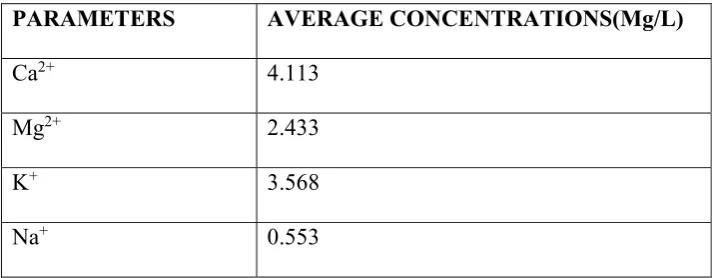
Table 3.6: Average Concentrations of cations in the Surface Water Resources of the Study Area
PARAMETERS AVERAGE CONCENTRATIONS(Mg/L)
Ca2+ 4.113
Mg2+ 2.433
K+ 3.568
19
Table 3.7; Average Concentrations of cations in the Ground Water Resources of the Study Area
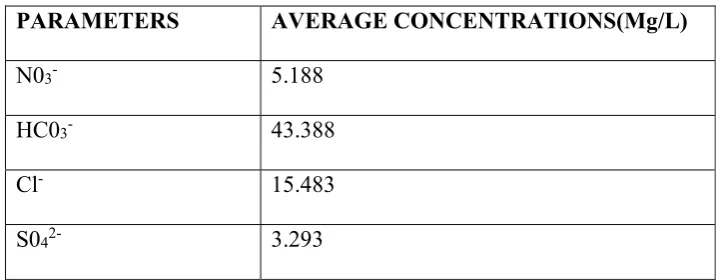
Table 3.8: Average Concentrations of Anions in the Surface Water Resources of the Study Area
Table 3.9: Average Concentrations of Anions in the Ground Water Resources of the Study area
PARAMETERS AVERAGE CONCENTRATIONS(Mg/L)
Ca2+ 2.892
Mg2+ 1.885
K+ 2.743
Na+ 1.588
PARAMETERS AVERAGE CONCENTRATIONS(Mg/L)
N03- 5.188
HC03- 43.388
Cl- 15.483
S042- 3.293
PARAMETERS AVERAGE CONCENTRATIONS(Mg/L)
N03- 0.101
HC03- 116.13
Cl- 21.268
20
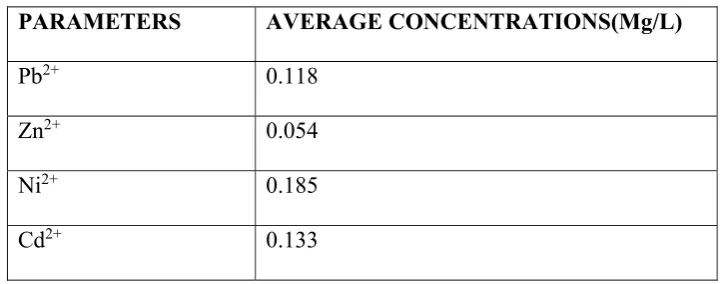
Table 3.10: Average Concentrationsof Heavy Metals in the Surface Water Resources of the Study Area
Table 3.11; Average Concentrations of Heavy Metals in the Ground Water Resources of the Study Area
Table 3.12: Average Concentrations of Trace Elements in the Surface Water Resources of the Study Area
PARAMETERS AVERAGE CONCENTRATIONS(Mg/L)
Pb2+ 0.118
Zn2+ 0.054
Ni2+ 0.185
Cd2+ 0.133
PARAMETERS AVERAGE CONCENTRATIONS(Mg/L)
Pb2+ 0.041
Zn2+ 0.036
Ni2+ 0.92
Cd2+ 0.398
PARAMETERS AVERAGE CONCENTRATIONS(Mg/L)
Fe 0.213
Mn 0.003
21
Table 3.13; Average Concentrations of Trace Elements in the Ground Water Resources of the Study Area
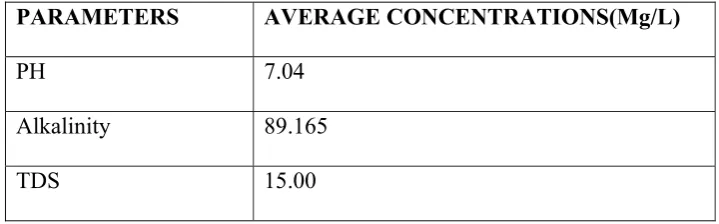
Table 3.14; Average values of PH, Alkalinity and Total Dissolved Solids (TDS) in the Surface Water Resources of the Study Area.
Table 3.15; Average values of PH, Alkalinity and Total Dissolved Solids (TDS) in the Ground Water Resources of the Study Area
PARAMETERS AVERAGE CONCENTRATIONS(Mg/L)
Fe 0.172
Mn 0.00
Cu 1.975
PARAMETERS AVERAGE CONCENTRATIONS(Mg/L)
PH 7.04
Alkalinity 89.165
TDS 15.00
PARAMETERS AVERAGE CONCENTRATIONS(Mg/L)
PH 7.113
Alkalinity 232.22
22
Table 3.16: Showing the Comparison of Average Concentrations of Cations in the Water Resources of the Study Area with WHO standards
Cations WHO,2011 Guideline
Maximum Value Mg/L Guideline Value Mg/L Maximum Admissible Concentration Mg/L Analyzed
Average Value of Study Area Mg/L
Calcium (Ca2+)
- 100.00 - 3.503
Sodium (Na+) 200.00 20.000 150.000 1.071
Potassium (K+) - 10.000 12.000 3.156
Magnesium (Mg2+)
- 30.000 50.000 2.159
Table 3.17: Comparison of Average Concentrations Anions in Water Resources of the Study Area with WHO standards
Anions WHO,2011 Guideline
Maximum Value Mg/L Guideline Value Mg/L Maximum Admissible Concentration Mg/L Analyzed
Average Value of Study Area Mg/L
Chloride ion (Cl-)
250 - - 18.376
23 (S042-)
Nitrate ion (N03-)
50 - - 2.645
Hydrogen trioxocarbonate IV ion (HC03-)
50 - - 80.209
Table 3.18: Comparison of Average Concentrations of Heavy Metals in the Water Resources of the Study Area with WHO standards
Heavy Metals
WHO,2011 Guideline
Maximum Value Mg/L
Guideline Value Mg/L
Maximum Admissible Concentration Mg/L
Analyzed Average Value of Study Area Mg/L
Lead (Pb2+) 0.010 - 0.005 0.080
Cadmium (Cd2+)
0.003 - 0.005 0.045
Zinc (Zn2+) 3.000 0.100 - 0.139
24
Table 3.19: Comparison of Average Concentrations of Trace Elements in the Water Resources of the Study Area with WHO standards
Trace Elements
WHO,2011 Guideline
Maximum Value Mg/L Guideline Value Mg/L Maximum Admissible Concentration Mg/L Analyzed Average Value of Study Area Mg/L
Iron (Fe) 0.300 0.050 0.200 0.193
Manganese (Mn)
0.050 - - 0.002
Copper (Cu) 0.05 - - 2.483
Table 3.20: Comparison of Average values of PH, Alkalinity and Total Dissolved Solids (TDS) Resources of the Study Area with WHO standards
Other Parameters
WHO,2011 Guideline
Maximum Value Mg/L Guideline Value Mg/L Maximum Admissible Concentration Mg/L Analyzed Average Value of Study Area Mg/L
PH 8.500 6.5-8.5 6.5-8.5 7.082
Alkalinity 100.000 - - 174.999
25
Total Bacterial Count (TBC) value of the water samples analyzed has the mean value of 199.75 X 10³cfu/100ml and 50 X 103cfu/100ml for surface and ground water of the area
respectively. The highest values ranging from 2.35 X 10²cfu/100ml to 1.38 X 10²cfu/100ml for
surface and ground water respectively against the 100cfu/ml for WHO standard for potable water. Total Coliform Count of the water samples has mean values of 2.0 X 10cfu/100ml and 0.717 X 101cfu/100ml for surface and ground water respectively. The highest values ranging
from 0.23 X 10²cfu/100ml to 0.30 X 10²cfu/100ml for surface and ground water respectively
against zero (0) cfu/100ml for WHO standard for potable water (Table 3.21). E. Coli Count for the water samples analyzed is absent in most of the samples and only present in very minute amount in some of the samples. Though no particular amount was recorded, this mostly conformed with the zero (0) cfu/100ml for WHO standard for potable water.
Table 3.21; Microbiological analysis of water samples in the study area
Microbiological/ Samples Factors A RW B PW1 C PW2 D SW E HDW1 F HDW2 G HDW3 H HDW4 I HPW J MBW
Location/ (N) Coordinate (E)
N
00785.69
E 00625.65
N
07.55.655
E 006015.75
N
07.55.655
E 006015.75
N
07055.477
E 066016.032
N 0755.025 E 0061.6138 N 0755.051 E 00616.160 N 0755.055 E 00615.7552 N 0755.087 E 06615.757 N 0755.27 E 0061.614 N 0755.03 E 0061.613 Protozoan
(Count/ml)
0
12
0
0
0
0
0
0
0
0
Total Plate
Count(cfu/ml)
5
110
129
235
50
138
40
57
10
05
Total
Coliforms(cfu/1 00ml)
10
30
17
23
30
03
0
10
0
0
Salmonella Typhi
Absent Absent Absent Absent Absent Absent Absent Absent Absent Absent
26
E.Coli Absent Present Present Present Present Present Absent Present Absent Absent
Streptococcus Faecalis
Absent Absent Absent Absent Absent Absent Absent Absent Absent Absent
MPN
Index<10/100ml
2400 2400 94
8
2400 920
11
2
2400 26
Accept Not accept
Not accept
Not accept
Not accept
Not accept
Accept Not accept
Accept accept
4.0 DISCUSSION
The quality of water is most often a function of the mineralogical and geochemical characteristics of the rocks underlying the area (8). Most minerals in rocks are soluble under appropriate geochemical condition. The quality of ground water therefore, in some parts of the country, particularly shallow ground changed as a result of human activities. Ground water is less susceptible to bacterial pollution than surface water because the soil and rocks through which ground water flows screens out most bacteria’s (9). Bacteria however occasionally find their way into ground water sometimes in dangerously high concentrations. But, freedom from bacteria’s pollution alone does not mean that the water is fit for drinking. Many unseen dissolved minerals and organic constituents are present in ground water in various concentrations. Most of which are harmless or even beneficial while others are harmful and a few may be highly toxic.
27
quality of water resources (Surface/Ground) in the study area can be degraded by excessive waste disposal and dissolved minerals which can upsets the balance that exist between plants and animals with severe effects on all forms of life.
4.1 CONCENTRATIONS OF ANIONS IN THE SURFACE AND GROUND WATER RESOURCES OF THE STUDY AREA
Carbonate (HC03-):
The World Health Organization standard has given the guideline maximum concentration of carbonate to be 50ml/L (10). The results of the analysis showed that the concentrations of carbonate in the surface water were 19.76mg/L, 66.15mg/L, 48.97mg/L and 38.67mg/L respectively. Their average is 43.388mg/L. However, the results of the ground water (Hand dug wells and boreholes) concentration ranged from 103.95mg/L, 126.30mg/L, 59.30mg/L, 64.43mg/L, 251.72mg/L to 97.08mg/L. their average concentration is 116.13mg/L. The analysis of surface water concentration shows that three (3) of the four (4) water samples analyzed were within the World Health Organization standard limit and is therefore safe, while the ground water concentration for HC03- is higher than the World Health Organization standard limit. This
is hard water that is not safe for drinking, except by boiling.
Nitrate (N03-) and Sulphates:
28
0.142mg/L to 0.39mg/L respectively. Their average concentration is 0.101mg/L. The surface and ground water concentrations fall below the World Health Organization standard limit and are therefore safe for drinking. A very low level of nitrate might be that the water contains less or no organic matter water as revealed by (2). The World Health Organization standard for the guideline maximum concentration of sulphate ion is 250mg/L (10). The results of the analysis show that the concentrations of sulphate in surface water are 5.32mg/L, 3.801mg/L, 3.803mg/L, 0.25mg/L respectively. Their average concentration is 3.293mg/L. However, the results of the ground water (Hand dug wells and boreholes) concentrations ranges from 0.38mg/L, 0.36mg/L, 0.38mg/L, 0.39mg/L, 0.25mg/L to 0.66mg/L. their average concentration is 0.403mg/L. The surface and ground water concentration fall below the World Health Organization standard limit and is therefore safe for drinking. The low level of sulphate is attributed to the geological profile of the soil and the mineral constituent of the source of water used.
Chloride (Cl-):
The World Health Organization standard has shown the guideline maximum concentration for chloride (Cl-) as 250mg/L (10). The results of the analysis show that the
29
4.2. CONCENTRATIONS OF CATIONS IN THE SURFACE AND GROUND WATER RESOURCES OF THE STUDY AREA
Calcium (Ca2+):
The World Health Organization standard showed that the guideline maximum concentration for calcium is 100mg/L (10). The results of the analysis carried out on the samples collected from the surface water resources of the study area shows the concentrations of calcium to be 4.38mg/L, 4.21mg/L and 3.64mg/l in rain water, pond water 1 and 2 and stream water respectively for calcium in the samples collected from the surface water, the average was 4.113mg/l. This concentration is below the maximum concentration guideline of the World Health Organization (WHO, 2011) Standard for drinking water meaning that the surface water is safe for drinking. However, the results of the ground water (Hand dug wells and boreholes) concentration ranges from 4.120mg/l, 4.101mg/l, 2.90mg/l, 2.64mg/l, 2.11mg/l to 1.48mg/l. Their average concentration is 2.89.mg/l (Table 3.7). Therefore, the concentration of calcium (Ca2+) in both surface and ground water fall below the World Health Organization standard limit
and is considered safe for drinking.
Magnesium (Mg2+):
30
(Hand dug wells and boreholes) concentrations ranges from 1.94mg/l, 1.90mg/l, 1.81mg/l, 1.92mg/l, 2.53mg/l to 1.21mg/l. Their average concentration is 1.885mg/l. Therefore, the surface and ground water concentration falls below the World Health Organization standard limit and is safe for drinking.
Potassium (K+):
The World Health Organization standard for the guidelines maximum concentration for potassium is 12.00mg/l (10). The results of the analysis show that the concentrations of potassium in the surface water are 3.51mg/l, 4.11mg/l, 3.04mg/l and 3.61mg/l respectively, their average concentration is 3.568mg/l. This shows that the concentration is below the permissible limit of the concentration of potassium in drinking water by the World Health Organization. However, the results of ground water (Hand dug wells and boreholes) concentrations ranges from 2.11mg/l, 2.38mg/l, 2.04mg/l, 2.87mg/l, 3.31mg/l and 3.73mg/l. Their average concentration is 2.743mg/l. Therefore, the concentration of potassium (K+) in both water
resources fall below the World Health Organization standard limit and the waters are considered safe for drinking.
Sodium (Na+)
31
wells and boreholes) concentrations ranges from 0.37mg/l, 0.13mg/l, 0.48/l, 0.38mg/l, 3.41mg/l their average concentration is 1.588mg/l to 4.76mg/l. The ground water concentrations also fall below the World Health Organization standard limit and are therefore safe for drinking.
4.3 CONCENTRATIONS OF HEAVY METALS IN THE SURFACE AND GROUND WATER RESOURCES OF THE STUDY AREA
Lead (Pb2+):
The World Health Organization shows that the standard guideline maximum concentration for lead is 0.010mg/l and the maximum admissible concentration is to be 0.005mg/l. The results of the analysis carried out on samples collected from the surface water of the study area shows that the concentrations of lead is 0.031mg/l, 0.071mg/l, 0.07mg/l, 0.30mg/l respectively. Their average concentration is 0.118mg/l (Table 3.10). The concentration is above the World Health Organization standard limit for drinking water. However, the concentration of lead (Pb) in the ground water ranges from 0.044mg/l, 0.043mg/l, 0.046mg/l, 0.05mg/l, and 0.034mg/l to 0.031mg/l (Table 4.3). Their average concentration is 0.041mg/l (Table 4.10). Therefore, the concentration of lead (Pb) in the surface and ground water resources is higher than World Health Organization permissible limit. This shows that the surface water and ground water may not be safe for drinking. This increase may probably be as a result of the human activities in the environment.
Cadmium (Cd2+):
32
resources of the study area show that the concentrations of cadmium range between 0.004mg/l, 0.075mg/l, and 0.073mg/l to 0.062mg/l respectively (Table 3.3). Their average concentration is 0.054mg/l. This shows that the concentration of cadmium (Cd) is above the concentration of World Health Organization standard limit for drinking water. However, the concentrations of Cadmium (Cd) in the ground water range from 0.04mg/l, 0.05mg/l, 0.04mg/l, 0.06mg/l, and 0.014mg/l to 0.011mg/l. Their average concentration is 0.036mg/l (Table 3.10). Therefore, the concentration of cadmium (Cd) in surface and ground water resources is higher than World Health Organization permissible limit. This showed that the surface water and the ground water in the study area may not be safe for drinking. This increase may probably be as a result of the human activities in the environment.
Zinc (Zn2+):
33 Nickel (Ni2+):
The World Health Organization standard shows that the guideline maximum concentration for nickel (Ni) is 0.020mg/l (10). The results of the analysis from the surface water resources show that the concentrations are 0.071mg/l, 0.06mg/l, 0.051mg/l and 0.35mg/l respectively. Their average concentration is 0.133mg/l . But the concentration of nickel is above the World Health Organization for the surface water. However, the concentration of nickel in the ground water ranges from 0.030mg/l, for hand dug wells 1 - 4, 0.039. 0.045 for HPW to 0.02mg/l therefore, the concentration of nickel in ground water is higher than the World Health Organization permissible limit and may not be safe for drinking, except for motorized borehole that has 0.02mg/l. This increase may probably be as a result of the human activities in the environment.
4.4 CONCENTRATIONS OF TRACE ELEMENTS IN THE SURFACE AND GROUND WATER RESOURCES OF THE STUDY AREA
Iron (Fe):
34
exception of rain water, stream water and hand pump well that has the value of 0.74mg/l, 0.42mg/l and 0.33mg/l respectively. The high level of iron recorded in this work might be due to the natural occurrence of iron in the geological strata of the soil, corrosion of iron and steel materials in the case of rain water hand pump well or leachates from dump sites and vehicles (2).
Manganese (Mn)
The World Health Organization standard guideline of maximum concentration for manganese (Mn) is 0.05mg/l (10). The results of the analysis from the surface water for Manganese (Mn) are below detective limit and 0.00mg/l except for the rain water that recorded a value of 0.010. Their average concentration is 0.003mg/l. While the ground water is also below dilution limits and 0.00mg/l. This shows that both concentrations are below the permissible limit by World Health Organization. The water is therefore, safe for drinking.
Copper (Cu):
35
4.5 VALUES OF PH, TOTAL DISSOLVED SOLIDS AND ALKALINITY IN THE SURFACE AND GROUND WATER RESOURCES OF THE STUDY AREA
PH:
The World Health Organization standard limits for PH is 6.5 – 8.5. The results of the analysis from the surface water for PH are 6.95, 7.18, 6.96 and 7.06 respectively. Their average concentration is 7.04. The ground water concentration ranges from 7.22, 7.01, 6.82, 6.76, and 7.21 to 7.66. Their average concentration is 7.113. These results show that the PH concentration in both surface and ground water resources of the study area are below the permissible limits by World Health Organization. Therefore, the water is safe for drinking.
Total Dissolved Solid:
The World Health Organization standard limit for Total Dissolved Solid (TDS) is 500mg/l. The results of the analysis from the surface water for TDS is 0.00mg/l, 20.0mg/l, 20.0mg/l, and 20.0mg/l respectively as shown in Table 4.5 above. Their average concentration is 15.0mg/l. the ground water concentration ranges from 380.0mg/l, 20.0mg/l, 20.0mg/l, 20.0mg/l, 360.0mg/l to 20.0mg/l. Their average concentration is 136.67mg/l. these results obtained from the analysis of both surface and ground water of the area shows that the water in the area is safe for drinking, since it within the World Health Organization limit of 500mg/l
Alkalinity:
36
4.5). Their average concentration is 89.165mg/l. While the ground water concentration ranges from 206.67mg/l, 250.0mg/l, 120.0mg/l, 130.0mg/l, and 493.33mg/l to 193.33 respectively. Their average concentration is 232.22mg/l. The surface and ground water resources of the study area show that three (3) out of the ten (10) water samples analyzed for alkalinity is within the WHO limits of 100mg/l, with the exception of pond water one, Hand dug well (1), (2), (3) & (4), Hand pump water and motorized borehole that has the values of 133.33mg/l, 206.67mg/l, 250.0mg/l, 120.0mg/l, 130.0mg/l, 493.33mg/l and 193.33mg/l respectively. The high level of alkalinity recorded in those samples might not be far from the nature of soil that contains high level of HC03-, S032- and C032-.
Figure 7: Average Distribution of cations in the Water Resources of the Study Area
From the distribution of cations in the water resources of the study area, it was observed that the concentrations of all the cations analyzed (Ca, Mg, K and Na) are gradually rising due to the human activities on the water resources of the study area. These activities include
0 0.5 1 1.5 2 2.5 3 3.5 4
Ca Mg K Na
Di
st
ri
butio
n
s
Cations
Ca
Mg
K
37
indiscriminate dumping of refuse, gaseous emission from vehicles, application of fertilizers on farm land, e.t.c. in this analysis, calcium has the highest rate of distribution as shown above. This is followed by potassium, magnesium with sodium been very low. The average values of each analyzed cations from the distribution graph are: 3.503mg/l (Ca2+), 2.159mg/l (Mg2+), 3.156mg/l,
(K+) and 1.071mg/l (Na+). This shows that the average concentration of these cations fall below
the value of World Health Organization standard for drinking water: 100.00mg/l, 50mg/l, 12.00mg/l and 200.00mg/l respectively. This simply means that the water is safe for drinking, considering the average and individual concentrations of cation in the water resources of the study area.
Figure 8: Average Distribution of Anions in the Water Resources of the Study Area.
From the above figure, it can be observed that the average concentration of hydrogen trioxocarbonate (iv) ion (HC03-) is very high in the study area, with an average concentration of
80.209mg/l. Followed by chloride concentration of 18.376mg/l, Nitrate (2.645mg/l) and sulphate (1.848mg/l) of all the anions distribution in the water resources of the study area, bicarbonate ion
0 10 20 30 40 50 60 70 80 90 100
NO HCO Cl SO
Distribu
tion
s
Anions
NO
HCO
Cl
38
has an average concentration, which is more than the WHO standard of 50.00mg/l while other fall below standard.
Figure 9: Average Distribution of Heavy Metals in the Water Resources of the Study Area
The figure above shows that the average concentration of Nickel (Ni) is very high in the study area with an average concentration of 0.266mg/l against the WHO standard of 0.020mg/l. Also lead (Pb) has an average concentration of 0.080mg/l as against the WHO standard of 0.010mg/l, Cadmium (Cd) average concentration is 0.045mg/l against WHO of 0.003mg/l while that of zinc (Zn) average concentration is 0.139 as against the WHO standard of 3.000mg/l. The average concentration above showed that Lead, Cadmium and Nickel exceeded the maximum permissible limit by World Health Organization. While that of zinc is falls below WHO standard. Therefore, necessary precaution should be taken to reduce likely sources of wastes in the environment.
0 0.02 0.04 0.06 0.08 0.1 0.12 0.14
Pb Zn Ni Cd
Dist
ribu
tio
n
s
Heavy Metals
Pb
Zn
Ni
39
Figure 10: Average Distribution of Trace Elements in the Water resources of the Study Area.
The figure above showed that the average concentration of Copper (Cu) in the water resources of the study area is very high with an average concentration of 2.483 as against the World Health Organization standard of 0.050mg/l that of Iron (Fe) is 0.193mg/l compared to WHO, 2011 of 0.300mg/l and Manganese (Mn) has an average concentration of 0.002mg/l as against the WHO, 2011 of 0.050mg/l. The average concentration of Copper (Cu) exceeded the maximum permission limit by World Health Organization. Therefore, precautions should be taken to reduce further concentration. While the other observed trace elements fall below WHO standard.
0 0.5 1 1.5 2 2.5 3
Fe Mn Cu
Distribu
tion
s
Trace elements
Fe
Mn
40
Figure 11: Average Distribution of PH, Alkalinity and TDS in the Water Resources of the Study Area.
Figure 4.13 revealed that the average concentration of Alkaline is very high in the study area, it has an average concentration of 174.999mg/l as against WHO, 2011 of 100.00mg/l. This is follow by the average concentration of TDS with 88.00mg/l as against WHO, 2011 of 500.00mg/l. While that of PH is 7.083 as against the WHO standard of 6.5 – 8.5. However, the average concentration of Alkalinity is far higher than the WHO standard. The other observed parameter (PH and STD) falls below the World Health Organization standards.
0 20 40 60 80 100 120 140 160 180 200
PH ALKALINITY TDS
Distribu
tion
s
PH
ALKALINITY
41 5.0 CONCLUSION
It was observed in the results obtained that in all the physico-chemical analysis carried out in the study area, all the cations ( Ca2+, Mg2+, K+ and Na+) conformed to WHO standard limits for
drinking water. Also majority of the anions conformed to WHO standard limits for drinking water except for the concentration of HC03- in most of the individual water samples. However,
the level of PH and TDS are within the WHO limits for drinking water, while the alkalinity concentration in seven (7) sampled water sources fell above the WHO limits for potable water. However, the microbiological analysis carried out to determine the microbial loads in the water samples revealed that most of all the water samples analyzed the area is not fit for drinking (Table 4.26). The heavy presence of microbial loads (Total Bacterial Count, Total Coliforms Count and E. Coli in the sampled water makes it unfit for human consumption except in sample water G, I and J where the microbial loads fall below the WHO limits for drinking water.
The results also showed that there are slightly high concentrations of dissolved Anions, Heavy Metals and Trace Elements most especially HC03- in sample B, E, F, G, H, I and J. Iron
(Fe) in sample A and D, Lead (Pb2+) in all the samples analyzed, Nickel (Ni2+) in all samples
42
solvent is capable of dissolving the minerals of the underlying rocks and wastes which in turn percolates into the ground as contaminants to the ground water of the area, while others flows into the surface as run-off into streams and ponds in the area.
Moreover, the increase in improper waste disposal, use of chemicals in controlling weeds and fertilizers usage without taking into consideration the environmental effects on both ground and surface water resources of the area, may pollute the water resources of this area thereby making it unfit for human consumption.
43 APPENDIX
WATER QUALITY OF WORLD HEALTH ORGANIZATION (WHO) STANDARDS.
PARAMETERS W.H.O DESIRABLE LEVEL
Appearance CLEAR
Odour UN-OBJECTIONABLE
Colour 5
Turbidity 5
PH 7.0 – 8.5
Temp -
Conductivity -
Total Alkalinity 75
Total Hardness 75
Magnesium Hard 150
Suspended Solid -
Iron 0.1
Nitrogen Nitrate 20
Sulphate 150
Fluoride 0.0
Calcium Hargness 75
Chlorine (free) 0.1
TDS 600
44
Manganese 0.1
Copper 0.05
Lead Pb2+ 0.05
Calcium 75
Total viable plate count 10
Coliform count 10
E. Coli 0
Streptococcus faecalis NIL
Yeast/Mould cfu/ml 0
45
ACKNOWLEGDEMENT
The authors wish to acknowledge the Kogi State Rural Water Supply Agency (RUWASSA), Nigeria, for providing certain logistics in the course of the research. The Department of Geology, University of Fort Hare is also acknowledged for support in the course of this research.
REFERENCES
1. Gucharan, S., Jagdishi S. Water supply and Sanitary Engineering, 6th Edition. Standard
Publishers. Distributors - Nai Saraki New Delhi, India. (2003).pp.128-131.
ISBN10: 8180140296 ISBN 13: 9788180140297
2. Punimia, B.C, Ashok J., Arun, J. Water supply Engineering, 2nd Editions, Laxi
Publications (P) Ltd. New Delhi, India (1995). pp. 256-261 ISBN 8170080924, 9788170080923 .
3. Terrence .M. (1991). Water supply and Sewerage. Edition, 5, illustrated. Publisher,
McGraw-Hill, (1979). Original from, the University of Michigan. Digitized, Dec 4, 2007.
4. Olanrewaju, V.O, Olorundemi, M.O and Alade, O.; Chemical characteristics of groundwater from some parts of the basement complex of Nigeria. Journal of Mining and Geology, (accepted)
46
6. Ajibade, O.M., Omosanya, K.O and G.O.Odunsi. Groundwater contamination and flow direction of urban aquifer, Ibadan, Southwestern Nigeria. Proceedings, Annual
Conference of the Nigerian Association of Hydrogeologists on Water Resources Development and Climate Change. 2010 .p.10.
7. J. E. Yang, J. J. Kim, E. O. Skogley and B. E. Schaf. A Simple Spectrophotometric Determination of Nitrate in Water, Resin, and Soil Extracts. Soil Science Society of America Journal Abstract -1997.Vol. 62 No. 4, p. 1108-1115
DOI;10.2136/sssaj1998.03615995006200040036x
8. Brady , K.B.C. Groundwater chemistry.1998 volume 2, pp 2-3
9. United States Geological Survey (USGS).New Reporting Procedures Based on Long-Term Method Detection Levels and Some Considerations for Interpretations of Water-Quality Data Provided by the U.S. Geological Survey National Water Water-Quality. U.S. Geological Survey Open-File Report By Carolyn J. Oblinger Childress, William T. Foreman, Brooke F. Connor, and Thomas J. Maloney Reston, Virginia 1999 99–193
10. World Health Organisation (WHO) Library Cataloguing-in-Publication; Data Guidelines for drinking-water quality - 4th edition. (2011). ISBN 978 92 4 154815 1 (NLM