The development, validity, reliability and
practicality of a new measure of palliative care:
the Support Team Assessment Schedule.
Irene Julie Higginson BMedSci MFPHM
A thesis submitted for the degree of Doctor of Philosophy
in the Faculty of Medicine of the University of London.
(Field of study - Public Health Medicine)
University College London
ABSTRACT
Hospices and support teams offering palliative care have
increased by over four fold in the U.K. during the last decade. However, evaluations have been limited, often because of a lack of suitable outcome measures. This study aimed to develop and test the validity and reliability of a measure of palliative care provided by support teams.
Through detailed discussion of work objectives with care staff, assisted by review of the literature, the Support Team Assessment Schedule (STAS) was developed. STAS has 17 items, each scaled 0
(best) to 4 (worst), with definitions for each scale point. Median time to complete a STAS rating was 2 minutes (range <1
15). Face validity was demonstrated by use in five settings.
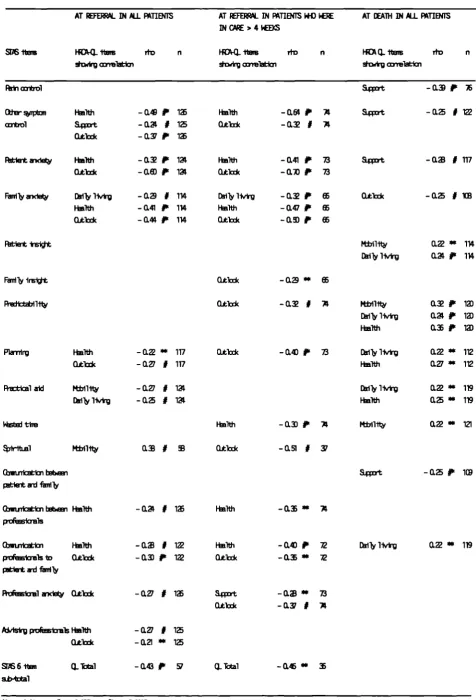
Criterion validity was assessed by comparing team ratings with ratings from patients and family members (or other carers) collected through interview. Patient and team ratings showed moderate correlations (rho ranging 0.45 - 0.66 for 5 out of 7 items): team ratings were usually closer to those of patients than those of family members. As a test of construct validity, quality of life (HCRA-QL) index items were shown to correlate with similar STAS items in patients more than four weeks before death (a STAS sub-scale of six items was correlated with the total HRCA-QL, Spearman rho -0.45).
items showed agreement or ratings within one score in 88% or more cases, Cohen's Kappas were greater than 0.48 (up to 0.87) and were highly significant (p ( 0.0005). There were high
correlation coefficients (Spearman's rho ranged 0.65 - 0.94).
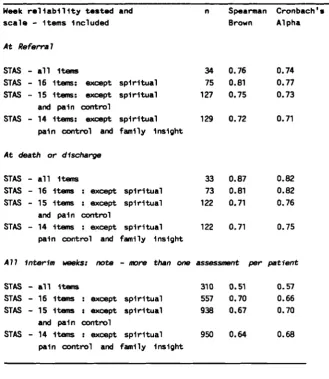
Split-half reliability and internal consistency was assessed using Spearman Brown coefficients and Cronbach's alpha for ratings at referral, at death or discharge, and on all weeks (combined). The coefficients ranged 0.68 - 0.89: slightly higher than the coefficients found for the HRCA-QL index.
Serial scores of patients that improved (the majority) and
deteriorated (a minority) under care, and results from first and last assessments of patients under the care of five support teams, indicate that the STAS was discriminating in practice. Although STAS was used to audit support team care the items are relevant to the assessment and evaluation of palliative care in other settings.
ACKNOWLEDGEMENTS
First and foremost I would like to thank my supervisor, Dr. Mark McCarthy, Senior Lecturer in the Department of Epidemiology and Public Health, University College London, for his sound advice and support during this project and for his helpful suggestions on earlier drafts of this thesis.
I am indebted to the members of the five support teams who took part in the study, for without their willing co-operation and diligence the study could not have happened. The team members and many colleagues have offered valuable advice on the items to be included in the measure, on the methods of this study and on the interpretation of the results. In particular, I thank Dr Jeff Tobias, Professor Eric Wilkes, Dr Beryl Magrath and Dr. June Crown for their interest in the study, Ms. Angela Wade and Mr. Mark Davis for their advice on the design of the data base and during the analysis, and Dr Edgar Millar, Department of Clinical Psychology, Addenbrooke's Hospital, Cambridge, for his
constructive suggestions on an earlier draft of this thesis.
The patients and families who allowed me to interview them during very difficult times deserve a special note, as do Pamela Sokel and Janet Lloyd (volunteers) and Debbie Atkinson (medical
Finally, I am grateful to my friends, family and colleagues for their support and encouragement during this study, to Dr John Reed and Dr Rachel Jenkins, Department of Health, for their generous understanding while I was writing up this work, to Mr David Perman for help in proof reading the text, and to 'Help the Hospices' the charity which funded part of this work.
CONTENTS
Page number
ABSTRACT 1
ACKNOWLEDGEMENTS 3
CONTENTS 5
LIST OF TABLES
8
LIST OF FIGURES 11
1. INTRODUCTION 13
2. AIMS 16
2.1
Aim16
2.2
Objectives16
3. LITERATURE 17
3.1
Palliative care 173.2
Measures of health care and palliative care21
3.3
The evaluation of palliative care 403.4
Summary of main findings from literature49
4. METHODS: GENERAL 50
4.1
Role for audit50
4.2
Developing measures and testing validity andreliability
56
4.3
Study setting68
5. METHODS: SPECIFIC
73
5.1
Devising items for the measure called the Support Team Assessment Schedule (STAS): observation andliterature review
73
5.2
Rating scales and definitions73
5.3
Face, content and consensus validity74
5.4
Initial practicality for intended use: pilot audit74
5.5
Criterion validity of STAS: interviews withPage number
5.6 Construct validity: STAS compared with the HRCA-QL 82
5.7 Methods to test reliability of the STAS 85
5.8 Testing the use of STAS: audit of care for the five
support teams 88
6. RESULTS. 93
6.1 The Support Team Assessment Schedule - 17 items of palliative care: items, ratings, face validity and
initial testing 93
6.2 Criterion validation of STAS, against assessments
from patients and their FMs 102
6.3 Results of Construct Validation using assessments
according to the HRCA-QL Index 112
6.4 Results of reliability of the STAS 124
6.5 Results: characteristics of patients and FMs
referred to the five teams during the audit 130
6.6 Audit results: STAS ratings during care by five
teams 146
7. DISCUSSION 176
7.1 The Support Team Assessment Schedule (STAS):
content 182
7.2 Validity and reliability of STAS 193
7.3 Practicality and value of using STAS 193
7.4 Use of STAS in determinating the effectiveness of
care: results of the audit 194
7.5 Future work 201
7.6 Adaptations of STAS 202
8. SUMMARY OF CONCLUSIONS 205
9. REFERENCES 207
10. APPENDICES 220
A. Meetings where STAS was presented 220
B. Areas of work of support teams 221
Page number
C. Support Team Assessment Schedule: definitions and
ratings for all items 223
D. Pilot study results 1 231
E. Pilot study results 2 235
F. Questionnaire used when interviewing patients to
collect independent STAS ratings 242
G. Questionnaire used when interviewing family members
(FMs) to collect independent STAS ratings 250
H. HRCA-QL index and Karnof sky index: definitions and
ratings 258
I. Descriptions of 10 simulated patients used in
reliability testing 261
J. Ratings from team members for the 10 simulated
patients 273
LIST OF TABLES Page number
Table 3.1 Alternative formulations of approaches to
quality assessment and their interrelationships. 22
Table 3.2 Selection of some common quality of life, health status and mental health measures used in cancer
clinical trials. 32
Table 4.1 Audit by any other name. 54
Table 4.2 Definitions of basic terms in validity. 59
Table 4.3 Staffing of the five support teams. 71
Table 4.4 Funding, base, area served and referrals of the
five support teams. 71
Table 4.5 Population and mortality of the local health
districts of the five support teams. 71
Table 5.1 Patient questionnaire excerpt - patient ratings
for 'pain' in the last week. 79
Table 5.2 Excerpt from simulated patient no. 20, first four
paragraphs. 86
Table 6.1. Definitions and gradings of 17 items in the
Support Team Assessment Schedule. 97
Table 6.2 Definition and ratings of STAS item pain control. 98
Table 6.3 Definition and ratings of STAS item practical
aid. 98
Table 6.4 Numbers of patients interviewed and reasons for
no interview in the 2 support teams. 103
Table 6.5 Team versus patient ratings. The proportion of ratings which were equal or within one score, the proportion where ratings were different, the weighted kappas and correlation
coefficients. 107
Table 6.6 Team versus FM ratings. The proportion of ratings which were equal or within one score, the proportion where ratings were different, the weighted kappas and correlation
coefficients. 107
Table 6.7 FM versus patient ratings. The proportion of ratings which were equal or within one score, the proportion where ratings were different, the weighted kappas and correlation
coefficients. 108
Page number Table 6.8 Differences between team, Fm and patient
ratings. 108
Table 6.9 Median (inter-quartile (IQ) range) and mean ratings according to STAS and HRCA-QL for the
128 patients who remained in care until death. 113
Table 6.10 Median (inter-quartile (IQ) range) and mean ratings according to STAS and HRCA-QL for the
33 discharged patients. 114
Table 6.11 Spearman correlations (rho) between STAS items and the HRCA-QL index, at referral and in the week of death, for all 128 patients who died in care, and at referral in the 74 patients who
remained in care for more than 4 weeks. 123
Table 6.12 40 paired assessments. Proportion of pairs where ratings were equal, equal or +1 or -1,
weighted kappas and correlations. 125
Table 6.13 Nine team ratings of five patients. Proportion of ratings which were equal to the most
commonly recorded ratings, or equal or +1 or -1,
and intraclass correlations coefficients. 126
Table 6.14 Standardised item Cronbach's alpha and split-half reliability using equal length Spearman-Brown, for STAS: applied to different weeks of
care. 129
Table 6.15 Standardised item Cronbach's alpha and split-half reliability using equal length Spearman-Brown, for the HRCA-QL index: applied to
different weeks of care. 129
Table 6.16 Age and sex of patients referred to five teams. 131 Table 6.17 Religions of patients referred to the five teams. 131 Table 6.18 Access to the patients' homes for the five teams. 135 Table 6.19 Access to the accommodation for patients with
different tenancies. 135
Table 6.20 Status of patients referred to five teams. 137
Table 6.21 Cancers of patients referred to the five teams. 142
Table 6.22 Numbers of residents who died of cancer in each team's health district, during the study
Page number Table 6.23 Observed / expected referrals for each cancer
type based on each team's referral rate. 142
Table 6.24 Number of patients in each team who commenced audit, died or were discharged after one rating or who had 2 or more ratings completed before
death or discharge. 147
Table 6.25 STAS ratings which were assessed late (missed at first contact but then assessed later during care) or were missed throughout care, in the 487
patients included in the audit. 152
Table 6.26 STAS item 'spiritual'. Late and missed
assessments for the five teams. 153
Table 6.27 STAS item 'financial'. Late and missed
assessments for the five teams. 153
Table 6.28 STAS item 'planning'. Late and missed
assessments for the five teams. 154
Table 6.29 STAS item 'family anxiety'. Late and missed
assessments for the five teams. 154
Table 6.30 STAS item 'family insight'. Late and missed
assessments for the five teams. 155
Table 6.31 STAS item 'communication between patient and
family'. Late and missed assessments for the
five teams. 155
Table 6.32 Wilcoxon matched-pairs signed-ranks test for referral versus week 2 ratings and for referral versus death ratings. The 334 patients who died
in care. 160
,
Table 6.33 Wilcoxon matched-pairs signed-ranks test for referral versus week 2 ratings and for referral versus discharge ratings. The 98 patients who
were discharged. 164
Table 6.34 Total score of 15 STAS items (all except
'financial' and 'spiritual') at referral, week
2, and at death. 173
Table 6.35 Correlations between STAS total score of 15
items with individual STAS items in patients at
referral and death. 173
Table 6.37 Standardised item Cronbach's alpha and split-half reliability using equal length Spearman-Brown, for STAS: applied to different weeks of
care. 175
LIST OF FIGURES Page number
Fig. 3.1 Spectrum of health status states. 28
Fig. 6.1 Mean (95% confidence interval) ratings from
patient, FM and team. 111
Fig. 6.2 HRCA-QL items scores in the 11 weeks before
death. 117
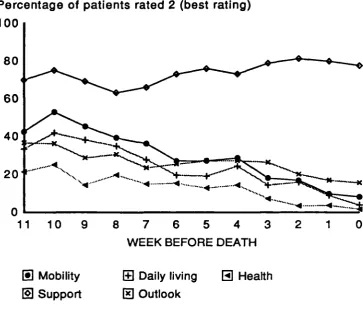
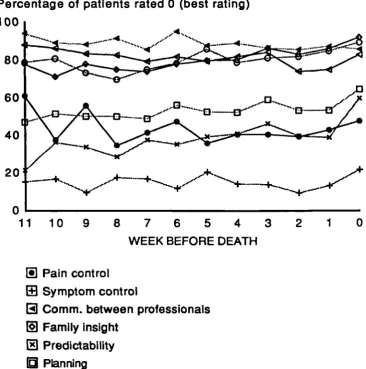
Fig. 6.3 STAS items scores in the 11 weeks before death. 118
Fig. 6.4 STAS items scores in the 11 weeks before death. 119
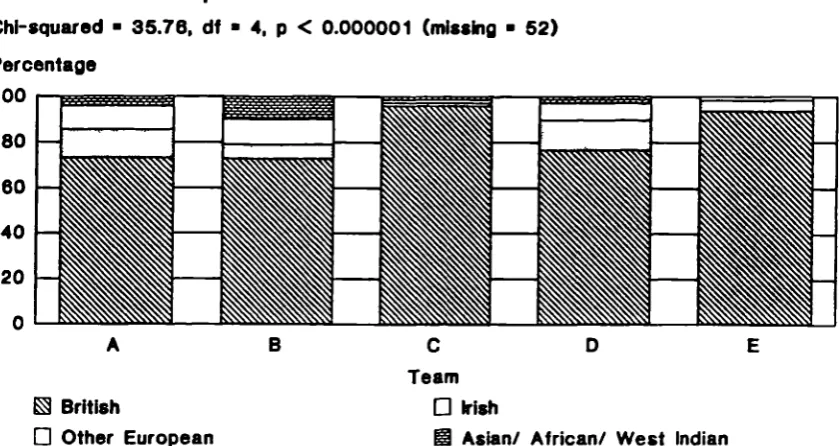
Fig. 6.5 Nationalities of patients referred to the five
teams. 132
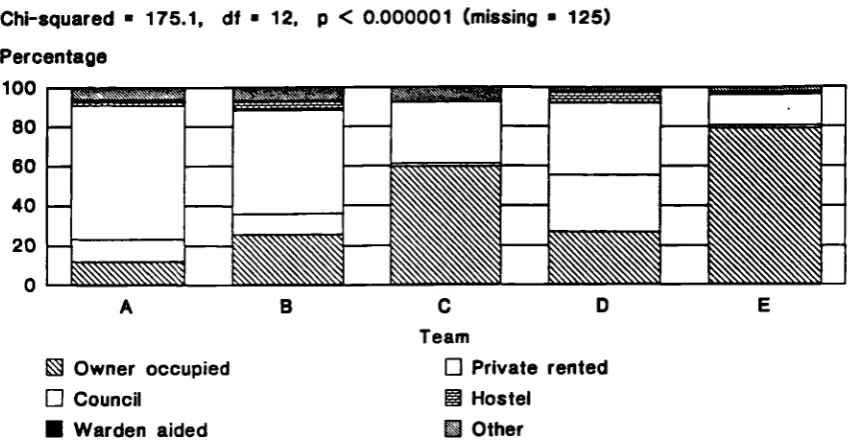
Fig. 6.6 Tenancy of patients referred to the five teams. 134
Fig. 6.7 Number of people the patients lived with. 137
Fig. 6.8 Main carers of patients. 139
Fig. 6.9 Family member's (or main carer's) employment. 139
Fig. 6.10 Referrers to the five teams. 144
Fig. 6.11 Time from cancer diagnosed to referral to team. 144
Fig. 6.12 Cumulative percentage of patients in each team
who had all 17 STAS items recorded at different
stages during care. 149
Fig. 6.13 Ratings for patients who died in care, at
referral and week 2. 158
Fig. 6.14 Ratings for patients who died in care, at
death. 159
Fig. 6.15 Ratings for patients who were discharged, at
referral and week 2. 162
Fig. 6.16 Ratings for patients who were discharged, at
discharge. 163
Fig. 6.17 Eight most common main symptoms at referral and
death (excluding pain). 167
Fig. 6.18 Dyspnoea as the main symptom. Mean (95%
confidence interval) symptom control rating. 167
Fig. 6.19 Weakness as the main symptom. Mean (95%
Fig. 6.20 Nausea or vomiting as the main symptom. Mean (95% confidence interval) ratings for symptom control.
Fig. 6.21 Mean (95% confidence interval) ratings for pain
control.
Page number
168
169
Fig. 6.22 STAS total scores for one patient from referral
to death. 172
1. INTRODUCTION
This thesis describes the development, validity, reliability and practicality of a new measure of palliative care, the Support Team Assessment Schedule (STAS).
Palliative services have expanded rapidly during the last 20 years, to assist in the provision of holistic care and relief of symptoms for dying patients and their families. This expansion has brought new challenges for accountability, evaluation and research (Dush and Cassileth 1985). In a climate of increased cost effectiveness within the health services, hospice growth will not be supported by health authorities unless the care is evaluated. Hillier (1988) pointed out that for the new
speciality to speak with authority those working in palliative care "must continue to plan services, strive for long term funding and be willing to submit themselves to audit and peer review".
Although a wide variety of measures have been developed to assess health status and quality of life or to aid clinical practice, none adequately assesses the outcomes of palliative care. These measures tend to concentrate on functioning or daily living, or on single aspects such as pain. They have not included the wider aims of palliative care and have rarely included any assessment of the family's experience. When measures were adapted for
Evaluations have been hampered by the lack of measures and failings in research design. These have assessed various outcomes believed to be associated with good palliative care, including pain and symptom control, daily living or quality of life (using established scales), patient and family anxiety, depression and satisfaction, place of care and cost to the health service (e.g. Parkes 1979a and 1980, Cartwright and Seale 1990,
Kane et al 1985, Mor el al 1988c, McCusker and Stoddard 1987).
No study has found palliative care to be worse than conventional care in these respects. In some cases little difference has been
found (Parkes 1985, Morris et al 1988), but more commonly
palliative care has been associated with increased satisfaction and better symptom control, and home care with greater periods in the terminal period spent at home (Parkes 1979b and 1980, Hinton 1979, Hannan and O'Donnell 1984). However, only two randomised controlled trials have been carried out on hospice services, both in the USA. One showed little difference between in-patient
hospice and conventional care (Kane et al 1984 and 1985,) the
other demonstrated benefits for home care (Zimmer et al 1984). In
both conventional and hospice settings the care of dying
patients is suggested to have improved over the years. This has been attributed largely to the educational effect of the hospice movement (Parkes 1985).
The cost of care has been studied in many units. In-patient
hospice care varies from unit to unit , but is usually cheaper to the health service than conventional care (Hill and Oliver 1984 and 1988, Kidder 1988b). Home care is considerably cheaper, at
between one quarter and one third the cost to the health service (see Parkes 1980, Kidder 1988a and 1988b).
The evaluations to date show that palliative care is a viable alternative to conventional care. Future evaluations will need to demonstrate the effectiveness of care, and in particular to identify where care is most effective. Clinical audit is one method of achieving this, although before this can proceed better
measures are needed.
This project aimed to develop valid, reliable and practical outcome measures of palliative care. The measures are aimed
primarily for use in support team and community settings, and for use in the audit of care, although their adaptation for other settings is discussed. The work required a number of stages. First, the items and ratings for the Support Team Assessment Schedule (STAS) were developed and then tested for face, content and consensus validity and initial practicality. Then criterion and construct validity, reliability and internal consistency of STAS were tested. Finally, STAS was tested for practicality in the audit of five support teams in the south east of England, and the results analysed to determine the effectiveness of care.
The discussion considers the methodological difficulties
encountered during the work, possible ways these may have been overcome, the properties of STAS compared with other measures, and the potential future developments and uses of STAS. A
2. AIMS
2.1 Aim
To develop outcome measures of palliative care which were valid, reliable, practical and useful to audit palliative care in
support team and community setting.
2.2 Objectives
The aim included the following objectives:
1. To develop items suitable as outcome measures for palliative care which reflected the work and goals of palliative teams. 2. To develop methods of scaling the items in the measure.
3. To test the face, content and consensus validity of the measure. 4. To test the practicality of the measure for an audit of care. 5. To test the criterion and construct validity of the measure. 6. To test the internal consistency and inter-rater reliability of the measure.
7. To determine if the measure could be used to assess the effectiveness of palliative care in different support teams, and provide useful information on when and where care was not
effective.
3. LITERATURE
3.1 Palliative care
3.1.1 Development of palliative services
Over the last 20 years there has been an increasing interest in the care of dying patients, especially cancer patients. In the U.K. and Ireland the number of in-patient specialist units or hospices grew rapidly from 17 in 1969 to 145 (with 2,600 beds) in
1990 (Lunt and Hillier 1981, Hospice Information Service 1990). The number of support teams, offering palliative care at home or through advice in hospitals, in the U.K. has grown exponentially in the last 21 years, from the first team in 1969 (Parkes 1980) to 317 teams in 1990 (Hospice Information Service 1990). In 1988 palliative medicine became a medical speciality (Hillier 1988).
A similar growth has occurred in the United States of America (USA) which has over 1,500 hospice programmes and in Canada which has over 200 (Mor and Masterson-Allen 1987, National Hospice Organisation 1985). In Australia there has been a rapidly
expanding growth in interest and services over the last six years (Cavenagh and Gunz 1988). In November 1988, the Hospice
Information Service (1988) knew of 30 hospice programmes in Australia. Lichter (1990) describes 23 in New Zealand. In other European countries services are expanding more slowly: Germany is % known to have five in-patient hospices and three support teams,
3.1.2 Why was palliative care developed?
There were several reasons for this growth. A variety of studies showed that dying patients suffered severe, unrelieved symptoms, particularly pain, had unmet practical, social and emotional needs, and suffered as a result of poor communication, both
between health professionals and from them (Wilkes 1965 and 1984, Cartwright
et al
1973). Their families also had suffered poor communication from health professionals, and needed emotional, practical and bereavement support (Parkes 1978, Bowling and Cartwright 1982, Cartwrightet al
1973). Cancer patients were found to have high psychiatric morbidity, while their families often developed social and psychiatric problems (Maguire 1980). Attention shifted to home care when further work emphasised the increased severity of many problems while the patient was at home, where the main burden of care fell (Ward 1974). Also, care at home could be provided more cheaply and may be preferred by many patients (Working Group on Terminal Care 1980, Creek 1982). The voluntary sector was largely responsible for initiating many of these studies and outlining standards of good practice (Lunt and Hillier 1981, Saunders 1978). Taylor (1983) argues that the voluntary nature of early hospices gave them the opportunity to develop their own models of care and to establish standards of excellence.3.1.3 The palliative model of care
Palliative care is concerned with the study and management of patients, and relief of their suffering, when cure is impossible. The focus of care is the quality of remaining life (Doyle 1987).
Many clinicians describe these patients as terminally ill. Hospices and support teams specialise in providing palliative care, although many patients on general wards in hospitals also require palliative care.
Although in Britain the term hospice usually refers to a unit with in-patient beds, in the USA the terminology differs. There, hospice refers to the philosophy of care, and hospices programmes include in-patient units and home care support teams. This
thesis will use the British definition, and will attempt to clarify whether the American units provide in-patient or home care.
Hospices
Hospices offer symptomatic, spiritual, social and emotional support and treatment to people suffering from a terminal
Hospices are often independent buildings, sometimes on a hospital site but more usually in a separate unit, such as a converted house or home. Occasionally, a ward or dedicated beds within an NHS hospital block are deemed a 'hospice' (Hospice Information Service 1990). Most hospices (112 out of 145, 77%) are funded wholly or mainly by voluntary contributions, including
contributions from cancer charities, e.g. the Cancer Relief Macmillan Fund, Marie Curie Cancer Care, (calculated from listings in Hospice Information Service 1990). In 1989, the Department of Health gave eight million pounds to voluntary hospices and support teams in England and Wales: this money was distributed by Regional Health Authorities (Department of Health
1989a). In 1991 the figure rose to seventeen million pounds (Department of Health 1991). The Scottish Home and Health Office already provided funding to voluntary hospices.
Support Teams
Support teams are based either in hospices (32%), hospitals (13%) or in community units (55%) and usually work within the National Health Service (calculated from listings in Hospice Information Service 1990). They visit and advise on any patients admitted to hospital, although the teams rarely have admission beds for their own use. They accept referrals from hospital specialists and general practitioners but will visit patients at home only if the general practitioners agree. In the community, the general
practitioner and community nurses are expected to remain involved in the patient's care and offer 24 hour on-call care; however, teams provide extra support for these community services, both
with advice and shared care, some teams also providing a 24 hour on-call service (Parkes 1980, Ward 1985, Lunt and Yardley 1986).
3.2 Measures of health care and palliative care
3.2.1 Structure, process and outcome: the underlying model for the
measurement of health care
The model of structure, process and outcome has been used over the last 40 years to measure health care. It is adapted from manufacturing industry: raw materials (structure or input) are handled in a certain manner (process) to produce a finished article (outcome) (Shaw 1980).
Sheps outlined the earliest model (Donabedian 1980). He
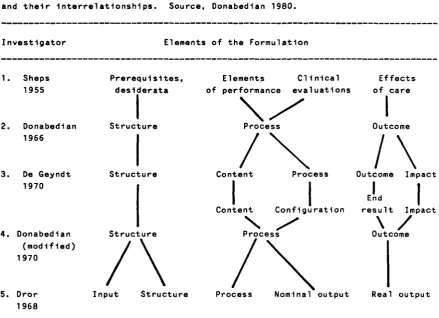
Table 3.1 Alternative formulations of approaches to quality assessment and their interrelationships. Source, Donabedian 1980.
Investigator Elements of the Formulation
1. Sheps Prerequisites, Elements Clinical Effects 1955 desiderata of performance evaluations of care
1 \ / 1
2. Donabedian Structure Process Outcome
1966
1
1
I
Eind1
Conte Configuration . result Impact
\/
4. Donabedian Structure Process Outcome
\ / \ I
(modified)1970
5. Dror Input Structure Process Nominal output Real output 1968
1
/\ / \
3. De Geyndt Structure Content Process Outcome Impact 1970
3.2.2 Structure, process and outcome: in health care
In health care, structure represents the relatively stable characteristics of the providers of care, of the tools and resources they have at their disposal, and the physical and organisational settings in which they work (Donabedian 1980). Structure includes the human, physical, and financial resources needed to provide health care.
Process represents the activities that go on with and between the practitioners and patients. In simpler terms, Shaw (1980)
described it as the use of resources. It includes measures of
throughput and whether patients were assessed and treated
according to agreed quality guidelines (Donabedian 1980), such as treatment protocols. Guidelines are based on the values or
ethics of the health profession or society (Donabedian 1980).
Outcome represents the change in a patient's current and future health status that can be attributed to antecedent health care.
If a broad definition of health is used, such as the World Health Organisation (WHO) (1947) definition of total physical, mental and social well-being, then improvements in social and
psychological functioning are included. Donabedian (1980) included patient attitudes (including satisfaction), heath-related knowledge and health heath-related behaviour within the definition of outcome.
Similarly, changes in the process of care, including variations in its quality, will influence the effect of care on health
status and outcomes. Thus, there is a functional relationship
as follows:
structure
-->
process-->
outcome.3.2.3 Measures of structure, process and outcome: their use and
meaning
Structure is easiest to measure because its elements are the most stable and identifiable. However, it is an indirect measure of the quality of care and its value depends on the nature of its influence on care (Donabedian 1980). Structure is relevant to quality in that it increases or decreases the probability of a good performance. Although structure is important in designing health services, to measure the quality of care it can only
indicate general tendencies.
Process is one step closer to changes in the health status of individuals. The advantage of process is that it measures the most immediately discernible attributes of care activities. However, it is only valuable as a measure once the elements of process are known to have a clear relationship with the desired changes in health status (Donabedian 1980).
Outcome reflects the true change in health status, and thus is
the most relevant for patients and society. However, Donabedian
(1980) argued that changes in health status are useful as a
measure of quality of care only if other causes for change have been eliminated. For example, prior care or other factors may be equally important. A useful approach is to focus on the
difference between the desired outcome and the actual outcome (Shaw 1980). Services can then identify whether or not their goals are being achieved and investigate any failings.
3.2.4 Choosing measures relevant to the goals of care
It is important to ensure that measures are relevant to the goals of care, as this influences validity (De Geyndt 1970). For
example, it is not appropriate to use mortality rates to assess care which aims to reduce pain, discomfort and anxiety
(Donabedian and Arbor 1982). Also, when monitoring the effects of an intervention, instruments should be able to measure those aspects of health and disability that are susceptible to change
within the time span of the study (Bowling 1988). MacKenzie et
al (1986) demonstrated that, although the Sickness Impact Profile
described the functional status of different groups, it was unable to detect improvements in patients.
Relevant outcome measures are much more difficult to develop than process measures, especially if these are to include the total definition of health. Over the last 40 years it has becomes
palliative care is a move even further in this direction - to improve quality of life while a person is dying, and to improve the quality of death.
The following sections will review measures of health status and quality of life and their value in palliative care.
3.2.5 Health status and clinical measures
Florence Nightingale was one of the first to use outcome measures other than mortality: she used three categories, 'relieved,
unrelieved or dead' (Rosser 1985). Since then, a wide range of clinical and health status measures have been developed. These include quick scoring systems to aid clinical practice or
decision making (e.g. the Apgar score, Apgar
et al
1958, or theTrauma Score, Boyd
et al
1987); measures designed forepidemiological research (e.g. the Nottingham Health Profile,
Hunt
et al
1984); and measures for clinical research (e.g.measures of quality of life for use in cancer trials, Ganz
et al
1990, Hollandsworth 1988).
3.2.6 Positive versus negative health
Measures of health status usually take health as a baseline and
then measure deviations away from this (Bowling 1991). In
effect they measure ill health. It is easier to measure variations from health than to measure health itself (Bowling 1991). Early measures concentrated on the absence of disease, and then later on symptoms, mobility, the ability to carry out everyday tasks. Later still, the concept of social health was
developed. Donald et al (1978) described this as follows:
'Measurement of social
health
focuses on the individual andis defined in terms of interpersonal interactions (e.g. visits with friends) social participation (e.g. membership in clubs). Both objective and subjective constructs (e.g. number of friends and a rating of how well one is getting along respectively) are included in this definition'.
Broad measures of
health
status include the Sickness ImpactProfile (Bergner
et al
1976) and the Nottingham Health Profile(Hunt
et al
1984). Although neither measures positivefunctioning both include components which measure the impact of illness on the person's life and well-being. Separate measures have been developed to measure psychological status, for example the Hospital Anxiety and Depression Scale (Zigmond and Snaith 1983) and the General Health Questionnaire (Goldberg and Hillier 1979). The measures of health status, quality of life and
psychological status have been reviewed in detail by Bowling (1991), Maguire and Selby (1989), Selby and Robertson (1987), Teeling Smith (1988), and Fowlie and Berkeley (1987).
3.2.7 Assessment of people with different levels of functioning:
health status versus quality of life
There is disagreement in the literature as to the correct use of the terms health status and quality of life measures. Some
which only considered the 'old narrow definitions of health' (i.e. death and disease). This can cause confusion, for in addition to health Ware (1987) proposed that quality of life measures should encompass 'standard of living, quality of housing, the neighbourhood in which one lives and job satisfaction'.
However, Spitzer (1987) suggested that health status and quality of life measures should be used for people with different levels of health. He described a spectrum of health states from perfect health to terminal illness. These are shown in Fig. 3.1.
Near
death
Perfectly
Definitely
Transitional /Ostensibly
-
7
ill
-7
zone-7
healthy
healthyFig. 3.1 Spectrum of health status states. Source: Spitzer (1987).
The choice of measure depends on the position of those studied along this spectrum. Others support this view. Bowling (1991) notes that when studying severely ill populations, the best strategy may be to employ measures of negative health status.
Spitzer (1987) proposed that health status measures should be 'reserved primarily for assessments of ostensibly healthy people, usually in the context of aggregates of unselected
geographically-defined populations or catchment area ..of a service programme'. Measurements of quality of life should be restricted to the assessment of a series of attributes among those definitely sick.
In the transitional zone both types of measures meet and may overlap, alternatively a third type of measures may be needed for this zone (Spitzer 1987).
In practice, Spitzer's (1987) theory has weaknesses. Health status measures are of limited use in healthy populations because they rely on a negative definition of health, as already
described. In the general population, health status measures provide little information on 80-90% of general populations
(Bowling 1991). To provide information on this large group, the 'perfectly healthy' end of Spitzer's spectrum would need to be expanded, to compare, for example, an athlete and an office worker.
Similarly, problems occur when populations of near death patients are considered. Spitzer (1987) argued that this could be
ill'. The later sections of this review will examine the use of scales in patients near death and consider whether the scales were sufficiently sensitive and where problems occurred.
3.2.8 Measures specifically for cancer patients
Aggressive chemotherapy or other treatments have been used
increasingly to treat cancers which are not curable or are rarely curable. Measurement of quality of life in these patients is highly relevant, although reviews of studies have found that
frequently quality of life was not recorded or was poorly documented (Clark and Fallowfield 1986).
Cancer is not one disease. There are many different types of cancer, with different presentations, symptoms and prognoses. Nevertheless, scales have been developed to measure health status and quality of life in patients who either have 'cancer' (any type) or who have certain types of cancer (e.g. lung cancer, see
Aaronson et al 1987).
In a review of 6 measures, Clark and Fallowfield (1986) described their validity, administration and scoring. Karnofsky's (1948) performance status measure is perhaps the oldest, and although this is limited to functional activity (rated 100 = normal, 10 = moribund) it is widely used by clinicians. However,
psychological and mental difficulties often accompany illness, and patients with depression and anxiety are likely to show a decline in their enjoyment of life. It is important that measures include the psychological aspects of illness, and the
Karnof sky index is limited because it does not. Measures of general mental health items, such as anxiety, nervousness, positive and negative affect, may not be appropriate for
diagnosing specific mental disorders such as depression. This requires separate measures such as interview schedules designed to standardise the diagnosis of selected mental disorders
(Donovan et al 1989).
Details of some commonly used measures are shown in table 3.2. Many reviews consider the available measures of quality of life and health status, and provide guidance on their appropriate use and analysis. Examples are given in the references, see Maguire
and Selby (1989), Donovan et al (1989), Aaronson (1991), and
Measure Description
Table 3.2 Selection of some common quality of life, health status and mental
health measures used in cancer clinical trials.
Karnofsky Performance
Status scale (KPS)
(Karnofsky 1948)
Eastern Co-operative
Oncology Group (ECOG)
(Zubrod et al 1960)
Cancer Inventory of
Problem Situations
(CIPS)
(Schag et al 1983)
Hospital Anxiety and
Depression scale (HAD)
(Zignond and Snalth 1983)
1 item, performance and mobility rated 10 - 100
1 item, performance and mobility (developed from
KPS), rated 0 - 4.
131 problem statements in 4 areas: personal care,
medical situation, interpersonal interactions,
miscellaneous. Each rated on 5 point scales
14 items in 2 subscales of anxiety and depression.
Each rated on 4 point scales.
Psychological Adjustment
Illness Scale (PAIS)
(Morrow et al 1978)
to 45 questions in 7 areas: health care orientation,
vocational environment, domestic environment,
sexual relationships, extended family
relationships, social environment, psychological
distress. Each rated on 4 point scales.
Spitzer's quality of life
index (QL)
(Spitzer et a7 1981)
Rotterdam symptom checklist
(De Haes et a7 1986)
Linear Analogue self
assessment (Ontario Cancer
Institute and Royal Marsden
Hospital)
(Selby et a7 1984)
European Organisation for
Research and Treatment of
Cancer (EORTC)
(Aaronson et al 1987).
McGill Pain Questionnaire
(Melzack 1975).
5 items; activity, daily living, health, support,
and outlook. Each rated on 3 point scales.
30 symptoms and 8 scales of daily activities in 4
areas: physical toxicity, social functioning,
physical activity, psychological adjustment. Each
rated on 5 point scales.
31 items, divided into two groups - general health
(18 items) and items specific for breast cancer
(13 items).
Self assessment. Core questionnaire for all cancers,
extra module for lung cancer. At development and
testing stage.
102 words describing the intensity and quality of
pain. Short version with 15 groups of descriptions.
3.2.9 Measures for palliative care
Most palliative care units collect data on aspects of their process of care, such as the number of patients seen, number of home visits, drugs used, duration of survival, and use this in annual reports which are geared towards fund raising (for example
see St Joseph's Hospice, 1976). Harper et al (1988) conducted a
Delphi exercise (Linstone and Turoff 1975), aggregating the views
of hospices in the UK, to suggest standards for in-patient and
day care units, but this was concerned with the structure and process of care, rather than with outcomes.
Palliative care outcomes have been slow to develop, as these cannot be measured with the usual indicators of mortality or morbidity. They require a measure which includes the specific objectives of quality of life whilst dying, and the quality of dying.
3.2.10 Palliative measures used to date
Studies of palliative care have used a wide range of measures developed by researchers conducting the study, for example, patients' ratings of pain categorised as severe, moderate, mild or absent, the place of care and death, or patient and family anxiety (e.g. Parkes 1979a and 1979b, Hinton 1979, Kane 1984). In some instances satisfaction with care has also been recorded (Kane 1985, Cartwright and Seale 1990). McCusker (1984)
developed and attempted to validated scales to measure
McCusker 1984), and tended to reflect the specific aims of the study, rather than the wider aims of palliative care. This was acceptable for research in single settings, but did not allow for multicentre, comprehensive evaluation.
The National Hospice Study, USA, used various measures. Patients were assessed by their carers or family member according to an adaptation of Spitzer's Quality of Life index (the HRCA-QL
index), the original and uniscale version of Spitzer's index, the Karnof sky index, the McGill pain questionnaire, an emotional scale, a social scale and an awareness scale, developed by the
authors (Greer
et al
1986, Morriset al
1986). Morriset al
(1986) concluded that the HRCA-QL index was most useful. This index has 5 items: mobility (replacing activity in Spitzer's original index), health, support, daily living and outlook, each rated 0,1 or 2. Spitzer (1981) had expected his QL index to be
'particularly useful in trials of the effectiveness of palliative care or hospice services'. However, Mount and Scott (1983)
criticised it for omitting many aspects of care: 'improved communication within the family and between family members and health care workers; lessened uncertainty and fear of the
unknown; greater acceptance of the reality facing them; greater ability to express fears, doubts, guilts and anger'. However, they added: 'Until more valid instruments are developed, we must use Spitzer's QL index and the other outcome measures of their study'.
3.2.11 Measuring
the
'quality of death'Scores according to the Karnof sky index and HRCA-QL index deteriorate markedly in all patients towards death (Morris and Sherwood 1987) making these insufficient to measure palliative care. Mount and Scott (1983) noted: " excellence in hospice evaluation must await the development of new outcome measures". The wording of the score definitions is such that if a patient is unconscious he/she will achieve a score of zero in all 5 items
(including support and outlook). The index is also only concerned with the patients' condition and not service provision, and only to a limited degree with the support from family or friends.
Existing psychological measures may have similar problems with dying patients. Most measures, for example the Hospital Anxiety and Depression Scale (Zigmond and Snaith 1983), or the Beck Depression Inventory (Beck 1979), include items which may not be suitable in palliative care. Questions about feeling slowed down, worrying about the future or irritability could normally achieve positive responses in a dying person.
Wallson et al (1988) developed a measure of 'quality of death' by
analysing patients' wishes about their death, collected in the National Hospice Study. This data was unsatisfactory because the total sample was biased and included only 11% of hospice
patients and an unknown proportion of those receiving
After the patient's death, the authors interviewed family members (FMs) to determine which of the 15 most common items had been
successfully addressed. Hospice and conventional care were compared. However, there was no attempt to match individual patient's wishes with achievement. For example, only 9% of
patients had said they wished 'to be at peace with God', yet over 90% of FMs said that this was achieved. One possible
interpretation of this is that some patients who did not wish to be at peace with God had it forced upon them. There is clearly a need to develop measures which can be sensitive to the wishes of individual patients. Most measures of health status and quality of life cannot do this. Measurement is made on an empirical scale which is set for all patients, with the assumption that all patients wish for the highest possible score (e.g. of mobility). However, when items reflect aspects which some people desire and others would not, for example 'peace with God', scales need to allow for the wishes of individual patients and their families.
3.2.12 Who should make the assessments?
Measurement of quality of life may rely on assessments made by patients, their family, external researchers, or by
health professionals. All of these approaches have drawbacks. a) Patients
Taking assessments directly from the person who is dying would seem to give the most valid information. However, this has been criticised mainly for two reasons. First, in some instances it is
considered an intrusion. No detailed evidence is available, but, in one study the relatives reported that they believed dying patients were willing to help in research, often in the hope that
this would help others (Mor
et al
1988c).
Fallowfieldet al
(1987)
found that most breast cancer patients reported thattaking part in a psychological study was a helpful extension to their treatment. Thus, intrusion may not be the problem feared by professionals.
Second, the reliability and completeness of assessments from
severely ill patients has been questioned. Ward
(1985)
and Lunt andNeale
(1985)
found that, of patients in hospice and home caresettings, only one half to one third of patients in care survived
and were well enough to be interviewed. Maguire
(1980)
warnedthat self-ratings scales may be subject to error: from a wish to give socially desirable answers, a favouring of extreme or
central positions on the scale (position bias), or because a far greater proportion of cancer patients than usually realised may
have impaired attention, concentration or memory. The National
Hospice Study (USA), the largest comparison of hospice and conventional care, included a small proportion of patients receiving care. (This is discussed in more detail in section 3.3.2). If the most ill patients cannot be assessed by interview this is a potential source of bias.
b) Relatives, friends or family members (FMs)
FMs' own process of grief (Parkes 1985). Only a few very recent
studies have considered this. Epstein
et
al (1989) tested forcorrelations between the ratings of 60 subjects and their closest relatives or proxies on scales measuring social activity,
emotional status, overall health, functional status and satisfaction. Pearson's r for all 60 pairs ranged 0.43
(satisfaction) to 0.73 (functional status), but if the subjects had below median health, or there was below median subject-proxy contact, or the subjects and proxies lived apart correlations were poor (for example, 0.12, 0.02, and 0.12 respectively for
satisfaction). A study comparing the assessments of FMs in the
bereavement period showed that these did not correlate with the
assessments of patients made during their life (Ahmedzai
et
al1988). Cartwright and Seale (1990) compared patient and bereaved FMs' (or close friends') assessments of symptoms and services. Mean squared congruence ranged 0.00 (bad temper) - 0.67
(constipation). Relatives tended to be more critical of services and to report more symptoms. The relatives' assessments may be affected in unknown ways by the place of care. Parkes (1985) suggested that relatives may over-report symptoms when patients are at home. It seems clear that, when FMs' assessments are used these must be considered as measuring the FMs' 'pain', 'anxiety' etc. as well as the patients'.
C) External assessors
External assessors can provide an independent view of the patients circumstances, free from many of the biases of
professionals or FMs. However, these may cause intrusion and may interfere with the practice of team members. If the interviewers ask searching questions concerning the patient's insight and future plans they could be replicating or altering the support team's work. The assessments cannot be made 'blind' to the service received, for the patient is likely to refer to their services during interview. When assessing psychological
circumstances in interview, an external assessor sees only a very limited sample of a person's behaviour (Miller and Morley 1986).
d) Professionals
Slevin
et al
(1988), Mercieret al
(1987) and Wilkes (1984) havefound that hospital and community staff gave different assessments of quality of life compared with dying patients
themselves. Results may be biased by the professionals' own
expectations and hopes of a positive outcome. Professionals may be disposed to recall the successful treatments rather than
failings (Miller and Morley 1986). However, professionals have
the advantage of being able to provide data on all of the patients in their care.
There is clearly no ideal choice. Each study must choose the most appropriate assessor(s) depending upon its aims. The
3.3 The evaluation of palliative care
A number of evaluations have been undertaken and the following review concentrates on those from the U.K., USA and Canada, where
most research is available. The evaluation of bereavement
services is not included.
3.3.1 British experience
Single site evaluations
Hospices
Early studies of hospice care focused on individual services and
reported their structure and process (e.g. Bates et al 1981 or
Evans and McCarthy 1984). Such information was often presented in annual reports geared to fundraising (e.g. St Joseph's Hospice 1976). The first formal evaluative studies appeared in the the 1970's. Three research groups - Parkes (1979a and 1979b), Hinton (1979) and Lunt and Neale (1985) - independently showed
in-patient hospice care to be more effective than hospital care.
Parkes (1979a and 1979b) showed that bereaved spouses
retrospectively reported better pain control, lower patient and family anxiety and distress, and increased satisfaction than matched hospital care controls. Hospice care also costs less. However, Parkes and Parkes (1984) in a follow-up study ten years later failed to show better pain control in the hospice: pain control in hospital appeared to have become as effective.
Using his own interviews with patients and spouses and the reports of a senior nurse, Hinton (1979) found 20 hospice
patients to be less depressed and anxious than 20 in an acute hospital ward or 20 in a Foundation Home.
Lunt and Neale (1985), in a comparative study of in-patient hospital and hospice care in Southampton, observed that hospice doctors set more goals for dying patients than did hospital
doctors. They believed goal setting was an integral part of good practice, and so, as process evaluation, indicated hospice care to be more effective. However, there were no differences between the two settings in the goals set by nurses, and no outcome
measures were used.
Support Teams, home care and out-patients
The results of evaluations of hospice services for out-patients or home care were less positive. Hinton's (1979) comparative study included 20 hospice out-patients who showed less anger than
patients in hospital or the Foundation Home but no less
depression or anxiety. Although Parkes (1980) initially showed
a domiciliary service increased the amount of time patients spent at home and cost less than hospital or hospice care, in 1985 he found that bereaved spouses reported that patients had more pain and anxiety when at home than in hospice or hospital (Parkes 1985).
multicentre evaluations
services. The studies of Parkes and Hinton were based on
patients at St. Christopher's Hospice, Sydenham, London. This is the pioneer centre for the hospice movement and 'a centre of excellence'. It demonstrates the potential of hospice care
rather than the general effect. Multicentre evaluations are much more likely to give a reliable picture of palliative care in the U.K.
The last year of life - a survey of the bereaved
Cartwright and Seale's (1990) study, the Last Year of Life in 1988, gives insight into the effect of hospices (and support teams). This national survey was based on a random sample of 639 adult (aged 15 years or more) deaths registered in England.
Interviewers tried to contact the person who could tell them most about the last 12 months of life of the deceased. Seven percent received some form of hospice care (25% of cancer deaths) either in-patient or support team or both (Seale 1991a). These patients were reported to have had better pain relief, greater awareness of their diagnosis and prognosis, and were more satisfied with the services they received (Seale 1991a and 1991b). However, the characteristics of patients receiving hospice care may have been different. There were social class differences, more middle class people had been in private hospitals and hospices than working class people (7% versus 1%, Cartwright 1992).
Support Teams
Other evaluations of support teams have measured only the structure or process of care. Ward (1985) compared nine
domiciliary services in the regions of Yorkshire and Trent in
1985. She showed major differences in their funding (voluntary,
NHS or a combination of both), attachment to in-patient unit or free standing, staffing levels and types and especially in their method of working and number of patients per nurse. She
explained that the lack of clearly defined criteria for a successful programme made evaluation difficult (Ward 1985 and 1987).
In a stratified random sample of 162 home care and hospital support nurses from 45 different services, Lunt and Yardley
(1986) found similar variations in the structure and funding of services. Teams served catchment populations which ranged from 43,000 to 500,000, with variations in the nurse caseload from 11 to 57 current patients per nurse. (One Marie Curie service had 21 nurses, but this worked in a completely different way, not as a support team.) Apart from variations in the number of nurses in a team (from 1-11 nurses), there were variations in the numbers of other members of the support teams: doctors, social workers and in some cases a chaplain, occupational therapist, physiotherapist, psychologist, dietitian, administrator or
secretary. Input from other disciplines (including doctors) was
3.3.2 US and Canadian experience
Difficulties in comparison with the U.K
The differences between US, Canadian and British health services may mean that the findings of these studies are not directly transferable (Editorial 1986). The North American provision of home hospice care was either through home health agencies or independent home care units. The latter, especially, are primarily a nursing initiative with variable access to doctors (Mor and Masterson-Allen 1987 and Mor 1988a). In Britain, medical services, even if there are no doctors in the home care team, can be provided by general practitioners.
In contrast to the British findings, the results of North
American studies of in-patient hospice care were contradictory, but benefits were demonstrated for home care.
Single site evaluations
Hospices
In New Haven, Buckingham and Foley (1978) found that 35 hospice in-patients and their spouses or main carers had less anxiety and depression and higher social adjustment at interview than 35 matched controls.
Kane et al's randomised controlled trial
One difficulty of all the studies discussed so far is the problem of self selection by patients into either the hospice or control group. Any apparent effect of palliative care may be due to
existing differences between hospice and control groups. In
response, Kane et al (1984 and 1985), in Los Angeles, carried out the only randomised trial of in-patient hospice care. Patients admitted to the Veteran's Medical Centre were randomly allocated to either hospice or conventional care. One hundred and thirty-seven hospice and 110 conventional care cancer patients were compared. The results were equivocal. Apart from improved patient and family satisfaction there was no significant
advantage of hospice care over conventional care in the control of pain or symptoms, activities of daily living, affect, use of therapeutic procedures, number of in-patient days or cost. Equally, hospice care showed no disadvantages over conventional care.
However, during the study 'hospice' patients received both hospice care and conventional care. When the hospice unit was full 'hospice' patients were admitted to general medical wards. Only 60% of the 'hospice' patients died in the hospice, 3% died
at home and the rest died elsewhere in the hospital. During the
trial 'hospice' patients spent an average (mean) of 13.2 days on general medical wards, not much less than the average (mean) of 20.7 days of the control group. Further, the hospice and general wards were close to each other, so we cannot exclude the possibility that staff treating the 'control' patients changed their management after observing the therapy and practices used in the care of 'hospice' patients. This contamination would
Support teams
A positive benefit for home care was reported in a randomised
trial in 1984. Zimmer
et
al
(1984) in Rochester, New York,evaluated one model of home care using a randomised controlled trial. The home care team consisted of a physician, a nurse practitioner and a social worker, who provided 24 hour on-call medical care and nursing and home care services. Elderly patients with either terminal or severe chronic illness were referred and then allocated to either team care or to the usual home health agencies services. Team patients spent less time in hospital, had lower overall costs and more frequently died at home. Satisfaction with care was higher for team patients and their carers than for the control group. There were no
significant differences between team and control patients in health status, functional status or survival. Other positive results of home care were reported, although randomised designs were not used (Creek 1982, McCusker and Stoddard 1987).
Multicentre evaluations
Hospices
Hannan and O'Donnell (1984) measured the costs and satisfaction for 12 hospice programmes in New York State. All services cost less than conventional care. Community-based hospices cost less than other units providing hospice beds (either free standing or within existing hospitals). The satisfaction of carers and
family was 'high' in all hospices, but was higher for hospices with beds than community hospices.
The National Hospice Study. A study of in-patient hospice, home hospice and conventional care
The National Hospice Study, USA, was devised to demonstrate whether hospice care was effective, so as to consider whether it should receive Medicare funding. The three million dollar
project collected prospective data from 40 hospice and 14 conventional care centres; 833 hospice home care (HC), 624 hospice in-patient (HB) and 297 conventional care (CC) patients and their nearest carers were interviewed (Greer et al 1986). The hospice patients were less likely to receive therapies such
as chemotherapy, surgery, radiation therapy, transfusions and
intravenous therapy and significantly more likely to receive social services (Mor et al 1988a). Home care hospice patients spent more time at home (Mor et al 1988c).
There were few differences in quality of life outcomes measured between conventional care and hospice care. Some small but significant differences were found to the benefit of HB but not HC patients in pain, symptoms and satisfaction of family members. However, there were no consistently observable differences
between hospice and non-hospice patients in performance status, quality of life, or satisfaction with care as reported by
patients' families (Greer et al 1986, Morris et al 1988).
The results of cost savings were mixed. Home care hospices saved
life, and for both HB and HC patients the longer the stay in hospice, the more likely the costs incurred exceeded those of conventional care patients in the last year of life (Kidder 1988a and 1988b).
The National Hospice Study: sample bias and other difficulties
Sampling inconsistencies limit the conclusions of this study. In the sampling procedure there are three problems (see Mor 1988a and 1988b, Greer et al 1983 for details of the study design). First, the main sites of the conventional care group were not representative, since the criteria for inclusion in the
conventional care group and the hospice group differed.
Conventional care units were probably better than average due to their four extra selection criteria of good records, follow up, willing doctors and nurses and proximity to regional centres. Second, the criteria for selection of patients differed in conventional care and hospice care settings. In conventional care settings patients with a low mobility were actively selected
(Karnofsky score of 50 or less), there was a much higher refusal rate (20.6% compared to 3.3% and 3.5% in the hospice settings) and patients were selected in conjunction with the oncology nurse clinician. In addition, the physician was asked for permission to contact the patient. The authors do not state the number of cases in which the oncology nurse or physician objected to the contact. Third, we cannot say whether patients were selected fairly or not, since no details are given of the full conventional care denominator populations. In the hospice
group from an initial denominator of 13374 patients, only 1457 (11%) were interviewed. It is not clear what proportion of patients died before they could be interviewed, were too ill for
interview, or were selected out by the staff or by random selection.
3.4 Summary of main findings from literature
The literature shows the value of measuring health outcome, rather than structure or process. A wide variety of health status and quality of life measures are available, but these do not address the goals of palliative care for patients and families, and are not sensitive to changes in dying patients or to individual wishes. Although there have been many evaluations of palliative care,
these were limited by the lack of measures, by variations in palliative practice and by their research design. Future
4. METHODS: GENERAL
4.1 Role for audit
4.1.1 Summary of difficulties in the evaluation of palliative
care services to date
1. Lack of available measures
This was discussed in the previous chapter. Palliative
services need ways to monitor their care if they are to improve
patient care and find the best mode of working. In most
clinical practice a patient's blood pressure, pulse etc., are measured, but in palliative care this is rarely appropriate. The lack of valid sensitive measures for palliative care has hampered research to date. These types of measures are required before future evaluations can be carried out.
2. No Standard Practice
Services, particularly for home care, operate in many different ways. As described, major differences have been found between different hospices or support teams in their structure and process. This limits the conclusions which can be drawn, negative or positive results can be attributed to the characteristics of individual services, rather than to the
'palliative' effect. There is an urgent need to clarify the goals of palliative care, and then to measure whether these goals are widely achieved.
3. Palliative care embodies a number of different interventions. Palliative care is provided by various professionals and
volunteers, in multiple settings, amidst a complicated network of
patient and family variables, and have closely interrelated goals that seek integrated "holistic" palliative care (Buckingham and Lupu 1982). It subsumes a complexity of palliative
interventions, just as surgery has many factors which have never
been tested in one study as one intervention (Dush and Cassileth
1985).
Given the wide variety of services, we need to know for which patients palliative care is most effective and which models of care work best. Rather than posing the global question is
'palliative care effective?', an equally important question would seem to be what kinds of palliative care interventions, by whom, in what combination, form and amount, for what kinds of patients and families, and with which types of concerns, work best under a particular set of circumstances (Dush and Cassileth 1985)?
4. Difficulties in research design
The World Health Organisation defines evaluation as: 'the
systematic, scientific method of determining the extent which an action or set of actions was successful in the achievement of predetermined objectives'(Hogarth 1975). Much evaluation in health care has relied on randomised controlled trails to assess efficacy (the benefits to individuals of a procedure applied under controlled and usually ideal conditions). However, these have been used only occasionally to evaluate palliative care. Possible reasons for this include:
providing services. Voluntary groups are more likely to be influenced by local concerns and difficulties than by a wish to meet rigorous evaluation criteria.
b) the ethical issue of informed consent. Can patients be asked in their final months of life to agree to a random allocation between a service and no service? In the National Hospice Study random allocation was considered 'unethical' (Aiken
1986). In London, before this study, local general practitioners were asked if they would participate in a randomised trial of a support team. Most refused, they felt they could not confidently persuade patients to agree to a support team being involved in their care if the patients then might, or randomly might not, receive the service.
c) the evidence that conventional care was failing patients. Political pressure for palliative services led to the decision to make hospice care reimbursable under US Medicare Legislation, before the results of the National Hospice Study were available
(Mor
et al
1988c).d) contamination of controls. Mount and Scott (1983) have argued
that it is unlikely the control or customary care group will truly represent the traditionally neglected terminally ill,
simply by virtue of their study inclusion. Any identified
control group will have been subject to the "educational effect of hospice care", which was deemed responsible for the lack of difference between hospice and conventional care by Parkes (1985) and Kane
et al
(1984).4.1.2 Future needs for study
The evaluations to date show that hospice care is viable and in some studies, is an improvement on and cheaper than conventional care. It has been argued that in a pluralistic society such
choice is justified on its own merits (Greer et al 1986).
The research evidence suggests that evaluations in the future must look at ways of improving palliative care, at its
effectiveness (the benefits of care at a population level) and at testing the efficacy of specific interventions. Before any of these can proceed better measures are required.
4.1.3 Role for audit in the evaluation of palliative care
Definition of audit
The Department of Health (1989b) publication Medical Audit
defines medical audit as: 'the systematic, critical analysis of the quality of medical care, including the procedures used for diagnosis and treatment, the use of resources, and the resulting outcome and quality of life for the patient'. All doctors in the National Health Service are now required to undertake medical audit, as part of the National Health Service review (Department of Health 1989b), and audits of hospital and general practice are regularly published.
Table 4.1 Audit by any other name. Source: Shaw, 1980.
Medical Care Evaluation
Health Standards Assessment
Clinical Activity Assurance
Professional Quality Audit