Article
Evaluation Indicators Screening Based on Interval
Estimation Model--Taking Location of Production
and Service Facilities of Company A as an
Example
Jiangdong Bao1, Chaoju Hu1 , Biyu Liu2,*, Shuiping Shi1 and Ping Dong1
1 School of Economics and Management, Hanshan Normal Universtiy, Chaozhou 521041, China
[email protected] (J.B.); [email protected] (Z.H.); [email protected] (S.S.); [email protected]
(P.D.)
2 School of Economics and Management, Fuzhou University, Fuzhou 350116, China
* Correspondence:[email protected]; Tel.: +86-591-22866099
Abstract: With the focus of great concern of the sustainable development, its evaluation system has become an important operational strategy and practical values. For the purpose of obtaining the stronger indicators and the larger contribution ones, evaluation indicators screening is carried out using interval estimation model, which takes location of production and service facilities of company A as an example. And the weight value of each indicator is further explored, which can provide an direction of decision-making. The result shows that this screening method provides a more scientific evaluation method for enterprise location, decision-making basis for sustainable development of enterprises, and a solid foundation for the construction of the post-evaluation system. The present work implies that this screening method is affected, to different degrees, by the ability, knowledge reserve of the evaluators, which should be more systematic and standardized, and the concept of sustainable development should be strengthened.
Keywords: location; screening; interval estimation model;
___________________________________________________________________________________
1.Introduction
Evaluation means that through quantitative and non-quantitative measurement processes of
the evaluation targets, the evaluators can reach a reliable and logical conclusion (Bao, 2018).
However, when an evaluation system is set up for evaluation, there may exist redundant
indicators under the condition of satisfying consistency test, which will affect the accuracy
and scientificity of the evaluation results. There are also indicators that can’t meet the
consistency requirements, the reason is that the contribution of indicators has been
overwhelmed by the error of the system, the indicators won’t contribute substantially to the
evaluation. Hence, the indicators need to be screened.
At present, the commonly used qualitative screening methods are theoretical analysis
and expert consultation. According to Fan et al. (2002), Lin et al. (2012) and Li et al. (2017), the
subjectivity of this method is too strong, and the analysis results are not accurate. Lu & Jiang
(2007), Liu (2005), and Mu et al. (2015) think the common methods of quantitative analysis
include statistical analysis and Liu et al. (2004) and Lu & Zhang (2008) give the grey relational
analysis, but these two methods require a large amount of sample data and have some
limitations. Based on these points, this article applies the interval estimation analysis method
based on qualitative and quantitative Analytic Hierarchy Process (AHP) to eliminate
redundant indicators and indicators that contribute little, to screen the location of production
and service facilities for further research, and establishes a reliable indicator system
foundation for the later evaluation.
2.Description of Interval Estimation Model
AHP method is a combination of qualitative and quantitative decision analysis, it has been
applied to program optimization, comprehensive evaluation, feasibility judgment and so on
in many fields (Bao et al., 2016, Bao et al., 2017(94), and Bao et al., 2017(133)). The basic
method of AHP based on interval estimation is that only the indicators contributing to
decision objectives can be used as criteria for measuring alternatives (Gao et al., 2005, Zhong
& Fu, 2012, Liu et al., 2012, Mao et al., 2007 and Wang, 2013). Because of the difference of
knowledge, ability and information among the evaluators, there may be some errors in the
scoring results (Sam et al., 1996). This is, if the importance of an indicator is small enough, or
the contribution of that indicator has been obscured by systematic errors, it can’t contribute
substantially to system evaluation and should be eliminated (Bao, 2018, and Azadeh & Zadeh,
2016). And the model steps are built as follows:
Step1. To build the judgment matrix. To compare the relative importance between the
established standard layer and the target layer with 1~9 scale method proposed by Professor
Thomas (Thomas, 2005). And to build the judgment matrix at each level as An=( )aij n n .
Step2. To conduct the consistency test according to relative consistency indicator formula,
where CR CI RI
= , max
1
1 / ( ) /
n
i i
λ n AW ω
=
=
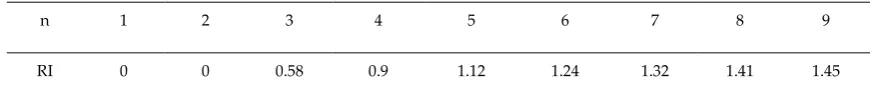
, λmaxis the maximum eigenvalue of judgmentTable 1 RI Set Value
n 1 2 3 4 5 6 7 8 9
RI 0 0 0.58 0.9 1.12 1.24 1.32 1.41 1.45
Step3. When 0CR0.1,the judgment matrix has satisfactory consistency. The weight
vector of the judgment matrix can be calculated as 1, 2
T n
W = ω ω ω with Yaahp software,
then the appropriate indicators selection weight ξ is selected to screen the indicators of this
layer. (Normally, ξis set as 0.05, if Wi>
means there are no weak indicators.)
Step4. When CR>0.1, the judgment matrix can’t meet the consistency requirement. The
upper limit value U i
ω and the lower limit value L i
ω should be calculated according to
interval estimation model, and the calculation should satisfy the following linear
programming model (Takayama, 1998).
1 2
1 2
max(min)
0
. . , 0
1 i n n ω AW
s t W ω ω ω
ω ω ω = + + =
Step5. If the weight ωi can satisfy max
U i
ω ,where max 1
max( iU iL)
i n ω ω
− , then the
contribution of this indicator has been masked by systematic error and should be eliminated.
3.Construction of Evaluation Indicators for Location of Production and Service Facilities
Location problems should be considered from a systematic point of view, because the whole
production activity is a whole, it is impossible for enterprises to exist in isolation. Based on it,
enterprises should consider not only suppliers but also customers, as well as product
distribution (Chen & Ma, 2016).
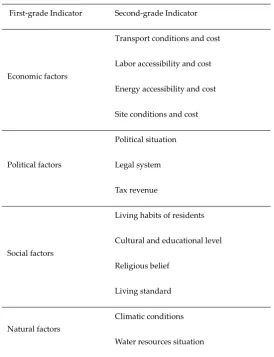
In general, the factors to be considered in location problems can be divided into four
categories: economic factors, political factors, social factors and natural factors (Chen & Ma,
2016). Table 2 is designed for providing a framework for the implementation of location
Table 2 Framework of Evaluation Indicators System for Location of Production and Service Facilities
First-gradeIndicator Second-gradeIndicator
Economic factors
Transport conditions and cost
Labor accessibility and cost
Energy accessibility and cost
Site conditions and cost
Political factors
Political situation
Legal system
Tax revenue
Social factors
Living habits of residents
Cultural and educational level
Religious belief
Living standard
Natural factors
Climatic conditions
Water resources situation
From a systematic point of view, location decision should minimize the cost of the whole
production distribution chain. From the analysis of the actual situation, there are many
constraints on the location of enterprises, such as the impact of the same type of enterprises in
pre-location, etc. With the rapid development of production and economy, China has been
paying more and more attention to the viewpoints of sustainable development such as
environmental governance, consumption and emission, which play an important role in the
location of production and service facilities. In some areas, even these sustainable
4.Evaluation Indicators Screening for Location of Production and Service Facilities--a Case
Study of Company A
Company A is located in the south of China and its climate is between 15 and 37 degrees
centigrade. It is a manufacturer and operator of chemicals, which is one of the largest
chemical enterprises in the world with a scale of nearly 1,000 people. Considering the low
cost of labor, raw materials and the saving of transportation costs, the company plans to build
a new production and processing plant in B city, so the location becomes the first issue.
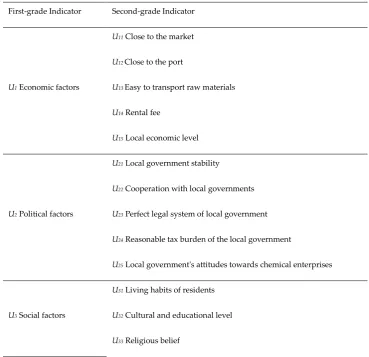
4.1Establishment of Preliminary Evaluation Indicator System for Location
Considering its location framework and all the specific conditions that the enterprise will
face, five senior evaluators, including one enterprise internal auditor, one enterprise external
auditor, one enterprise senior manager and two members of trade associations in B City,
adopted brainstorming method to evaluate the location factors. The results of the evaluation
indicator system are shown in Table 3.
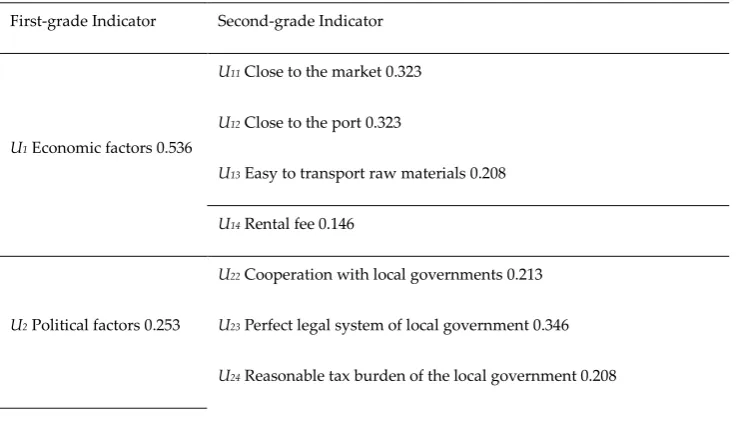
Table 3 Preliminary Evaluation Indicator System for Location of Production and Service Facilities
First-grade Indicator Second-grade Indicator
U1Economic factors
U11Close to the market
U12Close to the port
U13 Easy to transport raw materials
U14 Rental fee
U15Local economic level
U2 Political factors
U21Local government stability
U22Cooperation with local governments
U23 Perfect legal system of local government
U24 Reasonable tax burden of the local government
U25Local government's attitudes towards chemical enterprises
U3Social factors
U31 Living habits of residents
U32Cultural and educational level
U34Living standard
U35 Labor resources
U4 Natural factors
U41 Adequate infrastructure nearby
U42 Water resources situation
U43 Moderate climatic conditions
U44Convenient treatment of pollutants
U45 Emission Compliance
4.2 The indicator weight and consistency test of −
1 4
U U
W
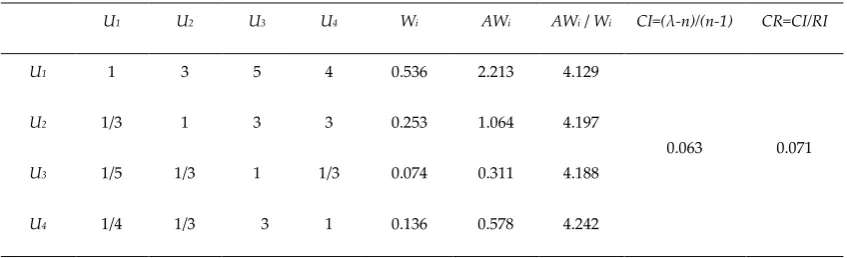
5 selected evaluators were invited to judge the importance of the indicators with AHP
method. According to step 2,ωi,Aωiand i
i
Aω
ω of first-grade indicators can be calculated as
shown follows.
Table 4 Calculation Results of First-grade Indicators
U1 U2 U3 U4 Wi AWi AWi / Wi CI=(λ-n)/(n-1) CR=CI/RI
U1 1 3 5 4 0.536 2.213 4.129
0.063 0.071
U2 1/3 1 3 3 0.253 1.064 4.197
U3 1/5 1/3 1 1/3 0.074 0.311 4.188
U4 1/4 1/3 3 1 0.136 0.578 4.242
From Table 4, it can be concluded thatWU U1− 4 =[0.536,0.253,0.074,0.136], CR=0.071 0.1 ,
the result has passed the consistency test. Let indicator selection weight ξ=0.05 ,
−
1 4 0.05
U U
4.3 The indicator weight and consistency test of −
11 15
U U
W
In the same way, as shown in Table 5, WU11−U15 =[0.323,0.323,0.208,0.104,0.043] ,
=0.091 0.1
CR , the result has passed the consistency test, but
15 0.05
U
ω , the result
indicates it is a weak indicator which should be eliminated.
Table 5 Calculation Results of WU11-U15
U11 U12 U13 U14 U15 Wi AWi AWi/Wi CI=(λ-n)/(n-1) CR=CI/RI
U11 1 3 2 4 8 0.323 2.464 7.637
0.111 0.091
U12 1/3 1 3 3 8 0.323 1.708 5.292
U13 1/2 1/3 1 2 8 0.208 1.027 4.937
U14 1/4 1/3 1/2 1 2 0.104 0.482 4.632
U15 1/8 1/8 1/8 1/2 1 0.043 0.201 4.713
4.4 The indicator weight and consistency test of WU21−U25, WU21−U25, and WU21−U25
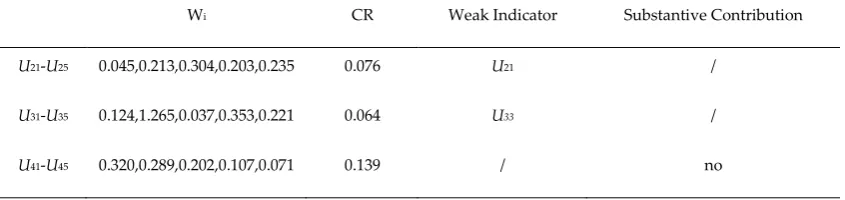
Using the same method, the weights, CR, weak indicators, and substantive contributions of
U21-25, U31-35 and U41-45can be calculated as shown in Table 6.
Table 6 Calculation Results of WU21-U45 and CR
Wi CR Weak Indicator Substantive Contribution
U21-U25 0.045,0.213,0.304,0.203,0.235 0.076 U21 /
U31-U35 0.124,1.265,0.037,0.353,0.221 0.064 U33 /
U41-U45 0.320,0.289,0.202,0.107,0.071 0.139 / no
4.5 The calculation of interval estimation model
Concluded from Table 6, WU21=0.045 0.05 and WU33=0.0370.05indicate that they are weak indicators, and should be eliminated.CRU41-U45=0.139>0.1 indicates that the result hasn’t
upper and lower limit values of each indicator with LINGO 11.0 software. The results are
shown in Table 7.
Table 7 Upper and Lower Limit Values and Weight Values
U41 U42 U43 U44 U45
Upper Limit Value 0.180 0.129 0.049 0.116 0.139
Lower Limit Value 0.066 0.109 0.039 0.109 0.118
∆i 0.114 0.020 0.010 0.005 0.021
wi 0.320 0.289 0.202 0.107 0.071
It can be concluded from Table 7 that only 43U Δmax, that is, 0.049<0.114
ω , the contribution
of the U43 has been covered by systematic error, and it will not make substantive contribution
to the system evaluation, and should be eliminated.
4.6 Evaluation indicator system after screening and the result
The eliminated indicators from Table 4 to Table 7 include U15(Local economic level), U21(Local
government stability), U33(Religious belief), and U43(Moderate climatic conditions), and the
remaining ones still need screening using the same method. The consistency test of U11-U45
has well satisfied the format CR<0.1, all the weight values of the indicators are greater than
0.05, and the results imply that the final indicator system is effective, which is shown in Table
8.
Table 8 Evaluation indicator system with weight value after screening for Location of Production and
Service Facilities
First-grade Indicator Second-grade Indicator
U1Economic factors 0.536
U11 Close to the market 0.323
U12Close to the port 0.323
U13Easy to transport raw materials 0.208
U14Rental fee 0.146
U2 Political factors 0.253
U22Cooperation with local governments 0.213
U23 Perfect legal system of local government 0.346
In addition, in order to verify the accuracy of the results, two members of trade associations
in B City were asked why U15, U21, U33, and U43 were screened. The reason is that the
correlation degree between the screened indicators and the location is not high. In other
words, they are not the key indicators for the location. From this perspective, this indicator
screening method is scientific and feasible.
5.Suggestion and Conclusion
This study provides a more scientific method for enterprise location by eliminating weak
indicators and indicators with little contribution, and the establishment of indicator weight
also provides a decision direction for enterprise internal management. Importantly, this
screening method improves the accuracy of the evaluation system, lays a good foundation for
the later evaluation system, and is a methodological trend.
But inevitably this method is still a subjective evaluation, the results will be affected by
the ability, knowledge reserve of the evaluators. Different evaluators may have different
results for the same indicator evaluation. At the same time, from the evaluation results
analysis, the weight value of economic factors is 3.94 times than that of natural factors. And,
the weights of U44 (Convenient discharge of pollutants) and U45(Emission compliance) are
also the lowest under the first-level indicator of natural factors. From the perspective of
sustainable development, this behavior of enterprises will affect the balanced development of
economy, society and environment.
Faced with this dilemma, how to reduce the effect of the subjective factors of the
evaluators and how to improve the attention of enterprise policymakers to sustainable
development are both challenges.
For future work, this screening method should be more systematic and standardized,
U25 Local government's attitudes towards chemical enterprises 0.233
U3Social factors 0.074
U31 Living habits of residents 0.251
U32 Cultural and educational level 0.215
U34Living standard 0.208
U35 Labor resources 0.326
U4 Natural factors 0.136
U41Adequate infrastructure nearby 0.323
U42Water resources situation 0.301
U44Convenient treatment of pollutants 0.208
and at any time, for any enterprise, the concept of sustainable development is indispensable.
Acknowledgments: All authors thank the statistical personnel of the case study area for their cooperation in the study and leaders of the enterprise for the guidance. Hanshan Normal Universtiy funded the work reported in this paper. Special thanks to Biyu Liu for his proof reading.
Author Contributions: All authors contributed to design, method, and analysis reported in the paper. Zhaoju Hu conducted the fieldwork and collected and processed the data reported in the paper. BiyuLiu and Jiangdong Bao conducted the analysis and led the writing of the manuscript. Shuiping Shi and Ping Dong developed and prepared all tables and figures. All authors commented on the manuscript, providing insights used in the analysis and discussion.
Conflicts of Interest: The authors declare no conflict of interest.
Rererences
1. Azadeh, A.; Zadeh, S.A. An integrated fuzzy analytic hierarchy process and fuzzy multiple-criteria decision-making simulation approach for maintenance policy selection. Simulation. 2016, 1, 3–18.
2. Bao. J.D. Application of Statistical Methods on Occupational Health and Safety Management in the Mining Industry in Ezhou City, China. Luleå University of Technology Press. 2018.
3. Bao. J.D., Johansson.J., and Zhang. J.D. Comprehensive Evaluation on Employee Satisfaction of Mine Occupational Health and Safety Management System based on Improved AHP and 2-tuple Linguistic Information. Sustainability. 2017, 9(1), 133.
4. Bao. J.D., Johansson.J., and Zhang. J.D. Occupational Disease Assessment of Mine Industry Occupational Health and Safety Management System based on FMEA and Improved AHP Model.
Sustainability. 2017, 9(1), 94.
5. Bao. J.D., Zhang. J.D., Li. F., Liu. C.Y., Shi. S.P. Social benefits of the mine occupational health and safety management systems of mines in China and Sweden based on a fuzzy analytic hierarchy process: A comparative study. Journal of Intelligent & Fuzzy Systems. 2016,31(6), 3113-3120.
6. Chen. R.Q., Ma. S.H. Production and Operation Management (Fourth Edition). Higher Education Press. 2016
7. Fan. B.N., Shan.S.T., Lu.C.S. Research on screening methods of evaluation index of urban technological innovation capability. Scientific Research. 2002, 20(6), 663-668.
8. Gao.J., Sun.L.Y., Li.M.Y. Interval estimation: a method of AHP indicator screening. System Engineering Theory and Practice. 2005,25(10),73-77.
9. Li. X., Tian.X.H., Du.W.H. Screening of drought resistance indexes of forage type triticale seedlings.
Pratacultural Science. 2017,34(03),539-546.
10. Lin.L.M., Zhang.J.C. Liu.J.X., Long.P.Y., Tang.X. Shale gas exploration, target layer, optimization.
Earth Science Frontiers. 2012,19(03), 259-263.
11. Liu.R.H., Yu.B., Jin.Z. Index selection of subway construction safety risk evaluation based on interval estimation. Forecast. 2012,31(02),62-66.
12. Liu.S.F., Dang.Y.G., Fang.Z.G. Grey system theory and its application. Science Press. 2004.
14. Lu.N., Jiang.L.N. Study on index selection of real estate market prosperity in Xi'an. Journal of Chang'an University. 2007,9(3),57-60.
15. Liu.X. Research on evaluation indicator system of enterprise comprehensive ability based on circular economy. Nanjing University of Technology. 2005.
16. Mao.H.B., Zhang.F.M., Zou.W.G. A method of combination weighting for multiple attribute decision making based on interval estimation. System Engineering Theory and Practice. 2007,(06),86-92.
17. Mu.Y.Z., Lu.Z.X., Qiao.Y., Wang.Y., Huang.H., Zhou.Q.Y., Han.J.H. Comprehensive evaluation index system of power grid safety and benefit based on multi operator analytic hierarchy process fuzzy evaluation. Power Grid Technology. 2015,39(01),23-28.
18. Sam Skog.P.O., Bjorkman.J. Herbst.J. The implementation of process control of LKAB company in Kiruna - ore pellet plant. Foreign Metal Mines. 1996,3,37-43.
19. Takayama. I. Problem in AHP and ANP. Communications of the Operations. Research Society of
Japan.1998,43,100-104.
20. Thomas, L.S. Making and validating complex decisions with the AHP/ANP. J. Syst. Sci. Syst. Eng.
2005, 14,1–36.
21. Wang.J., Tang.P.C., He.J.P. Selection of factors influencing fuel tax pricing in China based on AHP and interval estimation. Journal of Wuhan University of Technology (Traffic Science and Engineering). 2013,37(02),326-329.