Is Dynamic Mechanical Analysis (DMA) a non-resonance technique?
8
0
0
Full text
(2) EPJ Web of Conferences characterise viscoelastic properties and glass transitions of materials. Their major advantage is to cover several decades of time independently of temperature control. In addition, this method allows the viscoelastic behaviour to be distinguished from other effects such as ageing or manufacturing stress recovery. DMA is becoming more and more commonly used in the laboratory as a commercial apparatus for the material characterization on a turn-key basis rather than a research curiosity. This technique is often treated with a lack of knowledge, certainly because the only thing which interests the most of chemists is to supply information about transitions. So the dynamic mechanical method is certainly one of the simpler forced non-resonance techniques to understand, but nevertheless to perform accurate measurements and to ensure the relevance of the collected experimental data, a lot of precautions have to be taken. Indeed, large discrepancies among data obtained in DMA by different apparatus or various analysis methods, or even different laboratories using identical instruments have been sometimes underlined by diverse authors [4-5]. These discrepancies are principally due to different well-identified factors: - Thermal lag. Some errors can result from a default of temperature calibration, or of position of the temperature sensor in the furnace. Other errors are directly due to the heating rate. Lacik et al. [6] showed that an overestimation of the storage modulus and a shift in the glass transition temperature is observed if the isothermal plateau is not long enough to allow the temperature equilibration of the sample. The importance of achieving thermal equilibrium on the sample before starting the measurement is emphasised. The most accurate measurements are made isothermally, using combination of ramping and isothermal steps. - Mechanical factors. A number of mechanical factors, like specimen geometry and size, clamping effects may influence the results of dynamic mechanical analysis. Actually, all modes of geometry (flexion, traction, shear, compression…) proposed by commercial apparatus exhibit bias due to imperfect clamping and sample geometry. To make up for this lack of precision, some DMA technology applies correction factors to determine the viscoelastic properties of samples. These corrective factors are fitted for isotropic material, because this type of device is intended for classical polymers. Moreover, clamping can introduce stresses in sample, or compress the specimen and by this way reduce the section of the sample. - Determination method of the glass transition temperature (Tg). There are many ways to identify the value of Tg based on the dynamic mechanical measurements, such as the peak value of the loss tangent, the peak value of the loss modulus, and the onset of the drop of the storage modulus. However, one has to be aware of the fact that the obtained Tg value depends on the method [5]. When the Tg values determined using different definitions are compared, large differences are often underlined. This is due to the relatively broad temperature range of the transition region. If these troubles are relatively well-known by DMA users, some others are most of the time neglected. Irrelevant measurements can be performed because of instrument compliance effects and frequency resonance. In fact, the DMA currently used are most of the time designed to test soft materials. Nonetheless, in laboratories of applied mechanics or material lab, DMA is often employed to investigate a large panel of materials which might exhibit much higher stiffness. As previously underlined by Van’t Hoff et al. [7], the dynamic stiffness of the subcomponents of the measuring column significantly disturb the determination of the viscoelastic properties of the tested sample. It is obvious that the force sensor placed between the crosshead and the sample, the fixtures and the sample itself cannot always be considered as infinitely stiff or massless. Hutcheson and McKenna [8] reported errors until one order in magnitude in the determination of the viscoelastic properties of materials due to the effects of instrument compliance. Compliance arises from the transducer, the load frame and the fixtures. The ASTM Standards D4065 [9] specifies that the technique has to be used over a range of temperatures from -160°C to polymer degradation, for materials that have an elastic modulus in the range from 0.5 MPa to 100 GPa and is valid for frequencies from 0.01 to 1000 Hz.. 41004-p.2.
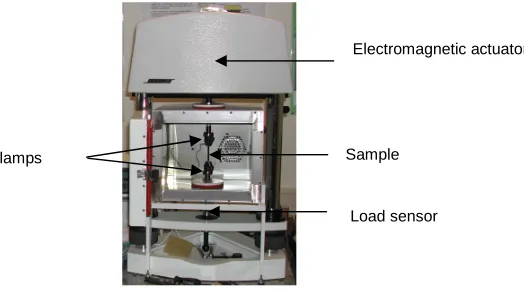
(3) 14th International Conference on Experimental Mechanics Nowadays, numerous commercial apparatus cover wide ranges of frequencies. The typical frequency range of harmonic tests is 0.01 to 200 Hz, sometimes 10-4 to 1000 Hz. Below 0.01 Hz, the tests take too long for most the case. Because the experiments occur below the fundamental mode of vibration, the upper bound of the frequency range depends upon the sample stiffness and geometry. So, in certain cases, performing frequency sweep, the frequency of the solicitation will be equivalent to the first resonant mode of the measuring column. In consequences, the vicoelastic properties measured for the tested material in this frequency range will be mistaken or aberrant (as tanδ negative for example). So, the main objective of this paper is to warn DMA users of the error that can be committed if the commercial apparatus are exploited on the entire frequency range without taking precautions. This work proposes an experimental study of the dynamic behaviour of our DMA (Bose Electroforce 3200). An accurate model of the measuring test bench is developed to simulate and predict the dynamic behaviour of apparatus according to the sample type and geometry.. 2 Material and method The dynamic mechanical behaviour of the test bench of the DMA was investigated using a Laser Doppler Vibrometer. 2.1 Dynamic Mechanical Analyser The dynamic mechanical analyser (DMA) used in this study is a Bose Electroforce 3200 apparatus controlled by a personal computer. A software (Wintest) pilots this apparatus and performs the viscoelastic properties calculation from force and displacement signals, and the sample size. This instrument features a 450N maximum force. It employs a moving magnet linear motor to apply the sinusoidal solicitations to the sample from 10-4 Hz to 200 Hz. The applied force is measured with a load sensor, the displacement with a LVDT (resolution of 1 µm). A climatic chamber allows the temperature of the sample to be controlled in the range -150/ 315°C with a temperature stability of about +/- 0,3°C. The temperature is measured by a thermocouple placed a few millimetres from the sample. The samples are tested in tension and subjected to a controlled strain of about 0.1%. A static strain is applied to the sample in order to maintain the sample under a net tension to prevent compression that would otherwise occur. This static strain is about 0.1 to 0.3% according to the polymer type.. Electromagnetic actuator. Sample. Clamps. Load sensor. Fig. 1: DMA Bose Electroforce 3200. 41004-p.3.
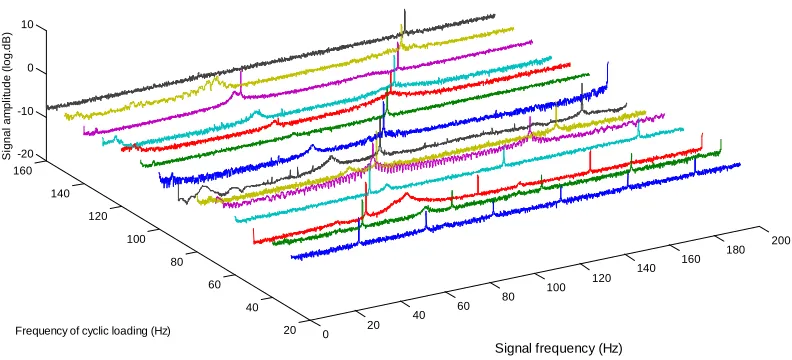
(4) EPJ Web of Conferences 2.2 Laser Doppler Vibrometer An Ometron VH300+ Laser Doppler Vibrometer (LDV) together with a Siglab analyser were used to characterise the dynamical behaviour of the measuring column of the DMA (Fig.2). This vibrometer is based on a Michelson interferometer and has a frequency range from 0.1 Hz to 25 kHz, a velocity range up to 425 mm/s and a dynamic range 73.5 dB over full bandwith. This non-contact vibration transducer has the major advantage to allow measurements from 0.4m up to 25 m without surface treatment or retro-reflective tape. The LDV was used to measure the vertical velocity of the DMA actuator. Laser Vibrometer. DMA controler. DMA test bench Siglab analyser. Fig. 2: Experimental set up. 3 Experimental results Four types of polymers with different viscoelastic properties were used for this experiment: elastomer, nylon, polyolefin (PP) and epoxy. Each sample was tested at room temperature at different frequencies between 1 Hz and 200Hz in the linear viscoelastic field with a displacement feedback. The time history and the autopower spectrum of the actuator dynamic response were measured during the sample testing using the laser vibrometer.. Signal amplitude (log.dB). 10. 0. -10. -20 160 140 120 100 80 60 40 Frequency of cyclic loading (Hz). 20. 0. 20. 40. 60. 80. 100. 120. 140. 160. 180. 200. Signal frequency (Hz). Fig. 3: Autopower spectra of the actuator dynamic response for several different frequencies of cyclic loading. Nylon 6. 41004-p.4.
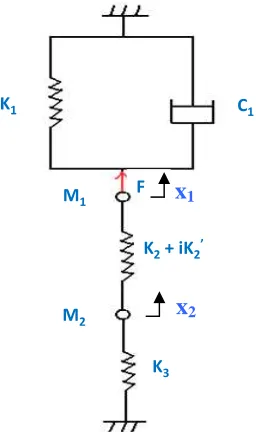
(5) 14th International Conference on Experimental Mechanics Figure 3 shows a waterfall plot of the autopower spectra of the actuator dynamic response obtained for 14 different frequencies of cyclic loading. On each spectrum, the highest peak corresponds to the cyclic loading frequency and harmonics are clearly visible, which denote that the response is not perfectly sinusoidal. But the most remarkable effect is the smooth peak located near 70 Hz, which is visible for nearly each cyclic loading frequency and reveals a resonance effect due to the dynamic behaviour of the whole setup. It was noticed that this resonance frequency slightly moves according to the sample type and geometry and completely disturbs the measurements of the viscoelastic properties (leading for example to negative values of tanδ). Different solutions can be considered to face this kind of problem. The first one is to redesign the measuring column of the apparatus in order to shift the frequency resonance to higher frequencies. But very large modifications would be needed here to shift the resonance frequency outside the frequency range of the DMA, i.e. above 200Hz. So, in this study, it was decided to develop an analytical model able to correct or reject measurements done close to the resonance frequency in accordance to the sample characteristics, or simply to avoid to apply some excitations to the sample in this area.. 4 Modelling 4.1 Analogical model Going from the physical system to a relatively simple mechanical model requires some approximations. All elements (actuator, sample, force sensor…) are represented by masses, springs and dashpots (Figure 4). Concerning the electromagnetic actuator, the magnetic portion of the moving magnet motor is made of three basic elements: the magnet, the coils and the core. The function of the coil and core assembly (stator) is to carry and modulate the flux across the gap where the magnet resides. The suspension allows the magnet to move along the desired axial path with minimal use of the motor force. A linear oscillator characterises the moving magnet linear motor. This one degree-of-freedom mechanical system includes a rigid mass (m1), representing the mass of the mobile part of the actuator, the upper clamp and the sample; a spring of stiffness k1 and a dashpot with a viscous damping parameter c1. A spring of complex stiffness k2* represents the viscoelastic sample. The mechanical data (k2 and k2’) are bound to the rheological properties of the sample (the storage stiffness and the loss stiffness). m2 represents the mass of the lower clamp and the load sensor, and finally k3 represents the stiffness of the load sensor. The system is governed by the following system of equations in matricial form: ' − k − ik 2' X F 0 m c 0 k1 + k 2 + ik 2 2 (1) 1 − ω 2 1 + j ω + 1 = ' 0 0 0 m − k − ik k + ik 2' + k X 2 0 2 2 2 2 3 4.2 Identification of the parameters To predict the response of the measuring column, the parameters of the analytical model were identified using different experiments. The mass and stiffness were simply measured. The parameters of the actuator (k1 and c1), were identified using a modal impact hammer and the resonance frequency (first mode) of the isolated actuator. Impacts were performed on 6 different points on the suspension and the responses were recorded using the vibrometer and the siglab analyser. The same experiment was performed using an additional mass hanging on the moving magnet.. 41004-p.5.
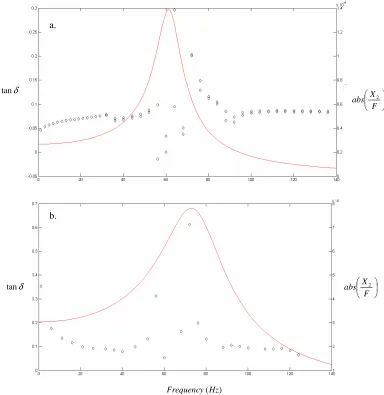
(6) EPJ Web of Conferences. K1. C1. M1. F. x1. K2 + iK2’. x2. M2 K3. Fig. 4: Model of the exciting column. k1 was identified using the following formula. (2). m ω '1 + ∆m ω '1 = k1 2. 2. The viscous damping parameter was identified using the resonance frequency peak (first mode). Table 1: Identified parameters of the analytical model -1. C1(N.s.m ). M1(kg). M2(kg). K3(N. m ). 4. 27.8. 0.44 + msample. 0.15. 2.7 10. K1 (N.m ) 1.87 10. -1. -1. 6. 4.3 Simulation and prediction The developed model can be used in two ways: - to correct the measurements performed close to the frequency resonance. Effectively, it is classically considered that measurements are valid up to one tenth of the resonance frequency. Knowing the geometry of the tested sample, the model allows the phase change due to the inertia of all moving parts, the damping effects (suspension of the actuator) and the frame stiffness to be dissociated from the sample properties. - to predict the value of the resonance frequency of the measuring column in accordance to the sample characteristics. The Table 1 shows the measured and predicted resonance frequency for two different materials. For the same materials, the Figure 5 shows the modulus of the frequency response function X2 / F (solid line) and the loss factor coming from the experimental test (diamonds). It appears clearly that the estimations of the loss factor are dramatically disturbed in the resonance frequency range. In the model, the sample properties measured before the resonance are used as input parameters.. 41004-p.6.
(7) 14th International Conference on Experimental Mechanics Table 2: Measured and predicted resonance frequency for two different materials. Resonance frequency (Hz). Elastomer. Nylon 6. Measured. 62. 66. Predicted. 62. 74. The slight discrepancy between model and experiment is certainly due to: (i) the resonance itself, which perturbs the experimental signals especially near the peak of the curve, (ii) the assumption of constant viscoelastic properties, which should rigorously depend on the frequency.. a.. tan δ. X abs 2 F . b.. X abs 2 F . tan δ. Frequency (Hz ). Fig. 5: Experimental values of the loss factor (Diamonds) and model prediction of abs X 2 (Solid line). F . a.- Elastomer b.- Nylon 6. 41004-p.7.
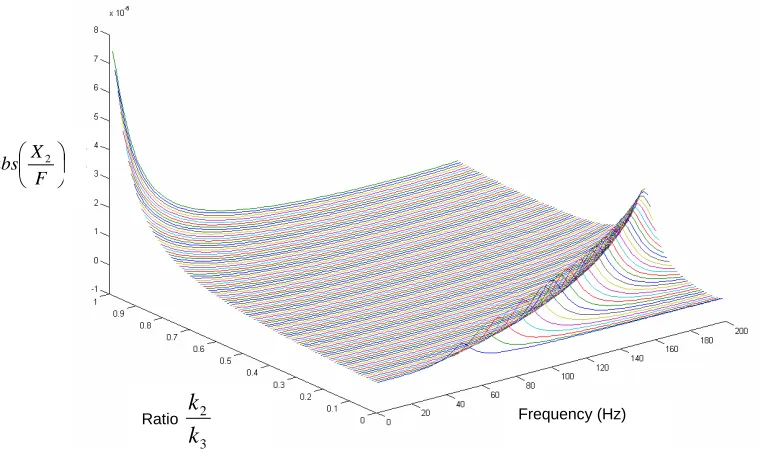
(8) EPJ Web of Conferences Abacuses for users were constructed to identify the suitable range of excitation frequencies according to the sample stiffness and the load sensor stiffness (Fig. 6).. X abs 2 F . Ratio. k2 k3. Frequency (Hz). Fig. 6: Abacus plotted using modelling – Suitable field of excitation frequencies according the ratio k2/k3. 4 Conclusion The Dynamic Mechanical Analysis is commonly considered as a non-resonance technique. However, on the typical excitation frequency range (from 0.01 Hz to 200 Hz), and whatever the apparatus, the sample and the geometry, some resonance phenomena inevitably appear. At the resonance frequency, the measured sample properties are highly affected by the dynamic behaviour of the measuring column. In this study we proposed a straightforward model able to correct the measurements performed closed to the resonance frequency or to predict the value of the resonance frequency in order to avoid testing this frequency range during the dynamic mechanical analysis.. References 1. Read B.E. and Dean G.D. The Determination of Dynamic Properties of Polymers and Composites (Adam Hilger Ltd, Bristol, England, 1978). 2. Read B.E. and Duncan J.C. Polym Test 2: 135-150 (1981). 3. Menard K.P. Dynamic Mechanical Analysis – A practical Introduction. (CRC Press LLC, Boca Raton, Florida,1999). 4. Pournoor K. And Seferis J.C. Polym 32(3): 445-453 (1991). 5. Hagen R., Salmén L., Lavebratt H. and Stenberg B. Polym Test 13: 113-128 (1994). 6. Lacik I., Krupa I., Stach M., Kucma A., Jurciova J., Chodak I. Polym Test 19: 755-771 (2000). 7. Van’t Hof C., Mohanty P., Rixen D. Int. Modal Analysis Conference XXI, Kissimmee (2003). 8. Hutcheson S.A. and McKenna G.B. 6th International Conference on Mechanics of Time Dependent Materials Conference, Monterey, California(2008). 9. ASTM D4085 “Standard practise for determining and reporting Dynamic Mechanical Properties of Plastics”.. 41004-p.8.
(9)
Figure
+2
Related documents
Paired carbon isotope and cadmium data from benthic foraminifera: Implications for changes in oceanic phosphorus, oceanic circulation, and atmospheric carbon dioxide.. Cadmium:
Collaborative Assessment and Management of Suicidality training: The effect on the knowledge, skills, and attitudes of mental health professionals and trainees. Dissertation
Protocols for nontraumatic OHCA Performing CPR on scene for 2 min along with AED use & then transport to the hospital with ongoing CPR in the ambulance Performing CPR on scene
By actively developing good study skills and learning strategies you will keep your motivation high and achieve your goals much more easily and more efficiently... Goal Setting
Results of the survey are categorized into the following four areas: primary method used to conduct student evaluations, Internet collection of student evaluation data,
Different configurations of hybrid model combining wavelet analysis and artificial neural network for time series forecasting of monthly precipitation have been developed and
For the poorest farmers in eastern India, then, the benefits of groundwater irrigation have come through three routes: in large part, through purchased pump irrigation and, in a
the Web developer When developing with PaaS he has to care only about the functionality of his application., he can use the API to access important features of the PaaS
