International Journal of Nanomedicine
Dove
press
O r I g I N a l r e s e a r c h
open access to scientific and medical research
Open access Full Text article
size-dependent accumulation of particles
in lysosomes modulates dendritic cell function
through impaired antigen degradation
correspondence: Fabian Blank respiratory Medicine, Department of clinical research, Murtenstrasse 50, 3008 Bern, switzerland
Tel +41 31 632 7634 Fax +41 31 632 7594 email [email protected] emilie seydoux1,2
Barbara rothen-rutishauser1,3
Izabela M Nita1
sandor Balog3
amiq gazdhar1
Philip a stumbles4,5
alke Petri-Fink3,6
Fabian Blank1,*
christophe von garnier1,
*
1Department of respiratory Medicine,
Inselspital, Bern University hospital, Department of clinical research, University of Bern, 2graduate school
for cellular and Biomedical sciences, University of Bern, Bern, switzerland;
3adolphe Merkle Institute, University
of Fribourg, Fribourg, switzerland;
4school of Veterinary and life
sciences, Molecular and Biomedical sciences, Murdoch University, Perth, Wa, australia; 5Telethon Kids
Institute, Perth, Wa, australia;
6Department of chemistry, University
of Fribourg, Fribourg, switzerland
*These authors contributed equally to the manuscript
Journal name: International Journal of Nanomedicine Journal Designation: Original Research
Year: 2014 Volume: 9
Running head verso: Seydoux et al
Running head recto: Particle size modulates dendritic cell function DOI: http://dx.doi.org/10.2147/IJN.S64353
Introduction: Nanosized particles may enable therapeutic modulation of immune responses by targeting dendritic cell (DC) networks in accessible organs such as the lung. To date, however, the effects of nanoparticles on DC function and downstream immune responses remain poorly understood.
Methods: Bone marrow–derived DCs (BMDCs) were exposed in vitro to 20 or 1,000 nm polystyrene (PS) particles. Particle uptake kinetics, cell surface marker expression, soluble protein antigen uptake and degradation, as well as in vitro CD4+ T-cell proliferation and
cytokine production were analyzed by flow cytometry. In addition, co-localization of particles within the lysosomal compartment, lysosomal permeability, and endoplasmic reticulum stress were analyzed.
Results: The frequency of PS particle–positive CD11c+/CD11b+ BMDCs reached an early
plateau after 20 minutes and was significantly higher for 20 nm than for 1,000 nm PS particles at all time-points analyzed. PS particles did not alter cell viability or modify expression of the surface markers CD11b, CD11c, MHC class II, CD40, and CD86. Although particle exposure did not modulate antigen uptake, 20 nm PS particles decreased the capacity of BMDCs to degrade soluble antigen, without affecting their ability to induce antigen-specific CD4+ T-cell
proliferation. Co-localization studies between PS particles and lysosomes using laser scanning confocal microscopy detected a significantly higher frequency of co-localized 20 nm particles as compared with their 1,000 nm counterparts. Neither size of PS particle caused lysosomal leakage, expression of endoplasmic reticulum stress gene markers, or changes in cytokines profiles.
Conclusion: These data indicate that although supposedly inert PS nanoparticles did not induce DC activation or alteration in CD4+ T-cell stimulating capacity, 20 nm (but not 1,000 nm) PS
particles may reduce antigen degradation through interference in the lysosomal compartment. These findings emphasize the importance of performing in-depth analysis of DC function when developing novel approaches for immune modulation with nanoparticles.
Keywords: polystyrene particles, nanoparticles, immune modulation, mouse dendritic cells, CD4+ T-cells
Introduction
In recent years, intense research has focused on novel clinical applications for nanomaterials in medicine, including the potential use of engineered nanoparticles
(NPs) as carriers for therapeutic applications.1 However, our knowledge regarding
immune responses related to particulate exposure remains incomplete. Before nanocar-riers may be considered for future medical applications, an in-depth understanding of
NP–immune cell interactions is essential.2 Due to their nanoscale size, large surface
area, surface reactivity, and chemical composition, NPs interact differently with
International Journal of Nanomedicine downloaded from https://www.dovepress.com/ by 118.70.13.36 on 23-Aug-2020
For personal use only.
This article was published in the following Dove Press journal: International Journal of Nanomedicine
13 August 2014
Dovepress
seydoux et al
biological systems compared with larger-sized particles of the
same material.3 Moreover, interactions of nanomaterials with
the immune system are affected by physicochemical
proper-ties, such as size, surface coating, charge, or shape.4,5 Hence,
potential nanocarriers require meticulous characterization to rule out any adverse toxicological and immunological
responses prior to utilization in humans.6
Dendritic cells (DCs) are the most potent anti-gen-presenting cells (APCs) in the respiratory tract and are specialized for capture, processing, and presentation
of antigens.7,8 As key elements in regulating immunity
and tolerance, DCs are essential for bridging innate and adaptive immune responses. Consequently, they are often targets for immunotherapeutic approaches. Furthermore, the respiratory tract represents an attractive target organ, given its enormous interface where interaction between DCs and novel inhalable nanocarrier-based vaccines may
occur.9,10 DCs are heterogeneous and exist as multiple distinct
subsets.11 Upon activation by antigen capture, cytokines,
or lipopolysaccharides (LPS), immature DCs undergo a
maturation process into so-called mature DCs.12 During this
process, co-stimulatory molecules and maturation markers are upregulated, and mature DCs migrate towards regional lymph nodes where they may induce expansion of
antigen-specific CD4+ T-cells.13,14 Given the central importance of
DCs in regulating immune responses, it is essential to gain knowledge about phenotypic and functional changes occur-ring following exposure to different particle sizes and at different stages of DC maturation.
We recently reported that among intra-nasally instilled 20, 50, 100, 200, and 1,000 nm polystyrene (PS) particles, particles with a diameter of 20 nm were most frequently captured by DCs compared with larger 1,000 nm particles, and only the smallest particles led to increased
antigen-specific CD4+ T-cell proliferation in local draining lymph
nodes.15 For the present study, we utilized similar particles
to further investigate basic mechanisms of particle–immune cell interactions and functional changes of DCs in vitro. We hypothesized that particle size is a key element in modula-tion of DC funcmodula-tion (ie, antigen uptake, degradamodula-tion, and presentation). We employed fluorescent, negatively charged (carboxylated) PS particles of 20 and 1,000 nm in diameter. These widely employed, supposedly inert model particles were chosen as they are readily detected, available in different sizes with a narrow size distribution and were tested to be
free of endotoxin contamination.15 We herein report our
stud-ies investigating the functional effects of 20 and 1,000 nm PS-particle exposure on mouse bone marrow–derived DCs (BMDCs), using in vitro differentiated immature and mature
BMDCs to assess potential immune modulatory properties of PS particles.
Materials and methods
Mice
Female BALB/c and DO11.10 TCR transgenic (BALB/c background) mice were bred specific pathogen free at the Department of Clinical Research (University of Berne, Switzerland) according to the Swiss Federal Veterinary Office guidelines under animal experimentation permission and used at 8–12 weeks of age.
BMDc cultures, maturation,
and exposure to Ps particles
DCs were generated from bone marrow as described
elsewhere.16 This robust protocol provides a mixture of
immature and mature DCs in the non-adherent cell fraction. For our experiments, we strictly employed non-adherent cells that are a mixture of DC precursors, immature DCs, and mature DCs. Briefly, BMDCs were generated by cul-turing in Iscove’s Modified Dulbecco’s Medium (IMDM) (Invitrogen, Lucerne, Switzerland) containing 10% fetal calf serum (FCS), 1% L-glutamine, 1% penicillin/streptomycin, and 5% granulocyte-macrophage colony-stimulating factor (GM-CSF) (collected from culture supernatant of a X63-GM-CSF myeloma cell line transfected with the murine GM-X63-GM-CSF
gene) for 8 days at 37°C in a 5% CO2 humidified incubator.
Five percent GM-CSF refers to 5% of the collected cell media, and titration of GM-CSF was initially performed before experiments with concentrations of 5%, 10%, and 15% GM-CSF. Five percent was then chosen, as it was the lowest concentration capable of inducing BMDC differentiation and activation following LPS incubation (data not shown).
Yellow-green-labeled carboxylated PS particles of 20 nm (Molecular Probes, Lucerne, Switzerland) or 1,000 nm (Polysciences, Inc., Warrington, PA, USA) were employed. For cell viability experiments, BMDCs were exposed for 16 hours to PS particles at a concentration ranging from
25 µg/mL up to 100 µg/mL. For further experiments,
concentrations for both PS-particle sizes were adjusted to
25 µg/mL to rule out any cytotoxic effects. For NP-uptake
experiments, BMDCs were first matured with 100 ng/mL LPS (Sigma-Aldrich, Buchs, Switzerland) for 16 hours (overnight), and PS particles were added the following day for different time-points (see below “Particle uptake studies using laser scanning microscopy”). For further experiments (antigen uptake, degradation and presentation experiments, co-localization with lysosomes, and endoplasmic reticulum
[ER] stress), PS particles (25 µg/mL) and LPS (100 ng/mL)
International Journal of Nanomedicine downloaded from https://www.dovepress.com/ by 118.70.13.36 on 23-Aug-2020
Dovepress Particle size modulates dendritic cell function
were added concomitantly for 16 hours. All experiments were
conducted with a cell concentration of 1×10⁶ cells/mL.
Ps-particle characterization
PS particles were thoroughly characterized prior to use. The hydrodynamic size was measured by dynamic light scattering (DLS) (3DLS Spectrometer; LS Instruments AG, Fribourg, Switzerland). Measurements were performed both in phosphate-buffered saline (PBS) and cell medium employed
for experiments (IMDM +10% FCS). Zeta potential was
determined in PBS using a Brookhaven-90 Plus Particle Size Analyzer (Brookhaven Instruments Corporation, Holtsville, NY, USA). Additionally, all particles were tested endotoxin free (according to the Limulus amebocyte lysate test; Lonza, Walkersville, MD, USA) as already described in a previous
publication.15
Flow cytometry
Unless indicated otherwise, all antibodies were purchased from eBioscience (Vienna, Austria). All stainings were
per-formed strictly on ice as described.17 BMDC phenotype and
activation state were assessed by staining with CD11b-APC-Alexa Fluor 780, CD11c-APC, CD40-PE-Cy5, CD86-PE-Cy7, and MHCII-PE. T-cells were stained with CD4-APC or CD4-APC-Alexa Fluor 780, CD3-biotin (secondary anti-body: streptavidin-PE-Cy5), CD69-PE-Cy7, DO11.10 TCR (KJ-126)-PE, or DO11.10 TCR (KJ-126)-biotin (secondary antibody: streptavidin-FITC). Relevant isotype control anti-bodies were employed as indicated. Propidium iodide
(Invit-rogen) and Annexin V-Alexa647 (BioLegend®, Lucerne,
Switzerland) staining was performed to measure cell death and apoptosis, respectively. Samples were measured using a SORP LSRII (BD Biosciences, Franklin Lakes, NJ, USA), and the data obtained were analyzed using Flow Jo (Tree Star, Ashland, OR, USA) software.
Particle uptake studies using laser
scanning microscopy (lsM)
BMDCs were matured for 16 hours with LPS, with LPS-untreated BMDCs as controls. All cultures were incubated the
following day with 20 or 1,000 nm PS particles (25 µg/mL)
for a time course of 10, 20, 40, 60, and 90 minutes, and 2, 4, 8, and 16 hours. After washing, BMDCs were spun down for 6 minutes at 900 rpm onto glass slides (Cytospin™ cytocentrifuge; Thermo Scientific, Zürich, Switzerland) and fixed in 70% alcohol for 5 minutes. Cells were permeabilized in 0.2% Triton X-100 (Sigma-Aldrich) and stained with phalloidin rhodamine (1:100; Molecular Probes) and with
DAPI (4′,6-diamidino-2-phenylindole; 1 µg/mL;
Invitro-gen) for 1 hour at room temperature. Afterwards, the cells were washed and mounted in Aquatex mounting medium (Merck KGaA, Darmstadt, Germany). Optical sections were taken with a Zeiss LSM 710 (Carl Zeiss AG, Feldbach,
Switzerland) with a 63× oil objective (Plan-Apochromat
63×/1.40 Oil DIC M27) and a digital zoom of 3×. Image
processing was performed using Imaris® (Bitplane AG,
Zurich, Switzerland) software.
Measurement of antigen uptake
and antigen degradation
Prior to antigen uptake, degradation, and presentation stud-ies, ovalbumin (OVA) and bovine serum albumin (BSA) antigens were thoroughly titrated in preliminary experiments
using a concentration series of 2.5, 10, 20, and 40 µg/mL for
uptake and degradation and 5, 10, 20, 50, and 100 µg/mL
for antigen presentation assays. In each case, the smallest
concentration of antigen that induced robust CD4+ T-cell
pro-liferation was chosen (data not shown). Antigen uptake and degradation capacity of BMDCs were assessed as previously
described.17,18 Briefly, cells were incubated with 2.5 µg/mL
OVA-Alexa Fluor 647 (Molecular Probes) to assess uptake
capacity or with 10 µg/mL BSA-DQ Red (Invitrogen) to
determine degradation capacity. Cells were incubated for a
time course of 0–60 minutes at 37°C or on ice (controls).
Stimulation of carboxyfluorescein
succinimidyl ester (cFse)-labeled
OVA-specific T-cells
CD4+ T-cells from BALB/c DO11.10 mice were isolated
using a CD4-positive isolation kit (Miltenyi Biotech, Bergisch Gladbach, Germany). Cells were labeled with CFSE (eBiosci-ence) and co-cultured for 72 hours with BMDCs that were pre-viously incubated for 16 hours with LPS and/or PS particles, to a ratio 10:1 (T-cells/DCs). In addition, BMDCs were pulsed
for 1 hour with 20 µg/mL OVA protein (Molecular Probes), or
H-2d restricted OVA peptide (20 µg/mL, sequence 323–339;
GenScript, Aachen, Germany) then added to the co-culture for 72 hours. We employed the non-adherent BMDC cell popula-tion without further cell sorting or purificapopula-tion steps. After the incubation period, antigen-specific T-cell proliferation (CFSE dilution) was measured by flow cytometry.
Intracellular cytokine staining
DO11.10+/CD4+ T-cells and BMDCs were co-cultured
as described in the section “Stimulation of carboxyfluo-rescein succinimidyl ester (CFSE)-labeled OVA-specific
T-cells” with or without 20 µg/mL OVA peptide (sequence
323–339; GenScript) for 72 hours. On day 3, Brefeldin
International Journal of Nanomedicine downloaded from https://www.dovepress.com/ by 118.70.13.36 on 23-Aug-2020
Dovepress
seydoux et al
A (20 µg/mL; eBioscience) was added to the cultures for
2 hours. At the end of the culture period, cells were incu-bated with antibodies against CD4 and the DO11.10 T-cell receptor (KJ-126) for 20 minutes on ice prior to fixation in 1% formalin solution for 20 minutes. Cells were incubated
in permeabilization buffer (PBS + 0.1% saponin +10% FCS)
for 5 minutes at room temperature before the following anti-cytokine antibodies were added for 30 minutes: tumor
necrosis factor (TNF)α-eF450, interferon (IFN)γ-eF450,
interleukin (IL)10-PE, IL5-PE, IL17-PE-Cy7, and IL4-APC (all eBioscience).
co-localization studies of Ps particles
with lysosomes
For co-localization studies between lysosomes and PS particles, BMDCs were incubated in 8-well chamber slides
(1µ-Slide ibiTreat microscopy chamber; ibidi GmbH,
Martinsried, Germany) with 20 or 1,000 nm PS particles with or without concomitant LPS for 16 hours. Following PS-particle exposure, BMDCs were washed with IMDM, and the plasma membrane stained with CellMask™
Orange (6 µg/mL, Molecular Probes) and lysosomes with
LysoTracker® Deep Red (1 µM, Molecular Probes) during
1 hour at 37°C. The optimal amount of LysoTracker® Deep
Red was titrated prior to co-localization studies and adjusted
to 1 µM (data not shown). All micrographs were taken with
a Zeiss LSM 710 (previously described). Micrographs used
for three-dimensional reconstruction were taken with a 63×
oil objective (previously described) and a digital zoom of
3×, and image processing was performed using Imaris®
software. Micrographs used to analyze co-localization
were taken with a 40× oil objective (EC Plan-Neofluar
40×/1.30 Oil DIC M27/a =0.21 mm) and image analysis
was performed using ImageJ (NIH, Bethesda, Maryland, USA) software. The degree of co-localization was analyzed in single cells (cropped from LSM images) by assessing the Pearson coefficient. This is an intensity-based analysis where linear correlation between 2 channels (here lysosomes and
PS particles) is measured, giving a value between +1 and −1,
where 1 is total positive correlation, 0 is no correlation,
and −1 is total negative correlation. Forty cells were
ana-lyzed for each condition.
assessment of lysosome permeability
Lysosome permeability of BMDCs that were incubated for 16 hours with LPS and/or PS particles was measured by flow cytometry using the dye acridine orange (AO; MolecularProbes). BMDCs were stained at 37°C with 5 µg/mL AO for
15 minutes prior to flow cytometry analysis.
er stress measurement
Total RNA was extracted from BMDCs treated with
PS particles and/or LPS for 16 hours (NucleoSpin®
RNA isolation kit; Macherey-Nagel, Oensingen, Swit-zerland). Complementary DNA was synthesized from
2 µg of RNA using the Omniscript™ RT kit (Qiagen,
Hombrechtikon, Switzerland). Real-time polymerase chain reactions (PCR) were performed using specific
primers for GRP78 (5′
AGCCCACCGTAACAAT-CAAG and 5′ TCCAGCCATTCGATCTTTTC), CHOP
(5′ CTGCCTTTCACCTTGGAGAC and 5′
CGTTTCCTG-GGGATGAGATA), spliced XBP1 (5′
GAGTCCGCAG-CAGGTGCAG and 5′ ACTGTGAGCGTCCAGCAGGC),
IL-6 (5′ GGTGGACAACCACGGCCTTCCC and
5′AAGCCTCCGACTTGTGAAGTGGT) and IL-1β
(5′ AAAGCCTCGTGCTGTCGGACC and 5′
CAGGGTG-GGTGTGCCGTCTT) (Microsynth, Balgach, Switzerland)
and Fast SYBR Green Master Mix (Applied Biosystems®,
Lucerne, Switzerland). Reactions were performed using a
7500 Real-Time PCR System (Applied Biosystems®). Gene
expression was normalized to 18S RNA (5′
CGCCGCTA-GAGGTGAAATTCT and 5′
CATTCTTGGCAAAT-GCTTTCG). Tunicamycin (2 µg/mL; Sigma-Aldrich) was
used as positive control.19
statistical analysis
All data are presented as mean ± SEM (standard error of the
mean). Data were analyzed with ANOVA (one-way analy-sis of variance) followed by Bonferroni post hoc test. Data
were analyzed using GraphPad Prism® (La Jolla, CA, USA)
software. Values were considered significantly different with
P0.05 (*), P0.005 (**), or P0.001 (***).
Results
Ps-particle characterization
Size of PS particles was measured with DLS in both PBS and cell medium containing 10% FCS. We observed a larger size of 20 nm PS particles than the dimensions pro-vided by the manufacturer (31.3 nm in PBS, 43.9 nm in cell medium). When 20 nm PS particles were incubated in medium containing FCS, there was a modest increase in size compared with PBS, though this was still in the nanoscale. For 1,000 nm PS particles, results from DLS measurements confirmed the manufacturer specifications, both in PBS and cell medium (Table S1). Most importantly, for both particle sizes, DLS measurements and visual inspection excluded aggregation. Furthermore, samples were under observation for more than 3 days, during which period, stability was preserved. As previously published, the zeta potential for
International Journal of Nanomedicine downloaded from https://www.dovepress.com/ by 118.70.13.36 on 23-Aug-2020
Dovepress Particle size modulates dendritic cell function
20 nm PS particles was −15.4±1.4 mV, and for 1,000 nm PS
particles, −17.5±1.9 mV.15
Ps particles do not induce apoptosis
or cell death in BMDcs
Prior to testing the immunomodulatory effects of PS particles on BMDC functional activity, we screened both PS-particle sizes for potential cytotoxic effects. BMDCs were exposed for 16 hours (overnight) to 20 or 1,000 nm
PS particles at concentrations ranging from 5 to 100 µg/mL
with or without concomitant LPS. Levels of apoptotic and dead cells were assessed by flow cytometry using Annexin V and propidium iodide stainings, respectively. We did not observe an increase in apoptosis or cell death in BMDCs treated with either size of PS particle compared with the untreated group (Figure 1). Additionally, BMDC
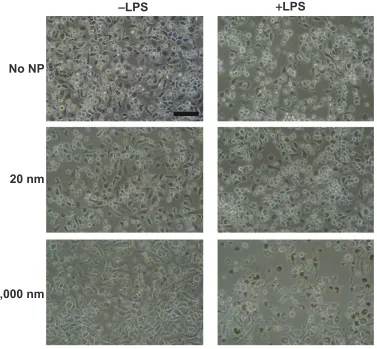
morphol-ogy was unaltered by 25 µg/mL PS-particle or LPS treatment
as demonstrated with light microscope pictures (Figure S1).
For further experiments, a concentration of 25 µg/mL of
PS particles was employed, as this concentration did not induce apparent cytotoxicity and has been shown in another study to be ideal in terms of fluorescence signal and cell
viability.20
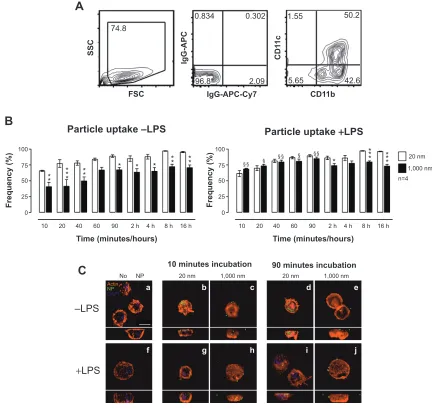
Ps-particle size determines internalization
by BMDcs
To determine the uptake of both sizes of PS particles by BMDCs at different stages of maturation, immature or
LPS-matured BMDCs were treated with 25 µg/mL 20 or
1,000 nm PS particles during a time course of 10, 20, 40, 60, and 90 minutes, and 2, 4, 8, and 16 hours. Cells were subsequently washed and labeled with antibodies to CD11c and CD11b and analyzed by flow cytometry. According to the literature, myeloid or conventional DCs that are in vitro
derived from bone-marrow cells in the presence of GM-CSF consistently show stable high expression of CD11c and
CD11b.16,21 Frequencies of CD11c+/CD11b+ BMDCs
con-taining PS particles were then determined (Figure 2A). Our results showed significantly higher uptake of 20 nm compared with 1,000 nm PS particles in non-LPS-exposed BMDCs at all time-points studied (Figure 2B, left). Uptake of 20 nm PS particles reached a plateau after 20 minutes incubation, with approximately 75% of BMDCs positive for PS particles. In contrast, LPS-exposed BMDCs showed similar uptake for both particle sizes at early time-points, but at later time-points a significantly higher uptake of 20 nm PS particles compared with 1,000 nm PS particles occurred (Figure 2B, right). We observed that uptake of 20 nm PS particles by BMDCs remained stable during all time-points studied, irrespective of LPS exposure, whereas uptake of 1,000 nm PS particles at early time-points (10–90 minutes) was significantly increased in LPS-exposed BMDCs compared with non-LPS-exposed BMDCs (Figure 2B).
To specifically determine whether PS particles were local-ized intra- or extracellular, we performed an in-depth analysis of BMDCs by LSM (Figure 2C). As early as 10 minutes after PS-particle exposure, high numbers of 20 nm PS particles were detected inside BMDCs (Figure 2C [B and G]), compared with low numbers of 1,000 nm PS particles (Figure 2C [C and H]). In particular, lower magnification analyses provided evidence that although the majority of BMDCs contained 20 nm PS particles at early time-points, only a small number of BMDCs had taken up 1,000 nm PS particles (data not shown). More-over, most 20 nm PS particles were localized intracellular, whereas a proportion of 1,000 nm PS particles were detected on the outer cell surface. Importantly, no PS particles were localized in cell nuclei at any time-point.
Early apoptosis Annexin V
–LPS +LPS Ann+ –LPS +LPS PI+
Cell death Propidium lodide
Frequency (%
)
Frequency (%
)
40 100
80 60 40 20 0 30
20 10 0
0 5 25 50 100 0 5 25 50 100 0 5 25 50 100 0 5 25 50 100
*** ***
No NP 20 nm 1,000 nm n=4
Figure 1 Assessment of BMDC viability using flow cytometry.
Notes: Frequenciesof BMDcs in early apoptosis phase (left) or dead (right) following 16-hour incubation with 20 nm (gray) or 1,000 nm (black) Ps particles compared with non-treated cells (white), stained for Annexin V and PI, and measured by flow cytometry. Concentrations of PS particles ranged from 5 to 100 µg/ml. ann+ (positive control for apoptosis) was obtained by fixation of BMDCs with 1% formalin for 40 minutes. PI+ (positive control for cell death) was obtained by placing BMDcs for 30 minutes at −80°c. Bar graphs show mean ± seM; ***P0.001 (positive control versus no NP); n=4.
Abbreviations: ann, annexin; BMDc, bone marrow–derived dendritic cell; lPs, lipopolysaccharide; NP, nanoparticle; PI, propidium iodide; Ps, polystyrene; seM, standard error of the mean.
International Journal of Nanomedicine downloaded from https://www.dovepress.com/ by 118.70.13.36 on 23-Aug-2020
Dovepress
seydoux et al
In summary, flow cytometry and LSM analyses demonstrated that both 20 and 1,000 nm PS particles were successfully taken up by BMDCs in a time-dependent man-ner, although 20 nm PS particles were internalized more rapidly and to a greater extent compared with 1,000 nm PS particles.
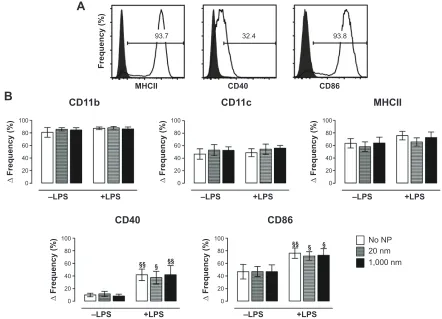
stable BMDc phenotype following
treatment with Ps particles
We next aimed to analyze possible changes in BMDC phenotype and expression of co-stimulatory molecules
following PS-particle exposure with or without concomitant LPS treatment. Employing flow cytometry with relevant
isotype controls, we gated CD11c+/CD11b+ BMDCs to
determine MHC class II+ (MHCII+), CD40+, and CD86+
cell frequencies (Figure 3A). The frequencies of CD40+ and
CD86+ cells significantly increased upon LPS exposure, but
were unaffected by PS-particle treatment of both sizes. In
contrast, frequencies of MHCII+ cells remained unchanged
by both LPS and/or PS-particle treatment (Figure 3B). Taken together, these findings suggest that neither 20 nor 1,000 nm PS particles induced alterations in BMDC surface phenotype
SSC
FSC IgG-APC-Cy7
IgG-AP
C
CD1
1c
CD11b
A
74.8
0.834 0.302
96.8 2.09
1.55 50.2
42.6 5.65
Particle uptake –LPS Particle uptake +LPS
Frequency (%
)
Frequency (%
)
Time (minutes/hours) Time (minutes/hours)
100
75
50
25
0
100
75
50
25
0
10 20 40 60 90 2 h 4 h 8 h 16 h 10 20 40 60 90 2 h 4 h 8 h 16 h
20 nm 1,000 nm n=4
** *** **
** ** *
* * * ** ***
*
§ § § § § § §
§
B
C
No NP 10 minutes incubation20 nm 1,000 nm 90 minutes incubation20 nm 1,000 nma b c d e
f g h i j
–LPS
+LPS
Actin
NP
DAPI
Figure 2 Uptake of PS particles by BMDCs determined by flow cytometry and LSM.
Notes: (A)Flow cytometry analysis included gating on cD11b+/cD11c+ BMDcs based on their relevant isotype controls. (B) Frequencies of positive cells for 20 nm (white)
or 1,000 nm (black) Ps particles were subsequently determined. left panel shows data for immature BMDcs (−lPs), while right panel shows data for mature BMDcs (+lPs). White bars, 20 nm; black bars, 1,000 nm. Bar graphs show mean ± seM; *P0.05, **P0.005, ***P0.001 (20 nm versus 1,000 nm Ps particles); §P0.05, §§P0.005 (−lPs versus +lPs);n=4. (C) Confirmation of PS-particle uptake by BMDCs determined by LSM. Upper micrographs (a–e) show uptake by immature BMDCs (−lPs), while lower micrographs (f–j) show uptake by mature BMDcs (+lPs). xy-projections (top panels) and xz-projections (lower panels) were obtained from three-dimensional stacks of consecutive optical sections. Orange, actin; green, particles; blue, DaPI (nucleus). White bar: 10 µm. Magnification: 63×+ 3× digital zoom. One representative experiment from four independent experiments is shown.
Abbreviations: BMDc,bone marrow–derived dendritic cell; DaPI, 4′,6-diamidino-2-phenylindole; lPs, lipopolysaccharide; lsM, laser scanning microscopy; NP, nanoparticle; Ps, polystyrene; seM, standard error of the mean.
International Journal of Nanomedicine downloaded from https://www.dovepress.com/ by 118.70.13.36 on 23-Aug-2020
Dovepress Particle size modulates dendritic cell function
and activation in the absence or presence of LPS-dependent maturation.
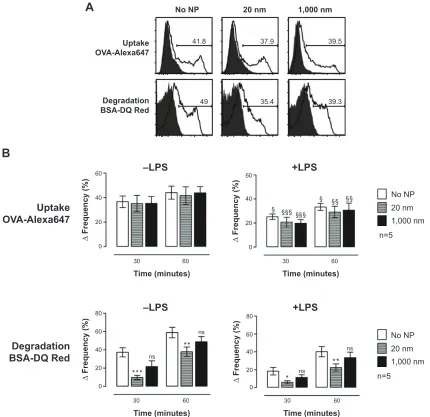
size 20 nm Ps particles modulate
antigen degradation in BMDcs
To investigate potential particle-mediated alterations of BMDC function, we investigated the capacity of BMDCs to take up and degrade antigen following PS-particle treatment. As previously reported, OVA coupled to Alexa647 and BSA coupled to DQ-Red were used to analyze antigen uptake and
antigen degradation, respectively.18,22–24 The flow cytometry
gating strategy from one representative experiment for OVA
uptake and BSA degradation by CD11c+/CD11b+ BMDCs
is shown in Figure 4A. In the absence of concomitant LPS
exposure, OVA uptake was similar in CD11c+/CD11b+
BMDC cultures without particles compared with those incu-bated with 20 or 1,000 nm PS particles. However, antigen uptake was reduced in LPS-treated BMDCs compared with
non-LPS-treated BMDCs, independently of PS-particle exposure (Figure 4B, upper panels). Decreased antigen deg-radation occurred in BMDCs treated with 20 nm PS particles but not with 1,000 nm PS particles, when compared with the untreated group, both in the presence or absence of LPS (Figure 4B, lower panels). Therefore, although PS particles did not alter antigen uptake by BMDCs, we observed decreased antigen degradation following exposure to 20 nm PS particles,
both in immature (−LPS) and mature (+LPS) BMDCs.
Antigen-specific T-cell stimulation
by BMDcs remains stable following
treatment with Ps particles
We employed an in vitro OVA-specific DO11.10+/CD4+
T-cell proliferation assay to clarify whether alterations in antigen degradation induced by PS-particle treatment affect
downstream antigen presentation and activation of CD4+
T-cells by BMDCs. Following treatment with PS particles
A
Frequency (%
)
MHCII
93.7 32.4 93.8
CD40 CD86
B
CD11b CD11c MHCII∆ Frequency (%
)
∆ Frequency (%
)
∆ Frequency (%
)
–LPS +LPS –LPS +LPS –LPS +LPS
100 80 60 40 20 0
100 80 60 40 20 0
100 80 60 40 20 0
CD40 CD86
–LPS +LPS
§§ §§
§§
§
§ §
–LPS +LPS
∆ Frequency (%
) 100 80 60 40 20
0 ∆ Frequency (%
) 100 80 60 40 20 0
No NP 20 nm 1,000 nm
Figure 3 Expression of phenotype and co-stimulatory markers utilizing flow cytometry.
Notes: (A)cD11b+/cD11c+ BMDcs were gated based on their relevant isotype controls. Frequencies of expression of MhcII, cD40, and cD86 (open histograms) were
subsequently determined based on their adequate isotype control (solid histograms). (B) Frequencies of BMDcs positive for the phenotypic markers cD11b, cD11c, and MhcII (upper panels) and for the co-stimulatory molecules cD40 and cD86 (lower panels) were analyzed. results are expressed as Δ frequency = measured sample frequency minus measured isotype control frequency. White bars, no particles; gray bars, 20 nm; black bars, 1,000 nm Ps particles. Bar graphs show mean ± seM; §P0.05, §§P0.005 (−lPs versus +lPs); n=4 (cD40 and cD86), n=8 (cD11b, cD11c, and MhcII).
Abbreviations: BMDc, bone marrow–derived dendritic cell; lPs, lipopolysaccharide; NP, nanoparticle; Ps, polystyrene; seM, standard error of the mean.
International Journal of Nanomedicine downloaded from https://www.dovepress.com/ by 118.70.13.36 on 23-Aug-2020
Dovepress
seydoux et al
with or without LPS, BMDCs were co-cultured with
CFSE-labeled transgenic CD4+ T-cells specific for an H-2d-restricted
OVA peptide. DO11.10+ (KJ-126+) CD4+ T-cells were gated
(Figure 5A), and responses to OVA peptide and whole OVA protein were assessed by analyzing T-cell proliferation (CFSE dilutional profiles) after 72 hours of culture. The expansion index (EI) was measured based on CFSE profiles with the Flow Jo software. The EI is the ratio of final cell count to starting cell count and therefore represents the fold
expan-sion during culture.25 Independently of LPS, the EI remained
unchanged for cells treated with PS particles as compared with untreated cells both for OVA peptide and OVA protein pulsed BMDCs (Figure 5B and C). Significant increases in
CD4+ T-cell proliferation occurred in LPS-exposed BMDCs
as compared with non-LPS-exposed cultures (Figure 5C). These data therefore suggest that antigen-specific T-cell stimulation by antigen-pulsed BMDCs, using either OVA peptide (antigen-degradation independent) and whole OVA protein (antigen-degradation dependent), remained unaf-fected by PS-particle exposure of either size.
A
Uptake OVA-Alexa647
No NP
41.8 37.9 39.5
49 35.4 39.3
20 nm 1,000 nm
Degradation BSA-DQ Red
B
–LPS +LPS
–LPS +LPS
Time (minutes)
Time (minutes) Time (minutes) Time (minutes) Uptake
OVA-Alexa647
60
40
20
0
60
40
20 §
§ §§§ §§§
§§ §§
0
30 60 30 60
∆ Frequency (%
)
60 80
40
20
0
30 60 30 60
∆ Frequency (%
)
60 80
40
20
0
∆ Frequency (%
)
∆ Frequency (%
)
Degradation BSA-DQ Red
***
ns
ns
ns
ns
*
*
** *
No NP 20 nm 1,000 nm n=5
No NP 20 nm 1,000 nm n=5
Figure 4 Antigen uptake and antigen degradation in the presence of particles and/or LPS, measured utilizing flow cytometry.
Notes: cells were incubated with OVa-alexa647 (antigen uptake) or Bsa-DQ red (antigen degradation) during a time course of 0–60 minutes at 37°c or on ice (controls). (A) histogram plots of one representative experiment. Negative controls (solid histograms) were obtained with cells kept on ice. Open histograms represent antigen uptake (upper panel) or antigen degradation (lower panel) after 60 minutes. (B) Bar graphs show capacity of BMDcs to take up (upper panel) and degrade (lower panel) antigen after 16 hours incubation with 20 nm (gray bars) or 1,000 nm (black bars) Ps particles compared with non-treated cells (white bars). results are expressed as Δ frequency = measured sample frequency (at time-point 30 or 60 minutes) minus measured control frequency (at time-point 0 minutes). Bars show mean ± seM; *P0.05, **P0.005, ***P0.001 (no NP versus 20 nm); §P0.05, §§P0.005, §§§P0.001 (−lPs versus +LPS), ns, non-significant; n=5.
Abbreviations: BMDc, bone marrow–derived dendritic cell; Bsa, bovine serum albumin; lPs, lipopolysaccharide; NP, nanoparticle; OVa, ovalbumin; Ps, polystyrene; seM, standard error of the mean.
International Journal of Nanomedicine downloaded from https://www.dovepress.com/ by 118.70.13.36 on 23-Aug-2020
Dovepress Particle size modulates dendritic cell function
Ps particle–treated BMDcs
do not alter antigen-specific
cD4
+T-cell cytokine profiles
Although PS-particle exposure did not alter BMDC antigen
presentation and CD4+ T-cell proliferation, we next
deter-mined whether immune responses may be affected by
altera-tion of T-cell cytokine profiles. To test this, DO11.10+/CD4+
T-cells were co-cultured with PS particle–exposed BMDCs
(±LPS) for 72 hours in the presence or absence of 20 µg/mL
OVA peptide. Production of the cytokines IFN-γ and TNF-α
(Th-1), IL-4 and IL-5 (Th-2), IL-17 (Th-17), IL-10
(regula-tory T-cells)26 by CD4+ T-cells was assessed by intracellular
staining and flow cytometry (Figure 6). OVA peptide ±LPS,
but not LPS alone, induced cytokine production that was not affected by PS-particle treatment of BMDCs.
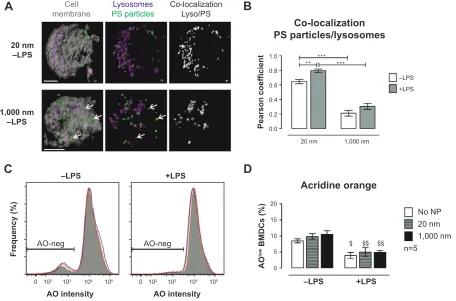
size 20 nm Ps particles co-localize with
lysosomes without increasing lysosome
permeability
To understand why antigen degradation was decreased following treatment with 20 nm PS particles but not with larger 1,000 nm PS particles, we analyzed the extent to which
PS particles co-localized with lysosomes, as these organelles are the site where antigen degradation takes place. Following
16 hours incubation with 25 µg/mL PS particles, lysosomes
were stained using the lysosomal marker LysoTracker® Deep
Red, which labels acidic organelles,3,27–29 and examined by
confocal microscopy. While almost all 20 nm PS particles co-localized with lysosomes, fewer 1,000 nm PS particles co-localized in lysosomes (Figure 7A, arrows). We next quanti-fied co-localization using the Pearson coefficient. A significant increase in co-localization with lysosomes occurred following incubation with 20 nm compared with 1,000 nm PS particles in both untreated and LPS-treated BMDCs (Figure 7B). In addi-tion, co-localization of 20 nm PS particles in LPS-treated BMDCs was higher than in non-treated BMDCs (Figure 7B). To exclude that PS-particle fluorescence changes occurred at acidic pH in lysosomes, potentially influencing particle detec-tion, we investigated the emission fluorescence intensity of PS particles in buffer solutions at pH 5 and pH 7 at different time-points. No significant differences in fluorescence inten-sity occurred at pH 5 and pH 7 for both 20 and 1,000 nm PS particles at all time-points (Figure S2).
We further assessed whether PS particles could affect lysosomal membrane integrity and therefore induce leakage
A
SSC
IgG-AP
C
CD4-AP
C
FSC
80.5
1.8
96.7 1.44
0.03 1.1 98.6
0.16 0.139
IgG-PE DO11.10-PE
B
Expansion index –LPS
Expansion inde
x
No OVA 0
1 2 3 4 5
Expansion inde
x
0 1 2 3 4 5
OVA
peptide peptideOVA No OVA peptideOVA peptideOVA
No NP
§ § §§
20 nm 1,000 nm n=5
Expansion index +LPS
C
Figure 5 In vitro OVA-specific DO11.10+/cD4+T-cell stimulatory capacity of immature and mature BMDcs incubated with 25 µg/ml of 20 or 1,000 nm Ps particles in the
presence or absence of OVa peptide or OVa protein.
Notes: (A)gating strategy consists of an Fsc/ssc gate (left panel) and an isotype-control gate for cD4+/DO11.10+ T-cells (middle and right panels). Proliferation of
DO11.10+/cD4+T-cells was assessed with the help of Flow Jo software by calculating the expansion index. results show proliferation of T-cells following co-culture with
non-lPs-exposed (B) and lPs-exposed (C)BMDcsin absence of OVa, with 20 µg/ml OVa peptide or with 20 µg/ml whole OVa protein. White bars, no particles; gray bars, 20 nm; black bars, 1,000 nm Ps particles. Bars show mean ± seM; §P0.05, §§P0.005 (−lPs versus +lPs); n=5.
Abbreviations: BMDc, bone marrow–derived dendritic cell; lPs, lipopolysaccharide; NP, nanoparticle; OVa, ovalbumin; Ps, polystyrene; seM, standard error of the mean.
International Journal of Nanomedicine downloaded from https://www.dovepress.com/ by 118.70.13.36 on 23-Aug-2020
Dovepress
seydoux et al
of lysosomal enzymes into the cytosol, by using the dye AO. AO accumulates in lysosomes and leads to red fluorescence, which decreases when the dye leaks out of the lysosomes into the cytosol due to increased permeability. AO-negative gating
was used to assess the percentage of AOlow BMDCs, which
rep-resents cells with lower AO fluorescence intensity, thus perme-able lysosomes (Figure 7C). We observed that incubation with
25 µg/mL of both 20 and 1,000 nm PS particles did not increase
permeability of lysosomes (Figure 7D), providing evidence that lysosomes remain intact at the concentrations utilized.
Ps particles do not induce
er stress in BMDcs
One stage in antigen degradation involves synthesis of MHC class II molecules in the ER. Following synthesis, MCHII molecules are transported to endosomal vesicles, where
they are loaded with antigen-derived peptides.30 To identify
potential adverse effects of PS particles on this phase of antigen processing, we assessed ER stress in BMDCs which
were previously incubated with 25 µg/mL PS particles.
The ER stress response is triggered when an accumulation of misfolded or unfolded proteins is found in the lumen of the
ER under stress conditions.31,32 Expression of different ER
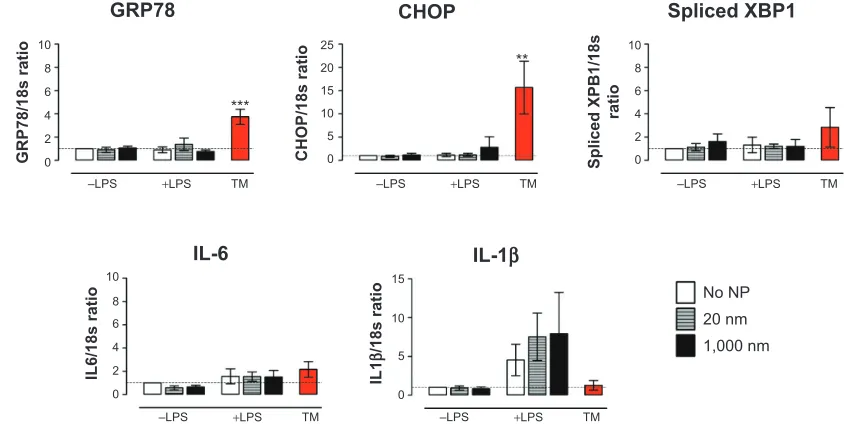
stress gene markers such as GRP78 chaperone and adaptive pathways CHOP and spliced XBP1 were measured by real-time-PCR. Expression of the pro-inflammatory cytokines
IL-1β and IL-6 was also determined. Tunicamycin, a known
ER stress inducer, was employed as positive control for ER stress. Treatment of BMDCs with PS particles did not trigger an increased expression of messenger RNA (mRNA) encod-ing GRP78, CHOP and spliced XBP1, or transcription of the
genes encoding the cytokines IL-1β and IL-6 (Figure 8).
Treat-ment of cells with LPS induced, as expected, an expression of
IL-1β mRNA; this was, however, unchanged in the presence
of PS particles. These results indicate that PS particles did not induce an apparent ER stress response in BMDCs.
Discussion
Despite recent intensive research in the field of nanomedicine, fundamental knowledge about nanomaterial–cell interactions
A
TNFα-eF450
46.5 7.53 14.3 35 13.3 4.55
Frequency (%
)
IL-5-PE IL-17-PE-Cy7 IFNγ-eF450 IL-10-PE IL-4-APC
B
Th-1
% IFN
-γ +
T
cells
%
TNF-α +
T
cells
% IL-4 +
T
cells
% IL-17 +
T
cells
Th-17
T-reg IFN-γ
– + +
+
+–
– – –– +– +– ++
60
40
20
0
60
40
20
0
5 10 15 20
0
5 10 15 20
0 % IL-5 +
T
cells
5 10 15 20
0 % IL-10 +
T
cells
5 10 15 20
0 OVA
– + +
+ + –
– – LPS OVALPS OVALPS
OVA
– + +
+ + –
– – LPS –– –+ +– ++ OVALPS –– –+ +– ++ OVALPS
IL-4 IL-5 IL-10
TFN-α IL-17
Th-2
No NP 20 nm 1,000 nm n=5
Figure 6 cytokine production by DO11.10 transgenic cD4+T-cells following 72 hours co-culture with BMDCs in absence or presence of LPS and OVA, analyzed by flow
cytometry.
Notes: (A)gating strategy consists in an isotype-control gate for cD4+/DO11.10+ T-cells. Frequencies of positive T-cells for different cytokines (open histograms) were
determined based on respective isotype controls (solid histograms). (B) Frequencies of cD4+/DO11.10+ T-cells positive for Th-1 cytokines IFN-γ and TNF-α, Th-2 cytokines
Il-4 and Il-5, Th-17 cytokine Il-17, and T-reg cytokine Il-10 are shown. results are expressed as Δ frequency = measured sample frequency minus measured isotype control frequency. White bars, no particles; gray bars, 20 nm; black bars, 1,000 nm Ps particles. Bars show mean ± seM; n=5.
Abbreviations: BMDc,bone marrow–derived dendritic cell; IFN, interferon; Il, interleukin; lPs, lipopolysaccharide; NP, nanoparticle; OVa, ovalbumin; Ps, polystyrene; seM, standard error of the mean; Th, T helper; TNF, tumor necrosis factor; T-reg, regulatory T-cells.
International Journal of Nanomedicine downloaded from https://www.dovepress.com/ by 118.70.13.36 on 23-Aug-2020
Dovepress Particle size modulates dendritic cell function
C
D
A
Cellmembrane
20 nm –LPS
Pearson coefficien
t
Frequency (%
)
AO
lo
w BMDCs (%
)
1,000 nm –LPS
Lysosomes
PS particles Co-localizationLyso/PS
0.0
0 5 10 15 20
§ §§ §§
–LPS –LPS
AO intensity
AO-neg
0 102 103 104 105 0 102 103 104 105 AO-neg
AO intensity +LPS
+LPS
20 nm 1,000 nm 0.2
0.4 0.6 0.8
1.0 **
** * ***
–LPS +LPS
Co-localization PS particles/lysosomes
Acridine orange
B
No NP 20 nm 1,000 nm n=5
Figure 7 Interaction of PS particles with lysosomes analyzed by LSM and flow cytometry.
Notes: (A)Upper micrographs show co-localization with 20 nm Ps particles in immature BMDcs (−lPs), whereas lower micrographs show co-localization with 1,000 nm Ps particles. Micrographs were obtained from three-dimensional stacks of consecutive optical sections and analyzed with Imaris® software. gray, cell membrane; green, Ps
particles; violet, lysosomes; white, co-localization of lysosomes and Ps particles. White bars: 10 µm. Magnification: 63×+ 3× digital zoom. arrows: Ps particles not co-localized with lysosomes. One representative experiment from four independent experiments is shown. (B) Quantitative analysis of co-localization between Ps particles and lysosomes using Image J software. Four independent experiments were performed, and for each condition, 40 cells in total were selected randomly and analyzed. White bars, −lPs; gray bars, +lPs. Bar graphs show mean ± seM; **P0.005, ***P0.001. (C) Histogram plots for BMDCs stained with AO and analyzed by flow cytometry. AO-negative gating was used to assess the percentage of aOlow BMDcs showing lysosomal leakage. No NP, gray solid histogram; 20 nm, blue open histogram; 1,000 nm, red open histogram.
(D) Frequencies of aOlow BMDcs following 16 hours incubation with 25 µg/ml 20 nm (gray) or 1,000 nm (black) Ps particles. Bars show mean ± seM; §P0.05, §§P0.005
(−lPs versus +lPs); n=5.
Abbreviations: aO,acridine orange; BMDc, bone marrow–derived dendritic cell; lPs, lipopolysaccharide; lsM, laser scanning microscopy; NP, nanoparticle; Ps, polystyrene; seM, standard error of the mean.
is still insufficient, particularly in understanding effects on the immune system. It has been recognized to date that NP–cell interactions are affected by a number of diverse particle properties, such as size, shape, and surface charge. In this study, we aimed to analyze size-dependent effects on BMDCs during treatment with nanosized (20 nm) and micro-sized (1,000 nm) PS particles in an in vitro model. The scope of the present study was to focus on particle size in order to systematically and thoroughly analyze size-dependent effects, and therefore only PS particles were included in the present study. Further evaluations are in progress employing a recently established fluorescence-encoded gold-NP library
with different surface modifications33 in order to understand
surface-dependent effects. The underlying study is comple-mentary to our recent work showing that in vivo lung DC subpopulations preferentially capture and traffic 20 nm PS particles compared with 1,000 nm PS particles, where
smaller particles induce enhanced CD4+ T-cell proliferation
in draining lymph nodes.15 In the current study, we provided
an exhaustive investigation into particle-dependent modula-tion of DC funcmodula-tion and showed that treatment with particles did not affect cell viability, surface phenotype (CD11c and CD11b), or activation (CD40, CD86, and MHCII) markers. Although particle treatment did not modulate antigen uptake, 20 nm PS particles decreased the capacity of BMDCs to degrade antigen irrespective of LPS exposure, compared with larger 1,000 nm PS particles that did not modulate BMDC function. For both PS-particle sizes, BMDC-mediated
antigen-specific stimulation of CD4+ T-cells and induction
of cytokines remained similar to non-particle-exposed con-trol cells. Furthermore, we observed that co-localization of 20 nm PS particles with lysosomes was significantly higher compared with 1,000 nm PS particles, without measurable perturbation of lysosomal function or ER stress.
International Journal of Nanomedicine downloaded from https://www.dovepress.com/ by 118.70.13.36 on 23-Aug-2020
Dovepress
seydoux et al
We adopted a widely employed robust model utilizing submersed cultures of BMDCs to allow straightforward administration of PS particles and analyses by flow cyto-metry and confocal microscopy. Nevertheless, it is central to interpret the data in the context of the particle application method employed in this study (as described in the Meth-ods section): for every particle size, a suspension
contain-ing 25 µg/mL of PS particles was administrated; hence,
there is a 125,000-fold difference in particle numbers at the extremes between 20 and 1,000 nm PS particles. This difference in particle number could theoretically influence particle uptake by BMDCs measured by determining fluo-rescence intensities. This potential bias in particle numbers is countered by limitations in detection sensitivity by flow cytometry: While fluorescence emitted from a single 1,000 nm PS particle is highly above detection threshold and can therefore easily be detected by flow cytometry, this is not the case for single 20 nm PS particles (data not shown). Therefore, with our approach that heavily relied on detecting and tracing sufficiently fluorescent particles over a wide size range, utilizing equal particle mass was the most appropriate strategy to account for size-dependent
variations in fluorescence intensities.15 The resolution of
microscopy is limited to approximately 200 nm in lateral
and 500 nm in axial dimension.34 Although single 20 nm
PS particles cannot be distinguished, the number of pixels
GRP78
IL-6 IL-1β
CHOP Spliced XBP1
GRP78/18s ratio CHOP/18s ratio Spliced XPB1/18s
ratio
IL6/18s rati
o
IL1
β
/18s rati
o
10 25
20
10 8 6 4 2 0 15
10 5 0 8
6 4 2 0
10 15
10
5
0 8
6 4 2 0
–LPS +LPS TM –LPS +LPS TM –LPS +LPS TM
–LPS +LPS TM
No NP 20 nm 1,000 nm
–LPS +LPS TM
***
**
Figure 8 Messenger rNa expression level of different markers for endoplasmic reticulum stress measured by real-time-Pcr in BMDcs following Ps-particle exposure.
Notes: expressionof GRP78, CHOP, and XBP1, as well as pro-inflammatory cytokines IL1-β and Il-6 were assessed in cells left untreated (white) or incubated overnight with 25 µg/ml 20 nm (gray) or 1,000 nm (black) Ps particles. expression levels of genes of interest were normalized to 18s gene expression. all ratios were normalized to the ratio of No NP −lPs (BMDcs unexposed to Ps particles and untreated with lPs). red bars show expression level for TM, a positive control for endoplasmic reticulum stress. Bar graphs show mean ± seM; **P0.005, ***P0.001 (TM versus no NP −lPs); n=4.
Abbreviations: BMDc,bone marrow–derived dendritic cell; lPs, lipopolysaccharide; NP, nanoparticle; Pcr, polymerase chain reaction; Ps, polystyrene; TM, tunicamycin; seM, standard error of the mean; Il, interleukin.
generating a signal event can be quantified. As previously reported, we employed this approach to analyze both
20 and 1,000 nm PS particles15 or fluorescent-magnetic
hybrid NPs.34
In line with our findings, a previous study by Frick
et al35 showed that human DCs incubated with negatively
charged phosphonated and sulfonated PS particles of an aver-age diameter of 245 and 227 nm, respectively, at
concentra-tions of 25, 75, and 150 µg/mL for 24 hours does not cause
significant apoptosis. Another study by Zupke et al20
deter-mined that only larger PS particles (100 and 500 nm) at a
concentration of 50 µg/mL for 24, 48, and 72 hours induced
significant cytotoxicity in NIH 3T3 fibroblast cells compared with smaller PS particles (50 nm). In fact, even though PS particles employed in our study are often considered to be chemically inert and safe, it is essential to realize that such particles may induce biological effects partly associated
with surface charge.36 It is indeed often reported that
posi-tively charged PS particles trigger cell death even at low concentrations when compared with neutral or negatively charged particles, indicating that the surface coating plays a
major role in cell death induced by particles.3,37,38 Since we
employed negatively charged PS particles for our exposures, the low levels of cell death found following PS-particle treatment can be explained by the negative surface charge of our PS particles.
International Journal of Nanomedicine downloaded from https://www.dovepress.com/ by 118.70.13.36 on 23-Aug-2020
Dovepress Particle size modulates dendritic cell function
We also provided evidence for a differential uptake of 20 and 1,000 nm PS particles by immature (non-LPS-exposed) BMDCs. In immature BMDCs, uptake of 20 nm PS particles reached an early plateau after 20 minutes, whereas this only occurred after 60 minutes for 1,000 nm PS particles. The frequency of particle-positive BMDCs was always lower for 1,000 nm than for 20 nm PS particles. Employing cell lines, a human in vitro study with negatively
charged PS particles ranging from 40 nm to 2 µm showed that
uptake was also size-dependent for all cell lines tested.39 As
expected, it was also demonstrated that phagocytic cells have a much higher internalization capacity compared with other cell types, although all NPs tested still could enter
all cell lines.39 Moreover, when monitoring size-dependent
uptake, Johnston et al40 reported limited uptake of 200 nm
compared with 20 nm PS particles in human hepatocytes. In
line with our study, a study by Foged et al41 also confirmed
that optimal particle diameter for rapid uptake by human immature DCs is below 50 nm. Pathways by which NPs enter cells are to date still not fully understood and depend on cell type, size, surface charge, shape, and bulk material
of NPs used.39,42,43 Rejman et al44 found that internalization
of particles smaller than 200 nm involves clathrin-mediated endocytosis, while with increasing particle size caveolae-mediated internalization occurs. Another study showed that larger PS particles (200 nm) are found on the cell
surface,40 suggesting that larger particles could be bound to
receptors on the plasma membrane prior to internalization. Moreover, in another study from our group, we employed the J774A.1 mouse macrophage cell line to compare uptake of 1,000 nm and 40 nm PS particles using different inhibi-tors of endocytotic pathways (Kuhn et al, unpublished data, 2014). We found that 40 nm PS particles undergo clathrin-mediated uptake and macropinocytosis or phagocytosis, while 1,000 nm PS particles are taken up only by macropi-nocytosis or phagocytosis.
A salient finding in the present study is that uptake of 20 nm PS particles by BMDCs was unchanged following LPS exposure, whereas uptake of 1,000 nm PS particles was increased in LPS-exposed BMDCs. These results are contrary to our general understanding that immature DCs are endowed with ability for antigen uptake but with a poor capacity to present antigen to naïve T-cells. In response to antigen encounter or danger signals such as LPS, DCs undergo maturation and are capable to prime naïve T-cells
while shutting down their ability for antigen uptake.12,45 A
potential explanation for increased uptake of larger particles may be that immature BMDCs, upon activation by LPS,
increase the number of dendrites and therefore their surface area. Larger PS particles may therefore more readily adhere and be taken up by BMDCs. These findings should, however, be further investigated. It was noteworthy, however, that although PS-particle uptake was not affected by LPS stimula-tion, our data confirmed that LPS exposure and maturation of BMDCs decreased their capacity for uptake of soluble antigen (OVA).
DCs are key players in induction of immune responses, and their function is closely influenced by their level of so-called maturation. Maturation of DCs is known to be medi-ated by different danger signals such as microbial products and results in upregulated expression of co-stimulatory
molecules.46 To assess effects of PS-particle incubation on
BMDCs, we analyzed BMDC maturation and phenotype after PS-particle treatment. Our data showed that PS-particle treatment did not induce or alter maturation of BMDCs, as frequencies of cells expressing MHC Class II, CD40, and CD86 remained unaffected. Findings reported in the literature regarding capacity of PS particles to induce maturation of immune cells also show that with similar conditions (con-centration and incubation time), no significant difference in expression levels of activation markers occurs following
incubation with PS particles.20,35
Another aspect of DC immune function is the capacity of antigen uptake and antigen degradation. While uptake of labeled OVA protein was not altered by the presence of PS particles, degradation of antigen was downregulated in BMDCs treated with 20 nm PS particles, but not with 1,000 nm PS-particle treatment. The model antigen OVA employed in antigen-uptake experiments was endotoxin-free and not modified by the addition of carbohydrate moieties; therefore, as myeloid C-type lectin receptors (CLR) on immune cells such as DCs recognize carbohydrate
moieties on antigen,47 it is unlikely that CLR-binding of
OVA-Alexa647 accounts for the extent of antigen uptake observed. These new findings confirm that particle size may represent a relevant parameter determining DC function, as only BMDCs treated with nanosized particles were unable to fully degrade or process OVA antigen. Interestingly, the
capacity of particle-treated BMDCs to stimulate CD4+ T-cells
remained stable when compared with untreated BMDCs, indicating that decreased antigen degradation did not affect induction of T-cell proliferation. Indeed, although antigen degradation capacity was significantly decreased in the pres-ent study, it was not completely shut down. We suggest that the reduced level of antigen degradation was still sufficient to
induce measurable antigen-specific CD4+ T-cell proliferation.
International Journal of Nanomedicine downloaded from https://www.dovepress.com/ by 118.70.13.36 on 23-Aug-2020
Dovepress
seydoux et al
Other in vitro studies using PS particles show divergent
find-ings concerning their immune-modulatory potential.20,35 In
a recent in vivo study, we showed that negatively charged 20 nm PS particles are able to enhance antigen presentation
to CD4+ T-cells in lung-draining lymph nodes.15 Also, another
study in vivo demonstrated that glycine-coated PS particles of
50 nm markedly dampen the ability of CD11b+ DCs in
lung-draining lymph nodes to stimulate OVA-specific T-cells.48
In addition to antigen uptake, antigen degradation and
T-cell stimulatory capacity, cytokine production in CD4+
T-cells co-cultured with particle-exposed BMDCs was assessed. Our study showed no influence of PS particles on expression of all cytokines tested, suggesting that particle-exposed BMDCs did not alter the T helper (Th) cell cytokine profiles. Results reported in the literature are discordant on particle-dependent effects on Th profiles. For instance, a
Th-1 shift with increased IFN-γ production was measured
in human immature DCs treated with 75 µg/mL positively
charged PS particles,35 while an in vivo study showed that
PS particles do not induce an increase in BAL fluid IFN-γ
or IL-17 but prevented Th-2 immunity.48 Johrden et al49 also
demonstrated that production of IFN-γ by CD4+ and CD8+
T-cells is not increased following incubation with PS particles. These findings further reveal that comparability between studies is often limited. Indeed, many parameters may have been an influence when investigating NP potential to modulate immune cells: size, coating, and surface charge of the administered NPs, but also responder T-cell types utilized, concentration of particles, endotoxin contamination, or incubation time.
In search of an explanation for reduced antigen degrada-tion in BMDCs following exposure to 20 nm PS particles, we detected increased co-localization with lysosomes compared with 1,000 nm PS particles, but without causing measurable changes in lysosomal permeability. Recent studies indicate that NP toxicity is associated with oxidative stress and inflammation, but underlying mechanisms are not known
in detail.50–52 Among other potential mechanisms,
lyso-somal dysfunction and impairment of autophagy have been
described to be a consequence of NP–cell interactions.53 There
are different possible ways by which NPs can induce these alterations. It was first shown by several studies that since NPs are sequestered in lysosomes they could accumulate in those compartments and induce lysosomal dysfunction by inducing membrane permeability or defects in lysosomal
trafficking.27,29,54 We could show that particles were mainly
localized in vesicles, including lysosomes, but not in other cel-lular compartments such as mitochondria or the cell nucleus.
By applying a quantitative analysis by stereology on transmis-sion electron microscopy, which has a much higher resolu-tion, we showed that the preferred particle localization is in
vesicles.55 Also, it was proposed by Monick et al56 that
lyso-somal overload by particles induces blockade of autophagy flux in alveolar macrophages from smokers, resulting in mito-chondrial dysfunction and cytotoxicity. Moreover, overload-ing lysosomes with indigestible nanomaterials such as gold, was shown to block autophagosome–lysosome fusion and
lysosomal degradation.28 This finding may therefore indicate
that supposedly inert, yet biopersistent nanomaterials such as PS may not cause direct toxicity or cellular effects, but may be of greater concern, as they accumulate in lysosomes where they are not degraded properly and might block other key cellular functions in DC such as antigen degradation.
To further understand possible causes for impaired antigen degradation capacity, we thoroughly investigated potential size-dependent induction of ER stress and expres-sion of pro-inflammatory cytokines by measuring respective mRNA levels of ER stress gene markers GRP78, CHOP, and
spliced XBP1 and the pro-inflammatory markers IL-1β and
IL-6. Neither particle size was found to induce ER stress or expression of pro-inflammatory cytokine mRNA. As a major indicator of ER stress, GRP78 (78 kDa glucose-regulated protein, also called BiP) is an ER chaperone protein hold-ing stress-senshold-ing proteins in an inactivate state in normal
conditions.57 Upon ER stress, IRE1, a transmembrane protein,
mediates the removal and thus splicing of an intron from XBP1 (x-box binding protein 1) mRNA. This spliced form of XBP1 is then an effective transcription factor that trans-locates to the nucleus for transcription of various genes such as GRP78. As previously reported, in humans, XBP1 is also
required for the transcription of MHCII genes.58,59 CHOP (C/
EBP homologous protein, also called DNA damage-inducible transcript 3) is involved in ER stress–related apoptosis and is upregulated when there is unsuccessful cell recovery. It has been reported in different studies that the three markers for ER stress response we measured are reliable for the detection of ER stress and that these are upregulated following
incuba-tion with silver and poly(lactic-co-glycolic acid) NPs.31,60 We
are not aware of any study investigating ER stress during PS-particle exposure. Therefore, we here report for the first time data suggesting that PS particles of either size did not induce ER stress response, inflammation, and apoptosis, contrary to other NP types.
To our knowledge, the underlying study provided initial evidence in the field that nanosized particles accumulate in lysosomes, affecting key lysosomal functions such as antigen
International Journal of Nanomedicine downloaded from https://www.dovepress.com/ by 118.70.13.36 on 23-Aug-2020