The Effect of SFAS No. 131 on the Diversification
Discount
Seoungpil Ahn
Sogang Business School, Sogang University
PA706, 35 Baekbeom-ro, Mapo-gu, Seoul 121-742, Korea
E-mail: [email protected]
Received: July 2, 2015 Accepted: August 1, 2015 Published: December 1, 2015
doi:10.5296/ajfa.v7i2.7952 URL: http://dx.doi.org/10.5296/ajfa.v7i2.7952
Abstract
For a sample of diversified firms, I investigate the impact of the segment reporting rule change from SFAS No. 14 to SFAS No. 131 in 1997. This change in segment-reporting rules to SFAS No. 131 potentially allows more precise estimation of diversification discount. I probe the changes in the diversification discount before and after the reporting rule change in 1997. I find that there is a substantial increase in the diversification discount under SFAS No. 131. Further analysis indicates that the changes in the diversification discount are unrelated to the changes in firm value or investment efficiency. Instead, the measures of diversity appear to be more associated with the changes in excess value. This indicates that excess value is not a clean measure of diversification discount.
1. Introduction
The issue of corporate diversification on value remains controversial and is yet not well understood despite numerous written reports. A part of the reason for the observed discount in diversified firms attributed to the errors in segment report. Graham, Lemmon, and Wolf (2002), Villalonga (2004), and Whited (2001) addresses several concerns in measuring diversification discount with COMPUSTAT segment reportings based on industrial segments under SFAS No. 14. In June 1997, the Financial Accounting Standards Board (FASB) issued Statement of Financial Accounting Standards (SFAS) No. 131, Disclosure about Segments of an Enterprise and Related Information, which became effective for fiscal years starting after December 31, 1997. SFAS No. 131 requires enterprises to cover data about operating segments, products and services, the geographic regions in which they work, and their major customers. This new rule replaces SFAS No. 14 that requires firms to disclose a geographical analysis of foreign operations to the extent that foreign operations account for more than 10% of total operations. It is significant to mention that the FASB has given management wide latitude for interpretation of the distinction between domestic and foreign operations. Likewise, there is no consistent manner of reporting the countries of foreign sales. Some firms report their foreign sales for regional groups such as Europe, Asia, or South America, while others report for specific countries such as Japan, Germany, or the U.K. Under SFAS No. 131, segment reporting is more consistent with the organizational structure of the firm and provides more detailed information about geographic segments.
This change in segment-reporting rules to SFAS No. 131 may alleviates these concerns inherent in SFAS No. 14 and potentially allows more accurate estimation of diversification discount. I examine the changes in the diversification discount before and after the reporting rule change in 1997. The result shows that there is a significant increase in the diversification discount under SFAS No. 131. Further analysis indicates that the increase in the diversification discount is not driven by the poor firm valuation in the later period, nor it is due to the decrease in the investment efficiency. Rather, the increment in the diversity is associated with the observed alteration in the diversification discount. Given that there is no fundamental changes in firm value and investment efficiency, the result suggests that excess value does not necessarily indicate a value loss due to the diversification per se.
2. Sample selection and estimation of diversification discount
2.1 Sample Selection
firms effectively adopted the new segment rule SFAS 131 in 1998, I use fiscal year end 1998 for the sample.
To avoid any distortion effect of really small companies in calculating the excess value, I exclude firms with sales revenue less than $20 million. I also exclude firms with any segment operating in the financial industry (SIC code 6000-6999), those in other regulated utilities (SIC code 4900-4999) and those that are listed as American Depository Receipts (ADRs). I also removed firms lacking the needed information in calculating Market-to-Sales ratio.
I define diversified firms as those firms reporting at least two segments running in different three-figure, standard industrial classification (SIC) codes. I define focused firms as those firms reporting only one section. I leave out any multiple segment firms reported segments operating in the same three-digit SIC codes.i Therefore, by definition, diversified firms in our sample consist of pure conglomerates operating in unrelated industries. For these diversified firms, I eliminate segments entitled “corporate”, “allocation”, “inter-segment allocation”, and “others”. These segments are non-economic activities representing unallocated amount in segment sales, segment assets and segment operating profits. After elimination of the non-economic segments, I exclude diversified firms in which the sum of segment sales deviates by more than 1% from the total sales of the firm.
Under SFAS No. 141, a firm is required to provide two additional years of back-date on segment information. If the reported segments are converted from the original data year, the back-data could be substantially different from the original segment data. Therefore, I used segment data which have source year matched with data year.
2.2 Estimation of diversification discount
The excess value of a diversified firm is defined similar to Lang and Stulz (1994), Rajan, Servaes, and Zingales (2000), and Villalonga (2004). Following Rajan, Servaes, and Zingales (2001), I compute the excess value as the natural log of the Tobin’s q of the firm divided by its imputed q. Tobin’s is proxied by market value to sales ratio. Imputed q is calculated as the sales weighted sum of the ratio of the market value of sales for single-segment firms in the same industry. Specifically, the excess value of the firm is defined as follows:
R SZ
1
Sales Based Excess V alue (EV ) d
ss n
j
j j
M V S
S M V
S S
=
=
×
sum of the ratio of the market value to sales for single-segment firms in the same industry. Thus, (MV/S)ssj is the median market-to-sales ratio of single segment firms in the same industry of j segment. I match each segment of a diversified firm with the industry median value of single segment firms. Industry is defined at the 4-digit SIC level provided that there are at least five single-segment firms in the industry. If there are fewer than five single-segment firms in a 4-digit SIC industry, I define industry at the 3-digit SIC level and then 2-digit SIC level. I winsorize excess values as well as all other final variables at the 1st and 99th percentiles. I also use the excess value calculated according to Berger and Ofek's (1995) sales multiple approach and yield similar results.
This selection process resulted in a final sample of 8,147 firm-year observations and a total of 22,632 segment-year observations. On average, the diversified firms report 2.8 segments with a median of 3.0 segments. Over the entire sample period, diversified firms are trading at a discount: average (median) excess value is -0.0988 (-0.0942).
The purpose of calculating excess value is to provide an unbiased estimate of the value of the conglomerate when the segments operated as if they are independent firms. I make several choices based on previous findings to minimize the possibility of biased statistics. First, I match segments with industry median instead of sales or asset weighted mean. I prefer to use industry median over weighted mean because the median is less subject to the size effect. It is possible that the mean value is driven by large and, presumably, more successful single segment firms resulting in a downward bias in the calculated excess value. In fact, when I use weighted averages instead of median value of focused firms, the resulting excess value is more negative.
Second, the sample of diversified firms confined to conglomerate having segments operating at least two different industries and exclude firms with multiple segments in the same industry at the three-digit SIC level. Third, I prefer to use segment sales instead of segment assets or net income. Segment assets tend to be under-allocated across segments and segment net income is subject to earnings manipulation.
3. SFAS No. 131 and the diversification discount
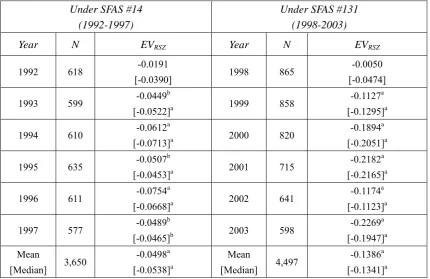
Table 1 reports our measure of excess value in each year from 1992–2003. I confirm a significant diversification discount in the overall period. The excess value of diversified firms continues to be discounted under the new segment reporting standards.
The result suggests that excess value calculated under SFAS No. 14 does correctly capture the discount in diversified firms. The magnitude of the diversification discount is significantly greater after the change in segment reporting standards to SFAS No 131.
Table 1. Excess value of diversified firms over time
Under SFAS #14 (1992-1997)
Under SFAS #131 (1998-2003)
Year N EVRSZ Year N EVRSZ
1992 618 -0.0191
[-0.0390] 1998 865
-0.0050 [-0.0474]
1993 599 -0.0449
b
[-0.0522]a 1999 858
-0.1127a
[-0.1295]a
1994 610 -0.0612
a
[-0.0713]a 2000 820
-0.1894a
[-0.2051]a
1995 635 -0.0507
b
[-0.0453]a 2001 715
-0.2182a
[-0.2165]a
1996 611 -0.0754
a
[-0.0668]a 2002 641
-0.1174a
[-0.1123]a
1997 577 -0.0489
b
[-0.0465]b 2003 598
-0.2269a
[-0.1947]a
Mean
[Median] 3,650
-0.0498a [-0.0538]a Mean [Median] 4,497 -0.1386a [-0.1341]a
The number of diversified firms, excess value of diversified firms each year, and the percentage of discount firms. EVRSZ is the natural log of the ratio of the market value of total capital to sales for the firm divided by that of a sales-weighted portfolio of focused firms operating in the narrowest SIC industry. a,b,c denote significance at the 1%, 5%, and 10% levels, respectively. The sample includes 8,147 firm-year observations of diversified firms between 1992 and 2003. Diversified firms are defined as firms with at least two segments operating in different 3-digit SIC codes.
One possible explanation for the increase in the diversification discount under SFAS No. 131 is that the changes in firms' environment trigger the increase of diversity leading to deeper discount.ii Alternatively, SFAS No. 14 under-identifies segments and the adopting SFAS No. 131 corrects the under-identification problem. To find out these possibilities, I compare changes in firm value in the two stops. I use Market-to-Sales ratio to measure firm valuation.
Table 2. Diversification discount and firm value around segment reporting change
Under SFAS #14 (1992-1997)
Under SFAS #131 (1998-2003)
F [χ2]
MtoS 1.5957
a [1.1661]a 1.8311a [1.2027]a 36.62*** [78.98]***
EVRSZ is the natural log of the ratio of the market value of total capital to sales for the firm divided by that of a
Table 2 indicates that the corresponding change in Market-to-Sales ratio is an increase from 1.6 to 1.8. This suggests that the growth in the diversification discount is not forced by lower valuation of diversified firms in the later period.
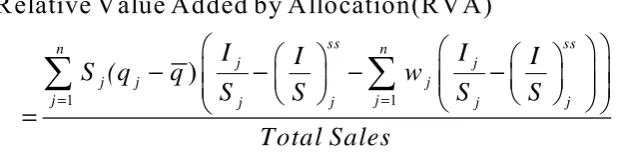
To further analyze whether the change in excess value under SFAS No. 131 is driven by the changes in investment efficiency, I compare investment efficiency in the two periods. I measure investment efficiency with relative value added (RVA). Shin and Stulz (1998) argue that investment efficiency is related to the diversification discount. To compute RVA, I weight firm-and-industry-adjusted segment investment by the difference between the industry median Tobin’s q for that segment and the sales-weighted average q for the firm. More precisely, RVA is defined as follows.
1 1
Relative Value Added by Allocation(RVA)
)
ss ss
n n
j j
j j j
j j j j j j
I I I I
S (q q w
S S S S
Total Sales
= =
− − − −
=
where qj is the median Tobin’s q for single-segment firms operating in the same industry. is sales-weighted average q of the firm. RVA thus measures the allocation efficiency of corporate resources.
In Table 3, RVA is -0.003 on average in the period of 1992-1997 under SFAS No. 14 and it is -0.0055 in the period of 1998-2003 under SFAS No. The difference is statistically not significant. The outcome indicates that there are no substantial changes in investment efficiency in diversified firms in the two stops. Thus, the observed increase in the diversification discount in the two periods is not driven by poor investment efficiency in the later period. This suggests that the observed change in the diversification discount under SFAS No. 131 is not driven by the periodic change in a firm’s fundamental value.
Table 3. Investment Efficiency
Under SFAS #14 (1992-1997)
Under SFAS #131 (1998-2003)
F [χ2]
RVA -0.0030
a
[-0.0003]a
-0.0055a
[-0.0002]a
standard deviation of sales-weighted industry median q normalized by arithmetic average of q. Rajan et al. (2000) argue that if segments themselves cause the distortion of capital allocation, the measures of diversity shall be negatively associated with RVA.
I test the change in diversity measures in the two periods. Previous literature indicates that the diversification discount is related to the measure of diversity in a way that higher diversity of a diversified firm is associated with lower firm value.iii
In table 4, the mean [median] number of segments increases from 2.7 [2.0] to 2.9 [3.0] in the later period. The change is statistically significant at the 1% significance level. Similarly, standard deviation of segment q and the diversity measure of Rajan et al. (2000) show a significant increase in diversity in the later period. Although I could not observe any significant change in Herfindahl index, the overall result from table 4 suggests that diversity has increased in the later period. This indicates that the observed increase in the diversification discount is associated with the increase in the diversity in the later period.
Thus, the diversification discount is increased under SFAS No. 131 due to the increase in the diversity measures. However, the increase in the diversification discount does not reflect the changes in fundamentals in firm value or investment efficiency.
Table 4. Changes in diversity
Under SFAS #14 (1992-1997)
Under SFAS #131 (1998-2003)
F [χ2]
SEGN 2.67
a
[2.00]a
2.86a
[3.00]a
77.71***
[78.97]***
Herfindahl 0.5686
a
[0.5432]a
0.5659a
[0.5334]a
0.50 [1.98] STD of segment q 0.6033
a
[0.3341]a
1.0736a
[0.5156]a
247.28***
[167.57]*** RSZ Diversity 0.3058
a
[0.2605]a
0.3218a
[0.2713]a
9.81***
[7.35]***
SEGN is the number of segments in a diversified firm. Herfindahl is a sales-based Herfindahl index. STD of segment q is the standard deviation of segment Tobin’s q. RSZ Diversity is Rajan et al.’s measure of the diversity of a diversified firm. *, **, *** denote significance at the 1%, 5%, and 10% levels, respectively. The sample includes 8,147 firm-year observations of diversified firms between 1992 and 2003. Diversified firms are defined as firms with at least two segments operating in different 3-digit SIC codes.
4. Conclusion
The results however show that the time-series variation of mean excess value is not reflecting the changes in a firm’s fundamentals. Specifically, the diversification discount is not driven by the changes in firm value nor the decrease in the investment efficiency. The measures of diversity appear to be more associated with the changes in excess value. Because I count not find any evidence that firm value and investment efficiency has changed in the two periods, the observed changes in excess value are more likely to be driven by the number of reported segments, standard deviation of segment q and Rajan et al (2000)’s measure of diversity. This indicates that excess value is not a clean measure of diversification discount.
References
Berger, P., & Ofek E. (1995). Diversification’s effect on firm value, Journal of Financial Economics, 37, 39-65.http://dx.doi.org/10.1016/0304-405X(94)00798-6
Graham, J.R., Lemmon, M.L., & Wolf, J. (2002). Does corporate diversification destroy value?, Journal of Finance, 57, 695-720.http://dx.doi.org/10.1111/1540-6261.00439
Lang, L., & Stulz, R.M. (1994). Tobin’s q, corporate diversification, and firm value, Journal of Political Economy, 102, 1248-80.http://dx.doi.org/10.1086/261970
Rajan, R., Servaes H., & Zingales L. (2000). The cost of diversity: The diversification
discount and inefficient investment, Journal of Finance, 55, 35-80. http://dx.doi.org/10.1111/0022-1082.00200
Shin, H., & Stulz, R. M. (1998). Are internal capital markets efficient? Quarterly Journal of Economics, 113, 531-552.http://dx.doi.org/10.1162/003355398555676
Whited, T.M. (2001). Is it inefficient investment that causes the diversification discount? Journal of Finance, 56, 1667-1692.http://dx.doi.org/10.1111/0022-1082.00385
Copyright Disclaimer
Copyright for this article is retained by the author(s), with first publication rights granted to the journal.
This is an open-access article distributed under the terms and conditions of the Creative Commons Attribution license (http://creativecommons.org/licenses/by/3.0/).
i
Main findings of the paper are not sensitive to this definition. I find qualitatively similar results if industry is
defined at either the two-digit or four-digit SIC level.
ii It is unclear though whether the deeper discount represents mistakes made by diversified firms, simply the
result of acquisition of already discounted units, or self-selection.