Heartbeat Abnormality Detection using Machine
Learning Models and Rate Variability (HRV) Data
Pratik Vyas
CIS department Northumbria UniversityNewcastle upon Tyne, United Kingdom
Diptangshu Pandit, Li Zhang
Computer Intelligence GroupNorthumbria University Newcastle upon Tyne,
United Kingdom
Abstract—The use of machine learning techniques in predictive health care is on the rise with minimal data used for training machine-learning models to derive high accuracy predictions. In this paper, we propose such a system, which utilizes Heart Rate Variability (HRV) as features for training machine learning models. This paper further benchmarks the usefulness of HRV as features calculated from basic heart-rate data using a window shifting method. The benchmarking has been conducted using different machine-learning classifiers such as artificial neural network, decision tree, k-nearest neighbour and naive bays classifier. Empirical results using MIT-BIH Arrhythmia database shows that the proposed system can be used for highly efficient predictability of abnormality in heartbeat data series.
Keywords— Heart rate variability, machine learning, abnormality detection, window shifting, high accuracy prediction.
I. INTRODUCTION
Machine learning has seen rising applications in the recent years because of its predictive ability with increasing awareness regarding heart related problems is fetching motivation for better assessment techniques to aid early indicators or even pre-emptive monitoring methods [1]. However, the problem with most methods in diagnosis is the need for detailed information on the functioning of the heart. For example, Electrocardiograph (ECG) provides detailed information. ECG analysis is very widely explored area and various methods have been proposed for ECG analysis [2]. In previous works we have explored light weight ECG analysis and abnormality detection [3–6].
However, it is difficult to get accurate ECG data in non-clinical circumstances without proper devices [7]. Thus, there is a need for techniques that utilise less detailed information on heart to make early predictions in abnormality detection using machine learning.
Many portable devices like smart watches today provide simple heart rate data [8]. Such data may not be as detailed as needed for proper diagnosis nonetheless can be used effectively for early predictions. Heart rate variability (HRV) is gaining momentum because different HRV measurements utilise the simple heart rate (R-R response) data and can indicate signs of physiological stress as well as can be used to analyse response of the sympathetic nervous system to stress [9]. This paper proposes a system which uses simple heart rate data to calculate time series HRV measurements as features for training machine learning model that could be used for abnormal heart beat detection. This paper further analyses the proposed model for optimum way of calculating HRV measurements used for the proposed system and analyses suitable supervised classification models [10] that could support such a system.
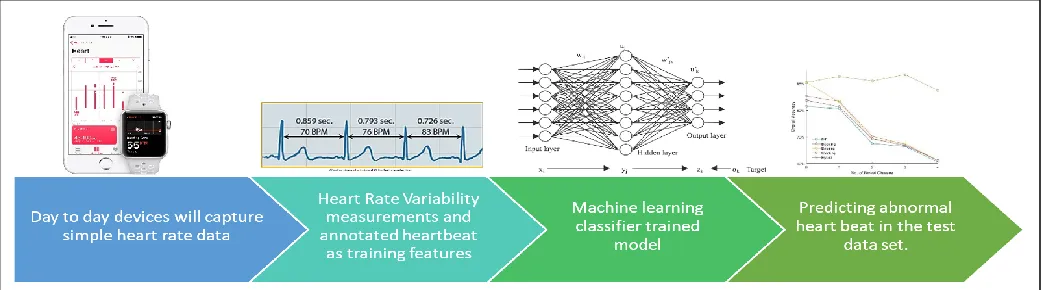
The proposed model is shown in figure 1 below. The first step is gaining simple heart beat data using day to day devices such as fit bits, smart watches etc. Such data is usually cleaned for noise by the device collecting the data, using techniques such as band pass. Thus, noise reduction is not a concern of this system. Different HRV measurements in time series can be calculated using the data. The HRV measurements can then be used in training a machine learning classifier. The model created from training the classifier will be useful in predicting the
Figure 1: Proposed model for using machine learning for abnormal heart beat detection using time series HRV as training features
abnormal heart beats that could indicate early signs of cardiac problems. Such information could be communicated to the user. The research focuses on finding an optimal way to calculate different HRV measurements designed for the system and identifying the most suitable machine learning classifier that can support the proposed system for high accuracy in abnormal heart beat detection.
II. METHODOLOGY
A. Feature Creation
HRV measurements as defined by the Task Force of the European Society of Cardiology (1996) provides universal guidelines for research and calculation in time and frequency domain. The protocols and measurements have since remained same and HRV calculated in time domain is considered a strong indicator of cardiac activity and the measurements are independent of other factors used for predicting arrhythmic events e.g. left ventricular ejection fraction (p. 368). Therefore, the time domain calculations of HRV have been considered appropriate for the proposed system for abnormal heart beat detection.
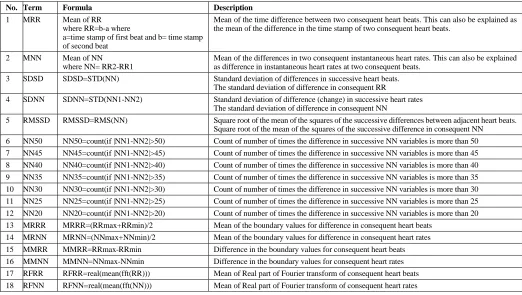
The calculation of HRV in time domain uses small portions of data for a pre-determined window of time and a window shifting method to acquire time-dependent slices of the data [11][12]. This means that HRV measurements are done for short window of time as shown in figure 2. Based on the recommendation of the Task Force of the European Society of Cardiology (1996) (p. 357) fixed window size is used to calculate the different HRV measurements during an experiment. However, the size of window can be changed to perform a number of experiments and the results can be used to
determine the most optimum window size. Further, the window is shifted with a small time-gap, which is required when dealing with real-time data. Experiments can be performed with different time-gap for window shifting to assess which window shifting time-gap provides the most optimum results. Thus, feature generation using HRV measurement technique needs to be optimised using experimentation designed to determine the most optimum window size and window shifting technique that suites the system.
The HRV measurements are based on the instantaneous heart rate which is the speed of beats ( denoted here as RR), and the difference between two consequent instantaneous heart rates (denoted here as NN) [13]. The HRV measures that can be used as training features for machine learning model include mean values for all heart rates, the mean of differences between consequent heart rates, different time series HRV calculations such as Standard deviation of successive differences (SDSD), Standard deviation of difference (change) in successive heart
Table 1: Time series HRV measures as training features
No. Term Formula Description
1 MRR Mean of RR where RR=b-a where
a=time stamp of first beat and b= time stamp of second beat
Mean of the time difference between two consequent heart beats. This can also be explained as the mean of the difference in the time stamp of two consequent heart beats.
2 MNN Mean of NN where NN= RR2-RR1
Mean of the differences in two consequent instantaneous heart rates. This can also be explained as difference in instantaneous heart rates at two consequent beats.
3 SDSD SDSD=STD(NN) Standard deviation of differences in successive heart beats. The standard deviation of difference in consequent RR
4 SDNN SDNN=STD(NN1-NN2) Standard deviation of difference (change) in successive heart rates The standard deviation of difference in consequent NN
5 RMSSD RMSSD=RMS(NN) Square root of the mean of the squares of the successive differences between adjacent heart beats. Square root of the mean of the squares of the successive difference in consequent NN
6 NN50 NN50=count(if |NN1-NN2|>50) Count of number of times the difference in successive NN variables is more than 50 7 NN45 NN45=count(if |NN1-NN2|>45) Count of number of times the difference in successive NN variables is more than 45 8 NN40 NN40=count(if |NN1-NN2|>40) Count of number of times the difference in successive NN variables is more than 40 9 NN35 NN35=count(if |NN1-NN2|>35) Count of number of times the difference in successive NN variables is more than 35 10 NN30 NN30=count(if |NN1-NN2|>30) Count of number of times the difference in successive NN variables is more than 30 11 NN25 NN25=count(if |NN1-NN2|>25) Count of number of times the difference in successive NN variables is more than 25
12 NN20 NN20=count(if |NN1-NN2|>20) Count of number of times the difference in successive NN variables is more than 20 13 MRRR MRRR=(RRmax+RRmin)/2 Mean of the boundary values for difference in consequent heart beats
14 MRNN MRNN=(NNmax+NNmin)/2 Mean of the boundary values for difference in consequent heart rates 15 MMRR MMRR=RRmax-RRmin Difference in the boundary values for consequent heart beats 16 MMNN MMNN=NNmax-NNmin Difference in the boundary values for consequent heart rates 17 RFRR RFRR=real(mean(fft(RR))) Mean of Real part of Fourier transform of consequent heart beats 18 RFNN RFNN=real(mean(fft(NN))) Mean of Real part of Fourier transform of consequent heart rates
rates (SDNN), Root mean square of successive differences in heart beat (RMSSD), difference in successive heart beats higher than a particular value (NN50), Mean of boundary values of difference in consequent heart beats (MRRR), Mean of boundary values of difference in consequent heart rates (MRNN), Mean of Real part of Fourier transform of consequent heart beats (RFRR) and Mean of Real part of Fourier transform of consequent heart rates (RFNN). These are described further in table 1. The reason for selecting these as training features is based in the facts that HRV measurements in time series described in table 1 are considered strong indicator of cardiac activity [11], are independent of each other but closely correlate with each other, which will help in training the machine learning classifier to create a robust model.
B. Database
MIT-BIH Arrhythmia database has heartbeat data from 47 individuals which has been annotated with abnormal heart beats by two medical professionals separately (Moody and Mark, 2001). Table 2 below outlines annotations in MIT-BIH database for the heart beats that have been used as level. These include normal heart beats (denoted as N), atrial premature beat (denoted as A), left bundle branch block beat (denoted as L), right bundle branch block beat (denote as R), premature ventricular contraction (denote as V) and paced beat (denoted by /). There are many other annotations available in the database, but the above abnormalities were selected because of the high number of occurrences in the data which is an important factor while training machine learning classifiers.
Table 2: The types of heart beats targeted for prediction in this study.
Annotation Description
N Normal beat
A Atrial premature beat
L Left bundle branch block beat
R Right bundle branch block beat
V premature ventricular contraction
/ paced beat
C. Abnormality detection
It is important that abnormality detection is done with high accuracy. Therefore, it is not only important to select optimum features as input but also recognize appropriate machine learning classifier that could suit the proposed system. Input for training machine learning classifier and level of abnormal heartbeat detection are set out in earlier sections. The classifiers that are selected during this study are artificial neural network (ANN), decision tree (DT), k-nearest neighbours (KNN) and naive Bayes classifier. These are selected because of their generalization ability and robustness for dealing with any unseen test data. They have great capability of adjusting to large variations of input samples for classification which fits the requirement of this research very well. From a computational complexity perspective, such classifiers could operate in low resource device such as smart phones [14].
D. ExperimentalSetup
As explained earlier, the experimental setup is firstly explained for feature optimisation and then explained for selecting classifier that suits the proposed system. Firstly, different window sizes are used to calculate the features (time series HRV measure) that can be used to train machine learning classifier and determine the accuracy of abnormality detection. The accuracy of abnormality detection will help to determine the optimum window size that should be used in the proposed system. For this experiment, the window shifting size of 4 seconds is initially selected so as to create large training data set while maintaining the real time flow. The experiment helps to identify optimum window size for the given data which can be used for feature creation. The next concern is to determine what is the optimum window shift time-gap which should be applied. To conduct this experiment, the window size is fixed to the optimum value determined from earlier experiment and the window shifting time-gap is increased incrementally. The
maximum window shift is kept below the window size to avoid disjointed data sets which will not be suitable for real time data. The experimentation pseudocode for both the experiments is as follows:
Step 1. Fix window size and window shifting time gap.
Step 2. Calculating the different HRV measurements in the data sets to create training set.
Step 3. Train the machine learning classifier and calculate the accuracy of abnormal heart beat detection at different levels.
Step 4. Increase window size for first experiment and increase window shift time gap for second experiment and then repeat from the first step.
Step 5. Plot the results to compare the accuracy of the abnormal heart beat detected by the trained model.
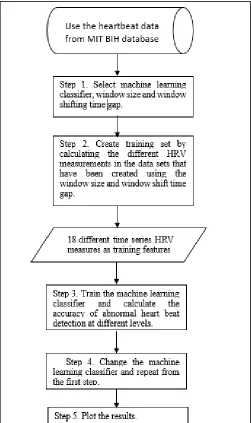
Once the optimum window size and window shifting time gaps have been identified, the experiment is performed on different machine learning classifiers to determine the accuracy in abnormal heart beat detection at different levels. During the experiment, ten-fold cross validation has been applied, which means original sample is randomly partitioned into 10 equal sized subsamples where one of the subsample is randomly retained as the validation data for testing the model and the remaining 9 subsamples are used as training data. The cross-validation process is then repeated 10 times (the folds), with each of the 10 subsamples used exactly once as the validation data. The 10 results from the folds can then be averaged to produce a single estimation. The advantage of this method over other methods such as repeated random sub-sampling is that all observations are used for both training and validation, and each observation is used for validation exactly once. 10-fold cross-validation is also commonly called k-fold cross-validation where k remains an unfixed parameter. The experimentation pseudo-code is as follows:
Step 1. Select optimum window size and window shifting method to create dataset
Step 2. Create training set by calculating the different HRV measurements in the data sets.
Step 3. Train the machine learning classifier and calculate the accuracy of abnormal heart beat detection at different levels.
Step 4. Change the machine learning classifier and repeat from the first step.
Step 5. Calculate Sensitivity and Positive Predictivity.
The sensitivity and positive predictivity are calculated using true positive, true negative and false positive (explained later).
Such results are plotted to recognize the classifier which provides most accuracy for abnormal heartbeat detection. The flow chart for the experiment is shown below:
III. EXPERIMENTAL RESULTS
A. Optimum window size
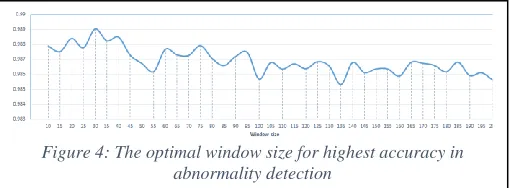
The experiment with window size showed that different window size was useful to predict different level of abnormal heart beat. The optimum window size to gain high accuracy with all heartbeat abnormalities was determined using average of all results. The results as shown in figure 4 below graphically demonstrate that 30 second window is most optimum size to gain highest accuracy for abnormal heartbeat detection using the proposed system.
B. Optimum window shift time gap
The experiment with window shift time gap was conducted with window size fixed at 30 seconds. The experiment showed that different time gaps in window shift did not lead to any improvement after 4 seconds and, as shown in the graph below, the performance deteriorated with regard to accuracy in detection some types of abnormalities as the window shift time gap increased. Thus, the optimum time gap in window shift to gain high accuracy with all heartbeat abnormalities was determined to be 4 second.
C. Performance Metrices
The findings from heartbeat abnormality detection using machine learning classifiers are referred to as True Positive (TP), False Positive (FP) and False Negative (FN) and True Negative (TN). True positive represents the total number of heartbeat abnormalities that are truly identified, while false positive represents the total number of heartbeat abnormalities that are incorrectly identified by the model. False negative represents the total number of heartbeat abnormalities that are not identified at all. These findings are used to calculate the outcomes for the evaluation of heartbeat abnormalities detection by the different machine learning classifiers which are Sensitivity (SN), Positive Predictivity (PP) and Overall Accuracy (OA). Equations below show the calculation for SN, Figure 4: The optimal window size for highest accuracy in
abnormality detection
PP and OA. We have presented OA in the graphical representation of outcomes in figure 6.
% 100 + =
FN TP
TP SN
% 100 + =
FP TP
TP PP
FN FP TN TP
TN TP OA
+ + +
+ =
D. Accuracy comparison
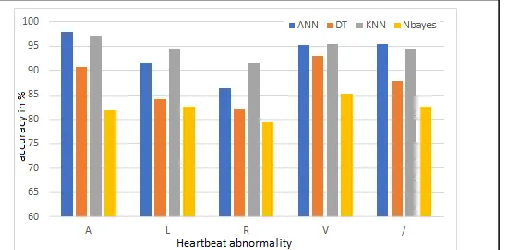
After calculating the performance matrices, the overall accuracy of the different algorithms was calculated for different abnormalities, which is shown in Table 3. The following graphical representation presented in figure 6 provides visual comparison for the overall accuracy of the different algorithms on the most optimum window size and shifting window leading to accurate prediction for a particular level of abnormality.
As seen in the graph above, the NBayes classifier could not provide high level of accuracy for all the abnormalities as compared to other classifiers. The Decision Tree classifier also provided lower accuracy in detection of different levels of abnormalities when compared to KNN and Artificial Neural Network classifiers. KNN had higher accuracy in predicting abnormalities of the type Left bundle branch block beat (L), Right bundle branch block beat (R) and premature ventricular contraction (V), while Artificial Neural Network had higher accuracy in predicting abnormalities of type Atrial premature beat (A) and paced beat (/). The following graph shows the aggregate average of the accuracy of each machine learning classifier. It can be seen that higher accuracy (94.54%) can be achieved using the KNN classifier in the proposed system.
Thus, this paper has proposed and evaluated optimum system to predict abnormal heart beat from data with low level of information. The system relies on prediction in real time data
which is achieved by using window shifting method. By selecting a well-researched window size and time gap for window shift the optimum way for feature creation has been described. It should be noted that the findings relating to feature creation were bound in data and that the method is available to validate the replicability of the findings. Further, the higher level of abstraction of information is achieved by calculating different time series HRV measures. The paper explains these measures in as much detail as possible and provides reference for further information about them. The proposition of this paper was that the time series HRV measures could be valuable input features to machine learning classifier and the experimentation shows the results with high accuracy (more than 90%). The data shows that the proposed system can provide accuracy as high as 94.54% in predicting abnormal heart beats when data with low level information in used to calculate different time series HRV measures as training features for KNN classifier. The accuracy of the system proposed in this paper is high but can be improved with further research the limitations caused when using data with low level of information such as noise reduction, larger data set, individualised algorithm etc.
IV. CONCLUSION
A system is proposed in this paper which uses heartbeat data and converts it to different time series HRV measures that act as features for machine learning classifier. Experimentation on the proposed system lead to following conclusions:
1. Time series HRV measures can act as predictive feature in machine learning for abnormality detection. This conclusion is since HRV measures as features for different machine learning classifiers resulted in accurate abnormality detection.
Table 3: Summary of results
ANN
DT
KNN
NB
Type
SN
PP
OA
SN
PP
OA
SN
PP
OA
SN
PP
OA
A
97.92 96.56 97.92 93.77 79.86 90.69
95.62
94.99
97.07
60.7
76.15 81.84
L
91.47 93.77 91.47 99.14 83.68 84.11
95.82
97
94.38
96.52 83.76 82.54
R
86.28 87.46 86.28 99.86 80.62 81.96
94.26
94.32
91.47
93.26 81.65 79.30
V
95.17 94.64 95.17 91.38
94.5
93.03
95.2
95.81
95.52
89.66 82.51 85.33
/
95.47 97.92 95.47 85.56 98.71 87.85
95.42
97.15
94.24
83.32
93.6
82.52
Figure 6: Accuracy comparison for various abnormalities
2. Evaluating optimal window size and shifting window during 10-fold cross validation for training and evaluation of real time data increases accuracy of the proposed model.
3. Empirical comparison of performance of different machine learning algorithms in terms of accuracy using same set of features helps in using the machine learning classifier for the given levels of abnormality detection.
4. The proposed system is light weight because it uses time series computation of HRV measures which require low computational power. Thus, such a system could be used in portable devices for early prediction of abnormal heart beats.
Limitations: The proposed system has been verified for only a few types of abnormalities which were available in the data from MIT-BIH database. There is urgent need to utilise data from other databases which can help in detection of different abnormal heartbeats. The conclusions for the proposed system to use k-nearest neighbour classifier is based on experiments with the data from MIT-BIH database and this should be verified when conducting further experimentation. The accuracy of abnormal heartbeat detection has been the focus of the current research but it is important to use feature selection techniques, feature extraction techniques and feature reduction techniques as well as to study the effect of such techniques on the accuracy of machine learning model within the proposed system. The system proposed in this paper is novel and therefore is not eligible for application in real life. Thus, there needs to be further research to determine criteria for the proposed system to become useful in the real world, such as the processing capability of devices, quality of data being used, pre-processing techniques, post-prediction feedback to user etc.
V. REFERENCES
[1] R. Nelson, N. Staggers, Health informatics : an interprofessional approach, n.d.
[2] S. Kaplan Berkaya, A.K. Uysal, E. Sora Gunal, S. Ergin, S. Gunal, M.B. Gulmezoglu, A survey on ECG analysis, Biomedical Signal Processing and Control. 43 (2018) 216–235. doi:10.1016/J.BSPC.2018.03.003. [3] D. Pandit, L. Zhang, C. Liu, S. Chattopadhyay, N.
Aslam, C.P. Lim, A lightweight QRS detector for single lead ECG signals using a max-min difference algorithm, Computer Methods and Programs in
Biomedicine. (2017).
doi:10.1016/j.cmpb.2017.02.028.
[4] D. Pandit, L. Zhang, C. Liu, N. Aslam, S. Chattopadhyay, C.P. Lim, Noise Reduction in ECG Signals Using Wavelet Transform and Dynamic Thresholding, in: 2017: pp. 193–206. doi:10.1007/978-981-10-3957-7_10.
[5] D. Pandit, L. Zhang, N. Aslam, C. Liu, S. Chattopadhyay, Improved abnormality detection from raw ECG signals using feature enhancement, in: 2016 12th International Conference on Natural Computation, Fuzzy Systems and Knowledge Discovery, ICNC-FSKD 2016, IEEE, 2016: pp. 1402–1406. doi:10.1109/FSKD.2016.7603383.
[6] D. Pandit, L. Zhang, C. Liu, N. Aslam, S. Chattopadhyay, C.P. Lim, Noise Reduction in ECG Signals using Wavelet Transform and Dynamic Thresholding, (n.d.).
[7] M.M. Baig, H. GholamHosseini, A.A. Moqeem, F. Mirza, M. Lindén, A Systematic Review of Wearable Patient Monitoring Systems – Current Challenges and Opportunities for Clinical Adoption, Journal of Medical Systems. 41 (2017) 115. doi:10.1007/s10916-017-0760-1.
[8] B. Reeder, A. David, Health at hand: A systematic review of smart watch uses for health and wellness, Journal of Biomedical Informatics. 63 (2016) 269–276. doi:10.1016/J.JBI.2016.09.001.
[9] H.-G. Kim, E.-J. Cheon, D.-S. Bai, Y.H. Lee, B.-H. Koo, Stress and Heart Rate Variability: A Meta-Analysis and Review of the Literature, Psychiatry
Investigation. 15 (2018) 235–245.
doi:10.30773/pi.2017.08.17.
[10] S.B. Kotsiantis, Supervised Machine Learning: A Review of Classification Techniques, Informatica. 31 (2007) 249–268.
[11] H.R. Variability, Standards of measurement, physiological interpretation, and clinical use. Task Force of the European Society of Cardiology and the North American Society of Pacing and Electrophysiology, Circulation. 93 (1996) 1043–1065. [12] J.F. Thayer, F. Åhs, M. Fredrikson, J.J. Sollers, T.D.
Wager, A meta-analysis of heart rate variability and neuroimaging studies: Implications for heart rate variability as a marker of stress and health, Neuroscience & Biobehavioral Reviews. 36 (2012) 747–756. doi:10.1016/J.NEUBIOREV.2011.11.009. [13] F. Shaffer, J.P. Ginsberg, An Overview of Heart Rate
Variability Metrics and Norms, Frontiers in Public Health. 5 (2017). doi:10.3389/fpubh.2017.00258. [14] T.K. Tin Kam Ho, M. Basu, Complexity measures of
supervised classification problems, IEEE Transactions on Pattern Analysis and Machine Intelligence. 24 (2002) 289–300. doi:10.1109/34.990132.