Collective Sentiment Classification
based on User Leniency and Product Popularity
WenliangGao∗,NaokiYoshinaga†,NobuhiroKaji†andMasaruKitsuregawa†‡ ∗GraduateSchoolofInformationScienceandTechnology,TheUniversityofTokyo
†InstituteofIndustrialScience,TheUniversityofTokyo
‡
NationalInstituteofInformatics
{wl-gao, ynaga, kaji, kitsure}@tkl.iis.u-tokyo.ac.jp
Abstract
We propose a method of collective senti-ment classification that assumes dependen-cies among labels of an input set of reviews. The key observation behind our method is that the distribution of polarity labels over reviews written by each user or written on each product is often skewed in the real world; intolerant users tend to report com-plaints while popular products are likely to receive praise. We encode these char-acteristics of users and products (referred to as user leniency and product popular-ity) by introducing global features in su-pervised learning. To resolve dependencies among labels of a given set of reviews, we explore two approximated decoding algo-rithms, “easiest-first decoding” and “two-stage decoding”. Experimental results on two real-world datasets with product and user/product information confirmed that our method contributed greatly to the classifica-tion accuracy.
1 Introduction
In document-level sentiment classification, early studies have exploited language-based clues (e.g., n-grams) extracted from the textual content (Tur-ney, 2002; Pang et al., 2002), followed by recent studies which adapt the classifier to the reviews written by a specific user or written on a specific product (Tan et al., 2011; Seroussi et al., 2010; Speriosu et al., 2011; Li et al., 2011). Although the user- and product-aware methods exhibited bet-ter performance over the methods based on purely textual clues, most of them use only the user in-formation (Tan et al., 2011; Seroussi et al., 2010; Speriosu et al., 2011), or they assume that the user and the product of a test review is known in ad-vance (Li et al., 2011). These assumptions
heav-ily limit their applicability in a real-world scenario where new users and new products are ceaselessly emerging.
This paper proposes a method of collective sen-timent classification that is aware of the user and the product of the target review, which benefits from the skewed distributions of polarity labels: intolerant users tend to report complaints while popular products are likely to receive praise. We introduce global features to encode these charac-teristics of a user and a product (referred to as user leniency and product popularity), and then com-pute the values of global features along with test-ing. Our method is therefore applicable to reviews written by users and on products that are not ob-served in the training data.
Because global features depend on labels of test reviews while the labels reversely depend on the global features, we need to globally optimize a la-bel configuration for a given set of reviews. In this study, we resort to approximate algorithms, easiest-first (Tsuruoka and Tsujii, 2005) and two-stage strategies (Krishnan and Manning, 2006), in decoding labels, and empirically compare their speed and accuracy.
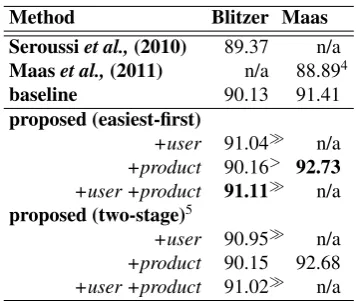
We evaluated our method on two real-world datasets with product (Maas et al., 2011) and user/product information (Blitzer et al., 2007). Experimental results demonstrated that the col-lective sentiment classification significantly im-proved the classification accuracy against the state-of-the-art methods, regardless of the choice of decoding strategy.
The remainder of this paper is organized as fol-lows. Section 2 discusses related work that ex-ploits user and product information in a senti-ment classification task. Then, Section 3 pro-poses a method that collectively classifies polarity of given set of reviews. Section 4 reports
exper-357
(sp) (up) total
No. of reviews 46,397 3,603 50,000
Ave. No. of reviews/product 4.82 1.62 4.22
baseline 91.87 85.51 91.41
proposed (easiest-first) 93.11 (+1.24) 87.73 (+2.22) 92.73 (+1.32) proposed (two-stage) 93.09 (+1.22) 87.48 (+1.97) 92.68 (+1.21)
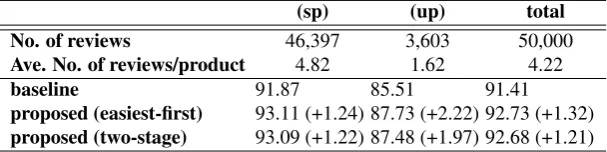
Table 3: Accuracy (%) on known/unknown product splits on Maas dataset. spandup stand forseen productandunseen product. Float inside parenthesizes is the difference compared to the baseline clas-sifier.
(su, sp) (uu, sp) (su, up) (uu, up) total
No. of reviews 35,689 60,775 36,895 55,027 188,350
Ave. No. of reviews/user 2.04 1.04 2.14 1.04 1.40
Ave. No. of reviews/product 1.20 1.39 1.14 1.20 1.43
baseline 89.71 90.45 90.37 89.95 90.13
proposed (easiest-first) 91.42 (+1.71) 90.93 (+0.59) 92.19 (+1.82) 90.76 (+0.81) 91.11 (+0.98) proposed (two-stage) 91.23 (+1.52) 90.88 (+0.54) 92.09 (+1.72) 90.30 (+0.35) 91.02 (+0.89) Table 4: Accuracy (%) on known/unknown user/product splits on Blitzer dataset.su,uu,spandupstand forseen user,unseen user,seen productandunseen productrespectively. Float inside parenthesises is the difference compared to the baseline classifier.
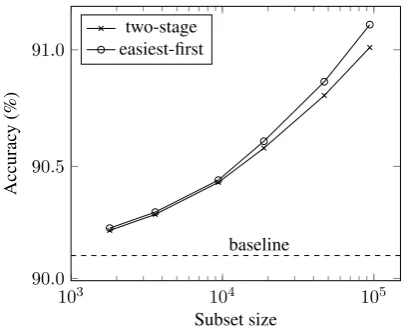
shown in Figure 2, the speed of the easiest-first de-coding significantly slows down as the number of processed reviews grows, whereas the speed of the two-stage decoding increases compute time lin-early. Meanwhile, the accuracy of the two strate-gies are competitive as shown in Figure 1.
These results confirm the analysis in Section 3.4 that the easiest-first decoding takes most of the time in re-computing and sorting the scores. More specifically, if the user has plenty of re-views or the product has been rated by plenty of reviews, the score frequently changes in each it-eration in response to the change of global fea-tures’ values. Based on these observations, when the amount of test data is large, the two-stage de-coding is tremendously faster with only a little loss of accuracy. When the dataset is small, to fully uti-lize the user leniency and product popularity prop-erties, easiest-first decoding should be adopted.
Impact of user/product-awareness: We inves-tigate the performance on the test reviews when we observed the user/product or not in the train-ing data. We use the leniency and popularity global features on the Blitzer dataset, while we consider only product popularity features on the Maas dataset.
The baseline classifier is expected to better esti-mate the labels of reviews written by known user
or written on known product because similar n -grams would be contained in the training. On the other hand, in our model’s setting, more reviews per user (or per product) should lead to more re-liable leniency (or popularity) features thus better accuracy.
On the Maas dataset as shown in Table 3, the improvement on unknown product set is larger than that on known product set. We have to note here that the improvement on the unknown prod-uct set is greater while the review number for each product is smaller, which seems to violate our as-sumption. The reason is that baseline on the un-known product set performed poorly, which left our method larger space for improvement, even without enough global features.
On the Blitzer dataset as shown in Table 4, im-provement is higher on known user sets. We find that average review number for each user is ex-tremely low (1.04 reviews). Then lacking reliable global features may be the main reason for the poor performance on unknown user sets. We next investigate how many reviews are needed to com-pute reliable global features.
No. of product-related neighbors (|Np(r)|)
0 1 2
3-No.
of
user
-r
elated
neighbors
(
|N
u
(
r
)
|
) 0 90.11 (+0.03)55,043 90.13 (+0.26)34,735 90.80 (+0.53)16,601 92.48 (+0.58)9,630
1 10,768 6,530 2,974 1,536
91.18 (+1.37) 91.24 (+2.11) 91.32 (+1.17) 92.12 (+1.04)
2 4,595 2,711 1,292 663
91.28 (+1.55) 91.26(+2.66) 90.56 (+1.71) 92.14 (+2.36)
3-7 8,120 4,974 2,174 998
92.48 (+2.33) 91.19 (+2.27) 92.18 (+3.31) 90.18 (+1.50)
8- 13,243 7,484 3,017 1,289
93.73(+2.2) 92.28 (+1.74) 91.28 (+1.52) 90.22 (+1.62)
Table 5: Accuracy (%, downer inside cell) of proposed method (two-stage) and review size (upper inside cell) on Blitzer dataset separated according to the number of reviews written by the user and the number of reviews on the product.The float inside parenthesizes is the difference from the baseline method.
No. of product-related neighbors (|Np(r)|)
0 1 2-5 6-10
11-3,597 4,646 14,394 10,444 16,919
86.41 (+0.42) 90.94 (+1.96) 92.59 (+1.75) 93.98 (+1.31) 93.78 (+0.83)
Table 6: Accuracy (%, downer inside cell) of proposed method (two-stage) and the review size (upper inside cell) on Blitzer dataset separated according to the number of reviews on the product. The float inside parenthesizes is the difference from the baseline method.
each user or product has. More reviews means that more reliable global features will be extracted by our model.
Since user leniency is the dominant influential global feature on the Blitzer dataset, Table 5 shows the leniency features is related to the improve-ment. Product popularity has limited influence on this dataset because it is collected according to users. On the Maas dataset, popularity features play an important role as shown in Table 6.
We noticed that when the review number of a user or a product reaches some point (|Nu(r)| = 3−7in the Blitzer dataset and|Np(r)| = 2−5 in the Maas dataset), having more reviews does not improve the accuracy any further. However, higher|Nu(r)|or|Np(r)|number induces lower speed of easiest-first decoding as we analyzed in Section 3.4. Then, we could collect a bounded number of reviews for each user or product to cost less time and acquire better accuracy.
Examples: Some examples are given here to ex-plain how our model would work. As shown in Table 7, it is sometimes hard to correctly classify labels when only the text is given.
In the first two examples, weak negative textual features are found in the test instance. However,
since the two users are lenient and the first prod-uct is relatively popular (these characteristics are captured by our proposed method), these two re-views should still be given positive labels.
Frequently, sentiment expressed inside a review is not obvious if the classifier does not know the latent meaning of the words (sometimes, even real person feels hard to extract sentiment from these words). As we can see in the third example in Table 7, the baseline classifier could recognize no obvious sentiment evidence from the textual fea-tures, while our method classified it as negative by detecting that its on a notorious product and the user is critical.
These examples illustrate that our model can successfully use the user and product-based de-pendencies to improve sentiment classification ac-curacy. Nowadays, in the big data background, this method could be more useful with huge amount of unlabeled data.
5 Conclusion
leniency popularity content labels
golden baseline proposed
f+
u: 0.92 fp+: 0.67 ... The book would deserve 5 stars is the author had compared sev- +1 -1 +1
fu−: 0.08 fp−: 0.33 eral popular jurisdictionsinstead offocusing solely on Nevada f+
u: 0.81 fp+: 0.50 ... I am using Windows XP with office Pro 2003 and today was
dis-+1 -1 +1
fu−: 0.19 fp−: 0.50 appointed tofind that the Help menu is not as user friendly or
help-fulas earlier editions
fu+: 0.18 fp+: 0.00 ooo! see Halle act. act, halle, act. emote. emote. see halle act drunk.
-1 +1 -1
fu−: 0.82 fp−: 1.00 see halle act crying. see halle act nympho. ... but what does it matter, since we get to see halle act ...
Table 7: Examples show the influence of leniency and popularity global features. Theboldcontent is the negative evidence learned by classifier.
the review, our model does not assume the train-ing data to contain the reviews written by the same user of test reviews or written on the same product of test reviews. To decode a labels configuration for a given set of reviews, we adopted and com-pared two strategies, namely “easiest-first decod-ing” and “two-stage decoddecod-ing”.
We conducted experiments on two real-world review datasets to compare our method with the existing methods. The proposed method per-formed more accurately than the baseline methods that uses word n-gram as features. It also out-performs another state-of-the-art method which trains personalized sentiment classifiers signifi-cantly. The more reviews per-user/product pos-sesses, the larger improvement our model would gain. Two-stage strategy gains less accuracy than easiest-first, however, consumes only linear time in terms of the test review size (expected to be the same order of speed as the baseline classifiers). We plan to publish the code and datasets7.
A future extension of this work is to use this on other task, such as classifying the subjectivity of a given document. We also plan to use dual decomposition as an advanced decoding strategy on our model.
References
John Blitzer, Mark Dredze, and Fernando Pereira. 2007. Biographies, bollywood, boom-boxes and blenders: Domain adaptation for sentiment classi-fication. In Proceedings of ACL, pages 440–447, Prague, Czech Republic.
Mark Dredze, Koby Crammer, and Fernando Pereira.
7http://www.tkl.iis.u-tokyo.ac.jp/~wl-gao/
2008. Confidence-weighted linear classification. InProceedings of ICML, pages 264–271, Helsinki, Finland.
Wenliang Gao, Naoki Yoshinaga, Nobuhiro Kaji, and Masaru Kitsuregawa. 2013. Modeling user leniency and product popularity for sentiment classification. In Proceedings of IJCNLP, Nagoya, Japan. to ap-pear.
Vijay Krishnan and Christopher D. Manning. 2006. An effective two-stage model for exploiting non-local dependencies in named entity recognition. In Proceedings of COLING-ACL, pages 1121–1128, Sydney, NSW, Australia.
Shoushan Li, Sophia Y. M. Lee, Ying Chen, Chu-Ren Huang, and Guodong Zhou. 2010. Sentiment clas-sification and polarity shifting. In Proceedings of COLING, pages 635–643, Beijing, China.
Fangtao Li, Nathan Liu, Hongwei Jin, Kai Zhao, Qiang Yang, and Xiaoyan Zhu. 2011. Incorporating re-viewer and product information for review rating prediction. In Proceedings of IJCAI, pages 1820– 1825, Barcelona, Spain.
Andrew L. Maas, Raymond E. Daly, Peter T. Pham, Dan Huang, Andrew Y. Ng, and Christopher Potts. 2011. Learning word vectors for sentiment analysis. In Proceedings of ACL-HLT, pages 142–150, Port-land, Oregon, USA.
Tetsuji Nakagawa, Kentaro Inui, and Sadao Kurohashi. 2010. Dependency tree-based sentiment classifica-tion using crfs with hidden variables. In Proceed-ings of NAACL-HLT, pages 786–794, Los Angeles, CA, USA.
Bo Pang and Lillian Lee. 2004. A sentimental educa-tion: sentiment analysis using subjectivity summa-rization based on minimum cuts. InProceedings of ACL, pages 271–278, Barcelona, Spain.
Bo Pang, Lillian Lee, and Shivakumar Vaithyanathan. 2002. Thumbs up? sentiment classification us-ing machine learnus-ing techniques. InProceedings of EMNLP, pages 79–86, Pennsylvania, PA, USA. Guang Qiu, Bing Liu, Jiajun Bu, and Chun Chen.
2011. Opinion word expansion and target extraction through double propagation. Computational Lin-guistics, 37(1):9–27.
Yanir Seroussi, Ingrid Zukerman, and Fabian Bohnert. 2010. Collaborative inference of sentiments from texts. InProceedings of UMAP, pages 195–206, Big Island, HI, USA.
Richard Socher, Jeffrey Pennington, Eric H. Huang, Andrew Y. Ng, and Christopher D. Manning. 2011. Semi-supervised recursive autoencoders for predict-ing sentiment distributions. In Proceedings of EMNLP, pages 151–161, Edinburgh, Scotland, UK., July.
Michael Speriosu, Nikita Sudan, Sid Upadhyay, and Jason Baldridge. 2011. Twitter polarity classifica-tion with label propagaclassifica-tion over lexical links and the follower graph. In Proceedings of EMNLP, work-shop on Unsupervised Learning in NLP, pages 53– 63, Edinburgh, UK.
Chenhao Tan, Lillian Lee, Jie Tang, Long Jiang, Ming Zhou, and Ping Li. 2011. User-level sentiment anal-ysis incorporating social networks. InProceedings of KDD, pages 1397–1405, San Diego, California, USA.
Yoshimasa Tsuruoka and Jun’ichi Tsujii. 2005. Bidi-rectional inference with the easiest-first strategy for tagging sequence data. In In Proceedings of HLT-EMNLP, pages 467–474, Vancouver, B.C., Canada. Peter D. Turney. 2002. Thumbs up or thumbs down?: