Report No. 507 (60/25.0/1)
M
M
M
o
o
o
r
r
r
b
b
b
i
i
i
d
d
d
i
i
i
t
t
t
y
y
y
,
,
,
H
H
H
e
e
e
a
a
a
l
l
l
t
t
t
h
h
h
C
C
C
a
a
a
r
r
r
e
e
e
a
a
a
n
n
n
d
d
d
t
t
t
h
h
h
e
e
e
C
C
C
o
o
o
n
n
n
d
d
d
i
i
i
t
t
t
i
i
i
o
o
o
n
n
n
o
o
o
f
f
f
t
t
t
h
h
h
e
e
e
A
A
A
g
g
g
e
e
e
d
d
d
N
N
N
S
S
S
S
S
S
6
6
6
0
0
0
t
t
t
h
h
h
r
r
r
o
o
o
u
u
u
n
n
n
d
d
d
(
(
(
J
J
J
a
a
a
n
n
n
u
u
u
a
a
a
r
r
r
y
y
y
–
–
–
J
J
J
u
u
u
n
n
n
e
e
e
2
2
2
0
0
0
0
0
0
4
4
4
)
)
)
Preface
The National Sample Survey Organisation (NSSO) has been collecting information on
various facets of the Indian economy through nationwide sample surveys to assist in
socio-economic planning and policy-making. The National Sample Survey (NSS) made its first attempt
to collect information on morbidity in the 7
thround (October 1953 - March 1954). This maiden
attempt and the subsequent three surveys on the subject from the NSS 11
thto 13
throunds
(1956-58) were exploratory in nature and aimed to evolve an appropriate data collection method for
studying morbidity profile in India. However, a full-scale survey on morbidity was conducted for
the first time during the NSS 28
thround (October 1973 - June 1974). Since then, the NSSO had
not undertaken any separate survey on morbidity and the collection of data on morbidity became
a part of the
decennial surveys on social consumption carried out in the NSS 35
thround (July
1980 - June 1981), 42
ndround (July 1986 - June 1987) and 52
ndround (July 1995 - June 1996).
A survey on ‘Morbidity and Health care’ was undertaken by the NSSO during the NSS
60
thround (January - June 2004) at the request of Ministry of Health and Family Welfare. This
subject was taken up along with the subjects of household consumer expenditure and
employment-unemployment. The present report is based on the enquiry on ‘Morbidity and Health
Care’ conducted during the NSS 60
thround. The enquiry covered the curative aspects of the
general health care system in India, utilization of health care services provided by the public and
private sector and the expenditure incurred by the households for availing these services. In
addition, information on the condition and problems of the aged persons was also collected.
The report consists of five chapters and three appendices. Chapter One deals with the
introduction and Chapter Two with concepts and definitions that have been used in the survey.
Chapters Three, Four and Five discuss the summary results of the survey and their comparison
with the results of the previous surveys. While Chapter Three discusses the survey estimates
relating to Morbidity and Hospitalisation, Chapter Four deals with estimates on Immunisation
and Maternal Health Care. In Chapter Five, the survey results on Conditions and Health Care of
the Aged have been discussed
.
The Survey Design and Research Division of NSSO was responsible for development of
survey methodology as well as drafting of the report. The fieldwork for the survey was handled
by the Field Operations Division of NSSO. While the data processing and tabulation work was
handled by the Data Processing Division of NSSO, the Coordination and Publication Division of
NSSO coordinated various activities pertaining to the survey.
I am thankful to the Chairman and the Members of the Working Group for the NSS 60
thround as well as to the Chairman and the Members of the Governing Council of NSSO for their
overall guidance at various stages of survey work. The report, I hope, will be useful to the
planners and policy makers.
Highlights
Rural Urban
A. Morbidity and health care
Proportion of Ailing Persons by Residence Status & Sex
Number (per 1000) of persons reporting ailment (PAP)
during a period of 15 days Male 83 91
Female 93 108
Person 88 99
Level of Morbidity in broad age-groups
PAP during a period of 15 days in broad age-groups
0-14 72 79
15-29 49 50
30-44 78 79
45-59 119 149
60 or more 283 368
Inter-state Variation in Level of Morbidity
States with relatively high PAP during a period of 15 days
Kerala 255 240
Punjab 136 107
West Bengal 114 157
Maharashtra 93 118
States with relatively low PAP during a period of 15 days
Jharkhand 33 50
Bihar 53 63
Uttaranchal 52 65
Rajasthan 57 72
Commencement of Ailment
Number (per 1000) of persons reporting commencement of any ailment (PPC) during last 15 days in broad age-groups
0-14 54 59 15-29 29 32 30-44 37 38 45-59 46 40 60 or more 68 55 all ages 45 44
Treatment of Ailments
Percentage of spells of ailments treated during 15 days
Highlights
Rural Urban
Sources of Non-hospitalised Treatment
Percentage distribution of non-hospitalised treatments by source of treatment
Govt. sources 22 19
Private sources 78 81
Total 100 100
Hospitalised Treatment
Number (per 1000) of persons hospitalised any time during a period of 365 days
Male 23 31
Female 22 31
Person 23 31
Level of Hospitalisation in broad age-groups
Number (per 1000) of persons hospitalised any time during a period of 365 days in broad age-groups
0-14 12 20
15-29 19 21
30-44 25 29
45-59 39 48
60 or more 56 91
Percentage distribution of hospitalised treatments by type of hospital
Govt. hospitals 42 38
Private hospitals 58 62 all hospitals 100 100
Average duration of stay (0.0 days) by type of hospital
Govt. hospitals 10.9 10.8 Private hospitals 8.3 7.3
Cost of Treatment
Average medical expenditure (Rs.) for non-hospitalised treatment per ailing person during a period of 15 days
Male 275 322
Female 240 291
Person 257 306
Average total expenditure (Rs.) for non-hospitalised treatment per ailing person during a period of 15 days
Medical expenditure:
Govt. sources 11 7
Highlights
Rural Urban Average total expenditure (Rs.) for hospitalised treatment per
hospitalisation case during a period of 365 days
Medical expenditure:
Govt. sources 3,238 3,877 Private sources 7,408 11,553 Other expenditure 530 516 Total 6,225 9,367
B. Immunisation of children aged 0 –4 years
Number (per 1000) of children of age 0 – 4 years receiving any immunisation during a period of 365 days
Boys 893 934
Girls 892 937
Children 892 936
Average expenditure incurred (Rs. 0.0) on immunisation during a period of 365 days
Boys 22.3 109.2
Girls 17.4 118.3 Children 19.9 113.4
C. Pregnancy, Childbirth & Maternity Care
Number (per 1000) of women of age 15 – 49 years pregnant any time during a period of 365 days
127 107
Number (per 1000) of pregnant women of age 15 – 49 years who delivered a child
716 694
Percentage distribution of women who delivered a child during a period of 365 days by place of delivery
Government hospital 183 310 Private hospital 166 429
Home 651 261
Average expenditure per childbirth during a period of 365 days by place of delivery
Government hospital 1,165 994 Private hospital 4,137 5,480
Highlights
Rural Urban
D. Condition of the Aged (60 yrs. or more)
Number (per 1000) of aged in the population
Male 70 62
Female 71 71
Person 70 66
Old-age dependency ratio (aged per 1000 of persons of age 15-59 yrs.)
125 103
Sex-ratio among the aged 985 1046
Percentage distribution of the aged by their living arrangement Living alone 5 4 With spouse 58 58 Children 33 33 Others 4 5 Total 100 100
Percentage of the aged depending on others for day-to-day maintenance
67 64
Category of persons supporting the dependent aged
Spouse 13 15
Own Children 78 76
Grand children 3 3
Others 6 6
Total 100 100
Number (per 1000) of aged persons who cannot move and are confined to bed or home
Male 67 68
Female 88 100
Person 77 84
Contents
Page No.
Chapter One
Introduction
1 – 4
Chapter Two
Concepts and Definitions
5 – 8
Chapter Three
Morbidity and Hospitalisation
9 – 43
Chapter Four
Immunisation and Maternity Health Care
44 – 53
Chapter Five
Condition and Health Care of the Aged
54 – 65
Appendix A
Detailed tables
A-1 – A-380
Appendix B
Coverage, Sample Design and Estimation Procedure
B-1 – B-11
Appendix C
Schedule 25.0: Morbidity and Health Care
C-1 – C-10
Detailed tables
table
no.
title
page no.
Part A1: Morbidity and Hospitalisation
1
Number of villages/blocks, households, persons, aged (60 years and above) persons surveyed,
number of hospitalised and ailing persons surveyed and average household size, separately for
each State/UT
A-1
2
Per 1000 distribution of households by type of structure for (i) each monthly per capita
expenditure (mpce) class, (ii) each social-group and (iii) each household type
A-7
3
Per 1000 distribution of households by major source of drinking water for (i) each mpce class,
(ii) each social group, and (iii) each household type
table
no.
title
page no.
8
Per 1000 distribution of persons by age-group for each sex
A-26
9
Per 1000 distribution of persons of age 5 years and above by general educational level for each
age-group and sex
A-31
19
Number of hospitalisation cases during last 365 days and number of cases among these where
any medical services were provided by the employer by source of treatment for each age-group
A-40
20
Rate of hospitalisation (number per 1,00,000) during last 365 days by sex and broad age-group
A-43
21
Rate of hospitalised persons (number per 1,00,000) during last 365 days by sex and broad
age-group
A-45
22
Per 1000 distribution of hospitalised cases during last 365 days by nature of ailment for
different age-groups and sex
A-47
23
Per 1000 distribution of hospitalisation cases by type of hospital and type of ward for each
mpce class and sex
A-65
24
Per 1000 distribution of hospitalised cases receiving treatment during last 365 days by time
when admitted into hospital and by time when discharged from hospital for each type of
hospital and sex of patient
A-74
25
Per 1000 distribution of hospitalisation cases by duration of stay in hospital and average
duration of stay in hospital (in 0.0 days) for each type of hospital
A-77
26
Per 1000 distribution of hospitalisation cases by duration of stay in hospital and average
duration of stay in hospital separately for government and private hospitals and for each mpce
class
A-80
27
Number per 1000 cases of hospitalisation receiving specific types of medical service and their
break-up by payment category for different types of hospital
A-87
28
Number per 1000 of hospitalisation cases receiving treatment before hospitalisation and per
1000 distribution of such cases by source of treatment availed of for each type of hospital
where admitted and sex
A-92
29
Number per 1000 cases of hospitalisation that received treatment after discharge from hospital
and per 1000 distribution of such cases by source of treatment availed of for each type of
hospital where admitted and sex
A-95
30
Average total medical expenditure (Rs.) for treatment per hospitalisation case during the stay at
hospital (as inpatient) for last 365 days by type of hospital (Govt./Pvt), mpce class and sex
A-98
31
Average expenditure (Rs.) per hospitalisation case on account of hospitalisation for each mpce
class and sex
A-101
32
Average total expenditure on account of hospitalisation per household and per 1000
distribution of total household expenditure on account of hospitalisation by source of finance
for each mpce class
A-106
table
no.
title
page no.
35
Number per 1000 of persons reporting ailment during the last 15 days by sex and age-group for
each State/UT
A-127
36
Number per 1000 of persons reporting ailment during the last 15 days by mpce class and social
group for each sex and State/UT
A-133
37
Number per 1000 of
persons suffering from ailment on the day before the date of survey by sex
and age-group
A-151
38
Number of persons per 1,00,000 reporting onset of ailments during last 15 days and average
duration of ailment by sex and age-group
A-157
39
Number per 1,00,000 of persons reporting onset of specific ailments during last 15 days and
average duration of ailment by broad ailment type
A-160
40
Average number of spells of ailment during last 15 days, average time of indisposition during
last 15 days, average total duration of ailment and average loss of household income due to
ailment during last 15 days for each age-group
A-166
41
Number per 1000 of spells of ailment during last 15 days treated on medical advice and per
1000 distribution of untreated spells of ailments not given medical treatment by reason for not
taking treatment for each mpce class and social-group
A-169
42
Number of spells of ailments receiving treatment from non- government sources per 1000 of
treated spells during last 15 days and their distribution by reason for not taking treatment from
govt. sources for each mpce class
A-178
43
Number per 1000 untreated spells of ailment reporting measures taken for recovery/relief
(other than medical treatment), per 1000 distribution of such spells of ailments by measure
taken for recovery/relief and average expenditure incurred for such measures for
recovery/relief separately for each mpce class
A-187
44
Average medical expenditure (Rs.) for treatment (other than as inpatient) under different heads per ailing person medically treated during last 15 days by mpce classA-196
45
Average total expenditure incurred during the last 15 days on account of treatment per ailing
person (but not as inpatient of a hospital) for each sex and mpce class
A-205
46
Per 1000 distribution of ailing persons among those who were medically treated but not as
inpatient of hospital during last 15 days by type of payment made for availing some services
for each category of specific medical service for each State/UT
A-210
47
Per 1000 distribution of total household expenditure incurred during the last 15 days in
connection with treatment (other than as inpatient of hospital) by source of finance for each
table
no.
title
page no.
Part A2: Immunisation and Maternal Health
49
Number per 1000 of children (0 – 4 years) receiving any type of immunisation and average
expenditure incurred by sex for each mpce class and social group
A-231
50
Per 1000 number of ever married women aged 15 - 49 yrs. who were pregnant any time during
last 365 days, their distribution by status of pregnancy and place of childbirth, and average
expenditure incurred per case of childbirth, separately for each age-group, mpce class and
social group
A-234
51
(i) Per 1000 distribution of ever married pregnant women (15 - 49 yrs.) during last 365 days,
by source of receiving pre-natal care, (ii) per 1000 distribution of ever married pregnant
women (15 - 49 yrs.) who gave child birth by source of receiving post-natal care, and (iii)
average expenditure on pre-natal care and post-natal care by type of institution for each
age-group
A-240
Part A3: Condition and Health Care of the Aged
10
Per 1000 distribution of aged persons by number of living children for each sex and State/UT
A-243
11
Per 1000 distribution of aged persons by state of economic independence for each sex
A-261
12
Per 1000 distribution of fully economically independent aged persons by number of dependants
for each sex and State/UT
A-270
13
Per 1000 distribution of economically dependent aged persons by category of persons
financially supporting the aged person for each sex
A-288
14
Per 1000 distribution of aged persons by type of living arrangement for each sex and State/UT
A-297
15
Per 1000 distribution of aged persons living alone or living with spouse only by location of
residence of any child/ grandchild or sibling for each sex
A-315
16
Per 1000 distribution of aged persons by state of physical mobility for each age–group and sex
A-324
17.1
Per 1000 distribution of aged persons with illness or otherwise by their perception about
current state of health for each mpce class and sex
A-327
17.2
Per 1000 distribution of aged persons with illness or otherwise by their perception about
current state of health for each sex
A-336
18.1
Per 1000 distribution of aged persons with illness or otherwise by their perception about
change in state of health for each quintile class and sex
A-354
18.2
Per 1000 distribution of aged persons with illness or otherwise by their perception about
change in state of health for each sex
Chapter One
Introduction
1.1.1 The National Sample Survey Organisation (NSSO) was set up in 1950 as a permanent
survey organisation to collect data on various facets of the Indian economy through
nation-wide sample surveys in order to assist in socio-economic planning and policy-making. The
National Sample Survey made its first attempt to collect information on morbidity in the
seventh round (Oct. 1953 - March 1954). This survey and the morbidity surveys conducted in
the three subsequent rounds (the eleventh to the thirteenth, 1956-58) were all exploratory in
nature. The aim of these surveys was to evolve an appropriate data collection method for
studying morbidity profile in India. These surveys were followed up by a pilot survey in the
seventeenth round (Sept. 1961 - July 1962) to examine alternative approaches of morbidity
reporting. With the aid of the findings of these exploratory surveys, a full-scale survey on
morbidity was conducted in the twenty-eighth round (Oct. 1973 - June 1974). Since then, the
NSSO had not undertaken any separate morbidity survey and data on morbidity became a
part of the
decennial surveys on social consumption.
1.1.2 The NSSO carried out the first all-India Survey on Social Consumption in its 35
thround (July 1980 - June 1981). The items covered were the public distribution system, health
services including mass immunisation and family welfare programmes, and educational
services. The results of the survey could not be brought out owing to some unavoidable
reasons. The second survey on Social Consumption was carried out in the 42
ndround (July
1986 - June 1987) with some modifications in the coverage of subjects. Topics like Problems
of Aged Persons were included in this round. The third Survey on Social Consumption was
carried out in the 52
ndround (July 1995 - June 1996). Two topics, viz. utilisation of the public
distribution system and utilisation of family planning services, were dropped, as these were
covered in the NSS 50
thround and in a nationwide survey by the Ministry of Health and
Family Welfare, respectively.
1.1.3 After a gap of about nine years, the Governing Council decided to take up a survey on
‘Morbidity and Health care’ at the request of Ministry of Health and Family Welfare, during
the period January to June, 2004.
Introduction
1.2.2 Layout of the report
:
The report contains five chapters and three appendices. Apart
from this chapter, Chapter Two provides the concepts and definitions used for the purpose of
survey on morbidity and health care. Chapters three, four and five discuss the summary
results of the survey and attempts to provide a perspective for proper interpretation of the
results. While Chapter Three discusses the survey estimates relating to Morbidity and
Hospitalisation, Chapter Four deals with estimates on Immunisation and Maternal Health
Care. In Chapter Five, the survey results on Conditions and Health Care of the Aged have
been discussed. The detailed survey results in the form of tables are given for rural and urban
India in Appendix A, which is sub-divided into three parts, viz. Part A1, Part A2 and Part A3,
giving, respectively, the tables relating to and discussed in Chapters Three, Four and Five.
While the sample design and estimation procedure have been outlined in Appendix B, the
facsimile of the schedule is given in Appendix C.
1.2.3 The estimates presented in the report are based on the data from the
Central sample
only
(pooled data of the two
sub-samples
). The survey results presented in the report are
mostly in the form of ratios. The basic aggregate estimates of population and number of
households, given in the detailed tables of the Appendix, generally as marginal column totals,
may be used for working out rates and ratios for domains not presented in the report.
1.3 Sixtieth Round
1.3.1 In the Sixtieth round of NSS, data was collected through a survey on the subject of
‘Morbidity and Health Care’. Apart from this subject, surveys were also undertaken
separately on ‘Household Consumer Expenditure’ and ‘Employment and Unemployment’. In
the survey on Morbidity and Health Care, the following main aspects were covered:
(i) Morbidity and utilisation of health care services including immunisation and
maternity care,
(ii) Problems of aged persons, and
(iii) Expenditure of the households for availing the health care services.
1.3.2 The object of the present survey was essentially to study the benefits derived by
various sections of the population from investments and outlays made by the Government, as
well as by the private sector in the fields of health and get an estimate of expenditure incurred
by households to avail health care services including immunization and maternity care.
1.4
Geographical coverage
1.4.1 The entire area of the country was covered with the exception of some interior areas of
Nagaland and Andaman & Nicobar Islands, and Leh (Ladakh) and Kargil districts of Jammu
& Kashmir.
1.5 Method of Data Collection
1.5.1 The present report is based on the information on morbidity and health care services
collected in Schedule 25.0. The data were collected from a sample of households by the
Introduction
persons in the household. Efforts were made to interview all the adult male members of each
sample household, personally. For the children, particularly the young, attempts were made to
get the required information from their mothers.
1.6
Reference period
1.6.1 The enquiry on morbidity was conducted with a reference period of 15 days. All spells
of ailment suffered by each member, both present as well as the deceased, of the sample
household, during the 15 days preceding the date of enquiry, whether or not the patient was
hospitalised for treatment, were covered in the survey. For hospitalised treatment, however,
information was collected for every event of hospitalisation of a member, whether living or
deceased at the time of survey, during the 365 days preceding the date of enquiry.
1.7
Sample design
1.7.1 The sample design adopted for the survey was essentially a two-stage stratified design,
with census villages and urban blocks as the first-stage units (FSUs) for the rural and urban
areas respectively, and households as the second-stage units (SSUs). The survey period,
January - June 2004, was split up into two sub-rounds of three months each. The rural and
urban samples of FSUs were drawn independently in the form of two sub-samples and equal
numbers of FSUs of each sub-sample were allocated for the two sub-rounds. (For a detailed
discussion on sample design, see Appendix B.)
1.7.2
Sample size -- first-stage units
: In all, 10,072 villages were planned to be surveyed in
this round. Of these, 4,908 were allocated to the central sample -- the part surveyed mainly by
the NSSO field staff -- and the rest to the State sample -- the part surveyed by the State
agencies. In the urban sector, the allocations for the Central and State samples were,
respectively, 2,708 and 3,096 blocks. This report is based on the estimates obtained from the
central sample alone. The number of villages and that of urban blocks actually surveyed as
the central sample were 4,755 and 2,668 respectively.
1.7.3
Sample size -- second-stage units
: For Schedule 25.0, 10 households were planned to
be surveyed in each selected FSU. In the Central sample, the actual numbers of households
surveyed in the rural and urban areas were 47,302 and 26,566, respectively. The number of
villages and blocks allotted and surveyed , and the number of households surveyed in the
rural and urban sectors of each State/UT are given in Statement 1.
Introduction
Statement 1: Number of sample villages/blocks allotted and surveyed, and the households
surveyed in the central sample for NSS 60
thround survey
villages / blocks
households
State /UT
allotted
surveyed
surveyed
rural
urban
rural
urban
rural
urban
(1)
(2)
(3)
(4)
(5)
(6)
(7)
Andhra Pradesh
328
184
325
183
3235
1824
Arunachal Pradesh
76
32
75
32
732
320
Assam
220
48
215
48
2150
480
Bihar
360
64
354
64
3536
638
Chhattisgarh
112
40
107
40
1070
400
Delhi
8
100
8
100
78
961
Goa
8
12
8
12
79
120
Gujarat
152
132
150
131
1497
1309
Haryana
88
56
86
55
851
549
Himachal Pradesh
132
20
126
20
1239
200
Jammu & Kashmir
136
68
83
38
821
380
Jharkhand
144
60
141
60
1398
598
Karnataka
192
152
185
152
1847
1518
Kerala
200
100
184
100
1839
990
Madhya Pradesh
232
128
229
128
2281
1280
Maharashtra
272
272
265
267
2650
2664
Manipur
108
52
107
52
1070
520
Meghalaya
56
24
56
24
536
239
Mizoram
44
64
41
64
394
631
Nagaland
24
12
24
12
240
120
Orissa
212
56
211
56
2094
560
Punjab
84
68
82
68
816
676
Rajasthan
236
108
234
108
2311
1072
Sikkim
44
8
44
8
440
80
Tamil Nadu
260
260
254
260
2540
2599
Tripura
84
24
82
24
820
240
Uttaranchal
36
20
36
20
346
200
Uttar Pradesh
680
264
671
264
6682
2627
West Bengal
324
188
317
188
3170
1879
Andaman & Nicobar
Islands
16
12
15
12
140
120
Chandigarh
8
36
8
34
80
333
Dadra & Nagar Haveli
8
8
8
8
80
80
Daman & Diu
8
8
8
8
80
79
Concepts and Definitions
Chapter Two
Concepts and Definitions
2.1.1 The concepts and definitions of the terms used in this report are briefly discussed in this
chapter. For better morbidity reporting, some probing questions were put to the informants
during data collection. Such special attempts to elicit information on morbidity and treatment
of ailments are also indicated in this chapter.
2.2
Household
: A group of persons normally living together and taking food from a common
kitchen constitutes a household. The word “normally” means that temporary visitors are
excluded but temporary stay-aways are included. Thus a son or daughter residing in a hostel
for studies is excluded from the household of his/her parents, but a resident employee or
resident domestic servant or paying guest (but not just a tenant in the house) is included in the
employer/host’s household. “Living together” is usually given more importance than “sharing
food from a common kitchen” in drawing the boundaries of a household in case the two
criteria are in conflict; however, in the special case of a person taking food with his family
but sleeping elsewhere (say, in a shop or a different house) due to space shortage, the
household formed by such a person’s family members is taken to include the person also.
Each inmate of a mess, hotel, boarding lodging house, hostel, etc., is considered as a
single-member household but a family living in a hotel is considered to be one household only; the
same applies to residential staff of such establishments.
2.3.1
Ailment - illness or injury
: Ailment, i.e. illness or injury, mean any deviation from the
state of physical and mental well-being. An ailment may not cause any necessity of
hospitalisation, confinement to bed or restricted activity. An ailing member is a normal
member of the household who was suffering from any ailment during the reference period.
For the purpose of survey, one will be treated as sick if one feels sick
.
This will also include
among other things:
•
Cases of visual, hearing, speech, locomotor and mental disabilities;
•
Injuries will cover all types of damages, such as cuts, wounds, haemorrhage, fractures
and burns caused by an accident, including bites to any part of the body;
•
Cases of spontaneous abortion - natural or accidental;
This will not include:
Concepts and Definitions
Ø
During the reference period, did the member feel anything wrong relating to skin, head,
eyes, ears, nose, throat, arms, hands, chest, heart, stomach, liver, kidney, legs, feet or any
other organ of the body?
Ø
Does the member suffer from any disease of a chronic nature relating to stomach, lungs,
nervous system, circulation system, bones and joints, eye, ear, mouth or any other organ
of the body?
Ø
Does the member have any kind of hearing, visual, speech or locomotor disability?
Ø
Did the member take, during the reference period, any medicine or medical advice for
his/her own ailment or injury?
2.4
Hospitalisation:
One was considered hospitalised if one had availed of medical services
as an indoor patient in any hospital. Hospital, for the purpose of survey, referred to any
medical institution having provision for admission of sick persons as indoor patients
(inpatients) for treatment. Hospitals covered public hospitals, community health centres and
primary health centres (if provided with beds), ESI hospitals, private hospitals, nursing
homes, etc. In this context it may be noted that admission for treatment of ailment and
discharge thereof from the hospital was considered as case of hospitalisation irrespective of
the duration of stay in the hospital. It may also be noted that hospitalisation in the cases of
normal pregnancy and childbirth were treated as hospitalisation cases.
2. 5
Confinement to bed
: It referred to a state of health where the ailing person is required or
compelled to mostly stay in bed at his/her residence/home.
2.6
Restriction of activity:
By disability or restricted activity it was meant the state of health
which prevents the ailing person from doing any of his/her normal avocation. For
economically employed persons, restricted activity meant abstention from the economic
activity. In the case of a housewife, this meant cutting down of the day's chores. In the case of
retired persons, this referred to the pruning of his/her normal activity. In the case of students
attending educational institution, this referred to abstention from attending classes. For
infants below school going age and for the very old, restricted activity was not to be
considered in view of the fact that their usual activities are of restricted nature.
2.7
Spell of ailment
: A continuous period of sickness owing to a specific ailment will be
treated as a spell of ailment.
2.8
Duration of ailment
: Duration of ailment is the period between the commencement of
the ailment and termination of it by recovery. For ascertaining the period of ailment during
the reference period, commencement was taken as on the first day of the reference period if it
was on a day beyond the reference period. Similarly, if the ailment was found to be
continuing on the date of enquiry, the day of termination of the ailment was taken as the last
day of the reference period.
Concepts and Definitions
acting on the advice of non-medical persons such as friends, relatives, pharmacists, etc., was
not considered as treatment.
2.10
Expenditure for medical treatment
: Total expenditure incurred for medical treatment
received during the reference period (15 days for non-hospitalised treatment and 365 days for
hospitalised treatment) includedexpenditure on items like
bed charges (with charges for food included in it)
medicines (including drips)
materials for bandage, plaster, etc.
fees for the services of medical and para-medical personnel
charges - for diagnostic tests
operations and therapies
charges of ambulance
costs of oxygen, blood, etc.
All other types of expenditure incurred for treatment, such as lodging charges of escort,
attendant charges, cost of transport other than ambulance, and cost of personal medical
appliances, were excluded from medical expenditure.
2.11
Disability
: A person with restrictions or lack of abilities to perform an activity in the
manner or within the range considered normal for a human being was treated as having
disability. It excluded illness/injury of recent origin (morbidity) resulting into temporary loss
of ability to see, hear, speak or move.
2.11.1
Mental disability:
Persons who had difficulty in understanding routine instructions,
who do not carry out their activities like others of similar age or exhibit behaviours like
talking to self, laughing / crying, staring, violence, fear and suspicion without reason were
considered as mentally disabled for the purpose of the survey. The “activities like others of
similar age” included activities of communication (speech), self-care (cleaning of teeth,
wearing clothes, taking bath, taking food, personal hygiene, etc.), home living (doing some
household chores) and social skills.
2.11.2
Visual disability:
By visual disability, it was meant, loss or lack of ability to execute
tasks requiring adequate visual acuity. For the survey, visually disabled included (a) those
who did not have any light perception - both eyes taken together and (b) those who had light
perception but could not correctly count fingers of hand (with spectacles/contact lenses if
he/she used spectacles/contact lenses) from a distance of 3 metres (or 10 feet) in good day
light with both eyes open. Night blindness was not considered as visual disability.
Concepts and Definitions
the speaker is sitting in the front. A person was treated as having ‘moderate’ hearing
disability if his/her disability was neither profound nor severe. Such a person would usually
ask to repeat the words spoken by the speaker or would like to see the face of the speaker
while he/she spoke or felt difficulty in conducting conversations.
2.11.4
Speech disability:
This referred to persons’ inability to speak properly. Speech of a
person was judged to be disordered if the person's speech was not understood by the listener.
Persons with speech disability included those who cannot speak, can speak only with limited
words or those with loss of voice. It also included those whose speech was not understood
due to defects in speech, such as stammering, nasal voice, hoarse voice and discordant voice
and articulation defects, etc.
2.11.5
Locomotor disability:
A person with - (a) loss or lack of normal ability to execute
distinctive activities associated with the movement of himself/herself and objects from place
to place and (b) physical deformities, other than those involving the hand or leg or both,
regardless of whether the same caused loss or lack of normal movement of body – was
considered as disabled with locomotor disability. Thus, persons having locomotor disability
included those with (a) loss or absence or inactivity of whole or part of hand or leg or both
due to amputation, paralysis, deformity or dysfunction of joints which affects his/her “normal
ability to move self or objects” and (b) those with physical deformities in the body (other than
limbs), such as, hunch back, deformed spine, etc. Dwarfs and persons with stiff neck of
permanent nature who generally did not have difficulty in the normal movement of body and
limbs were also treated as disabled.
2.12
Abortion:
Abortion is the case of foetus born before the completion of 28 weeks since
conception and showing no sign of life at birth.
2.13
Live-birth:
When a child shows any evidence of life at birth, irrespective of the interval
since conception, it is the case of a live-birth. The child may, however, expire within a very
short time after birth.
2.14
Still-birth:
It is the case of a baby born after completion of 28 weeks and showing no
sign of life. The birth of a foetus caused by abortion is not considered a ‘still-birth’.
Summary of Findings
Chapter Three
Morbidity and Hospitalisation
3.1
General
3.1.1 It may be mentioned at the outset that the National Health Policy was formulated and
enacted in 1983. Since then, NSSO has conducted three nationwide surveys on utilisation of
medical services by the various sections of the population. The present enquiry on morbidity and
utilisation of medical services, the third in the series, has been carried out in the 60
thround of the
NSS during January to June, 2004. Although the objective of these surveys was essentially to
study the utilisation of public and private health services by various sections of the population,
the present survey specially attempts to measure the role of the private institutions vis-à-vis
government institutions in providing health care services. It is important to note that of the first
two enquiries, one was carried out during 1986-87 (NSS 42
ndround) and the other during the
post ‘economic’ liberalisation period 1995-96
(NSS
52
ndround). The first enquiry on the subject,
conducted only after three years of the enactment of the Health Policy, was, therefore, too early
to register the effects of the policy. The results of the second survey are expected to reveal to
some extent the effects of the National Health Policy jointly with the effect of economic
liberalisation – although the period ever since the formulation and enactment of policy is
assumed to be small. This present survey, therefore, assumes special significance for a
comprehensive study on the general health care system in India and for measuring the role of
private institutions in the health sector.
3.1.2 This chapter summarises the important findings of the survey and discusses the salient
features pertaining to the curative aspects of the general health care system in India. Wherever
possible, the results of the earlier rounds have been placed side by side so that trends and changes
over the periods of survey may be examined. The focus is principally on the all-India estimates;
as a secondary task, one proceeds to examine the disparities in the utilisation of the health
services across the major states and across their rural and urban sectors. The estimates for the
smaller States and Union Territories (UTs) have been neither presented nor considered for
discussion in this chapter. In fact, the estimates for the 20 major states in the rural sector of the
country and 21 major states in the urban sector have been presented in this chapter. The estimates
for all the remaining states, group of UTs and for the group of North-eastern states (excluding
Summary of Findings
dimensional aspects of the health care system of the country. The results on immunisation
services received by children of age less than five years have been presented and discussed in
Section 7. This section also investigates on the maternity care received by pregnant mothers.
Finally, the chapter concludes with the results and discussion on the condition of the aged – those
with age 60 years or more, in Section 8. In fact, it highlights the structure and composition of the
aged in respect of age, sex, dependency ratio, etc. and the conditions of the aged in respect of
their economic dependency, number of dependants, living arrangements, persons supporting the
aged, physical immobility, etc. Note that the all-India level estimates given in this report relate to
the whole of the India Union, including all the states and UTs.
3.1.4
Use of Estimated Aggregates
: A few points on some general aspects of the survey estimates
need to be stated in this paragraph. Compared to the census population or the projections thereof,
population estimates from the NSSO surveys are, in general, on the lower side. This difference
arises mainly due to the differences in methods and coverage adopted by the NSSO in
comparison with the census operation. However, the ratios obtained from the surveys are much
closer to the ratios obtained using census figures. Usually, the estimates on morbidity rates are
presented as ratios, except for the estimates on expenditure on treatment, etc. To estimate an
absolute number in any category, it is advisable to apply the survey estimates of ratios to the
cen-sus population or projections thereof, for that category. The estimates of aggregates given in the
detailed tables may help to combine the ratios but may not be used for deriving estimates of
absolute numbers for a characteristic. It may also be noted that as the tables are generally
presented as per thousand distributions, the figures are rounded off. Thus, while using the ratios
from the survey results, it is to be noted that the accuracy of these derived aggregates will be limited
to the number of significant digits available in the ratio or percentage estimates presented in the
report. The estimated aggregates, wherever possible, may be used as weights for combining the
ratios.
3.2
Household Profile
3.2.1 As per the survey estimates, about 959 million people lived in 199 million households in
India. About 72 per cent of the households belonged to rural India and accounted for nearly 75
per cent of total population (see Table 1 in Appendix A). A household consisted, on an average,
of 5.0 persons in rural areas and 4.4 persons in the urban areas. The rural population had 964
females per 1000 males while the urban had 917.
3.2.2 Monthly per capita expenditure (MPCE)
3.2.2.1 Household income, or for that matter ‘level of living’, is highly related with the ‘general
health’ of the household members as well as to the extent of ‘medical care’ received by them.
Summary of Findings
when household consumption expenditure is the main theme of the survey. This procedure is
known to underestimate the level of MPCE in comparison with the detailed schedule but
expected to provide a reasonable proxy for relative ranking of the households according to level
of living. The distributions of households by MPCE class for rural and urban India are presented
in Statement 2.
3.2.2.2 In urban India, about 32 per cent of
the households spent less than Rs. 665 per
month per person. On the other hand, in
rural India, about 44 per cent of the
households spent less than Rs.420. Over 56
per cent of the urban households spent
Rs.775 or more per person per month
compared to only 12 per cent in rural areas.
3.2.2.3
Type of Structure of Dwelling
:
Structure of the dwelling not only reflects
the living condition of the household and its
members but also has a bearing on the health
conditions of the members of the household.
The distribution of households by type of
structure of their dwelling units is, therefore,
given in Statement 3 for each household
social group for the rural and urban areas. It
can be seen that more than half of the
households in the rural areas resided in
semi-pucca
or
kutcha
structures. The distribution in
respect of the structure of dwellings is found to
deteriorate for the weaker sections of the
population and is worst for the Scheduled Tribes
(STs). Merely 20 per cent of the households
among the
STs
resided in the dwellings made of
pucca
materials, the rest living either in
semi-pucca
or in
kutcha
dwellings. Pucca structure is
much more common in the urban areas with 84
Statement 2
Per 1000 distribution of households by MPCE class
during January – June 2004
India
rural
urban
MPCE class
(Rs.)
house-holds
MPCE class
(Rs.)
house-holds
less than 225 46 less than 300 27
225 – 255 38 300 – 350 19 255 – 300 88 350 – 425 51 300 – 340 78 425 – 500 99 340 – 380 93 500 – 575 45 380 – 420 99 575 – 665 81 420 – 470 102 665 – 775 110 470 – 525 110 775 – 915 101 525 – 615 109 915 – 1120 149 615 – 775 113 1120 – 1500 158 775 – 950 58 1500 – 1925 48 950 or more 66 1925 or more 110 all 1000 all 1000 Statement 3
Per 1000 distribution of households by structure of dwelling for each household social group
India household social group
structure of dwelling ST SC OBC others total rural pucca 195 410 520 582 480 semi- pucca 570 335 306 280 332
Summary of Findings
State variations exist. One observes that
kutcha
structures housed 19 per cent of households in
urban Orissa and 10-11 per cent of households in
urban areas of Tamil Nadu and Bihar.
3.2.2.4
MPCE Class and
Type of Structure of
Dwelling
: Generally, the quality of dwelling
structure is known to be associated with the level
of living of a household. From this angle, it is
useful to examine the dwelling type in relation to
the size of MPCE. It is seen from Statement 4 that
in rural areas, while only 26 per cent of the
poorest class (MPCE Rs. 225 or less) reported
living in
pucca
dwellings, as many as 84 per cent
of the richest class of households (MPCE Rs. 950
or above) lived in the
pucca
dwellings. The
disparity between the poor and the rich is found to
be less in the urban areas as compared to the rural
areas. In fact, the proportion of households living
in
pucca
dwellings ranged from 49 per cent (for
MPCE Rs. 300 or less) to 99 per cent (for MPCE
Rs. 1925 or above) in the urban areas.
3.2.2.5
Major Source of Drinking Water
: The
quality of water used for drinking is a very
important determinant of health condition. The
source from where drinking water is collected by
the household roughly indicates its quality and,
thus the awareness of the households of the need
for drinking water of proper quality.
Information collected on the major source
of drinking water used by the household
during the major part of a year has been
presented in Statement 5 separately for the
rural and urban areas. The most prevalent
source, in the rural areas, is found to be
Statement 4
Per 1000 distribution of households by
structure of dwelling for each household
monthly per capita expenditure class
India
distribution by type of structure mpce classes puccasemi-pucca kutcha total rural less than 225 259 441 299 1000 225 – 255 285 411 304 1000 255 – 300 319 421 261 1000 300 – 340 381 374 245 1000 340 – 380 400 385 215 1000 380 – 420 427 373 199 1000 420 – 470 477 335 188 1000 470 – 525 535 309 155 1000 525 – 615 575 286 139 1000 615 – 775 647 243 110 1000 775 – 950 740 190 70 1000 950 & above 839 115 47 1000 all 480 332 188 1000 urban less than 300 494 326 179 1000 300 – 350 561 274 165 1000 350 – 425 654 244 101 1000 425 – 500 746 187 68 1000 500 – 575 738 192 69 1000 575 – 665 810 145 45 1000 665 – 775 857 111 32 1000 775 – 915 897 82 20 1000 915 – 1120 938 50 12 1000 1120 – 1500 961 31 7 1000 1500 – 1925 976 18 3 1000 1925 & above 993 4 3 1000 all 842 115 43 1000
Statement 5
Per 1000 distribution of households by major
source of drinking water
India
major source ofdrinking water
rural urban rural+urban
bottled water 10 28 15
tap 248 676 357
tube-well/ hand
Summary of Findings
cent and 13 per cent, respectively, in the rural areas. The same three sources were the most
important in urban areas, but in a different order. ‘Tap’ was the most important (68 per cent),
followed by ‘tube well/ hand pump’ (22 per cent), and ‘pucca well’ (4 per cent). Thus these three
sources together provided drinking water to 94 per cent of households in both rural and urban
areas. A small but significant proportion of households, even in 2004, collected their drinking
water either from a ‘tank /pond reserved for drinking’, or from a ‘river/ canal’: they formed 2 per
cent of rural households in India. The estimates for the states are given in Statements 5.1R and
5.1U (pp 37-38).
3.2.2.6
Treatment of Water before Drinking
: The water
collected by a household for drinking is sometimes not
consumed directly but only after some cleaning/treatment.
Prior cleaning/treatment of water before drinking is good
indicator of health awareness. It would, therefore, be of
interest to examine the proportion of households resorting
to cleaning of collected water, tabulated by source of
drinking water. The relevant results are presented in
Statement 6 separately for rural and urban areas of India.
As a whole, a higher proportion (38 per cent) of
households in the urban areas reported cleaning of water
before drinking than in the rural (20 per cent). The
proportions are appreciably higher among the households
that collected their drinking water from ‘tank/pond
reserved for drinking’, from ‘tankers’, from a ‘pucca
well’ or from a ‘river/canal’. Among all the sources,
water collected from ‘tube-well/hand pump’ was perhaps
felt to be safest for drinking as only 10 per cent of the households in the rural areas and 16 per
cent of the households in the urban areas purified such water before drinking. State-level
estimates on number per 1000 of households treating water before drinking are also given in
Statement 5.1.
3.2.2.7
Methods Used for Treating Water before Drinking:
For those households which treated
water before drinking, information on the method usually adopted by households for treating
water was collected. The specified list of methods used to classify the method of treatment
reported by household for which the data was collected in the survey were ‘ultra-violet/resin’,
Statement 6
Number per 1000 of households
treating water before drinking for
each major source of drinking water
India
major source ofdrinking water rural urban
tap 291 436
tube-well/ hand pump 98 164
tankers 459 546
pucca well 366 570
tank/ pond reserved
for drinking 551 731
river/ canal 327 584
others 276 351
Summary of Findings
3.2.2.8
Age Distribution of Population
: Any study relating
to a human population remains incomplete unless its size
and age-sex composition is known before its specific
characteristics are examined. Thus, the distribution of
population by age-group and sex, as background
information, will certainly help in easy understanding of the
results, particularly the study of various indicators of
morbidity. In Statement 8, the distribution of population
over broad age groups is presented separately for males and
females in rural and urban areas. Comparable results based
on the 58
thround (July – December 2002) survey are also
presented in this statement. It can be seen that while the
proportion of boys and girls (age 0-14 years) was around 37
per cent in the rural areas, it was around 30
per cent in the
urban areas.
On the other hand, the aged (60 years or more)
constituted a little over 7 per cent of the rural male, rural
female and urban female and a little over 6 per cent of the
urban male population. No marked differences can be
observed between the estimates obtained from the two surveys.
3.3 Morbidity and Health Care
3.3.1
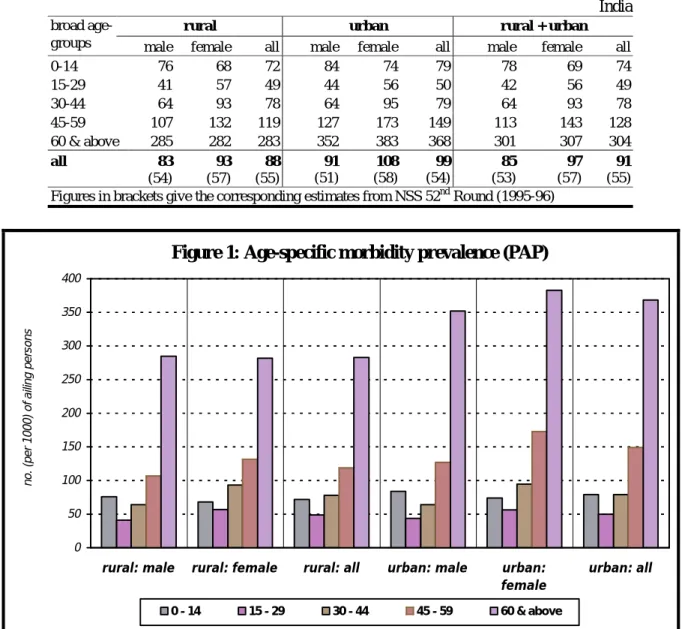
Level of Morbidity
: Statement 9 gives the
survey estimates on prevalence of morbidity.
For the purpose of the survey, it is termed
Proportion of Ailing Persons (PAP), measured
as the number of persons reporting ailment
during a 15-day period per 1000 persons for
some broad age-groups. It shows a difference
of 1 percentage point in the PAP between the
rural and urban areas. The rate differed
between the male and female population by 1
percentage point in rural India and 2 percentage
points in urban India. As expected, the PAPs
are found to be higher for children and much
higher for the higher age groups – the lowest
being the PAPs for the youth (age 15-29 years).
While 12 to 15 per cent of persons in the
age-bracket 45-59 reported ailments, the proportion
Statement 7
Per 1000 distribution of households
that treated water before drinking
by type of treatment
India
treatment of water before drinking rural urban ultra-violet/resin 8 53 filter 248 254 boiling 89 275 cloth screen 626 395 any disinfectant 11 10 others 18 13 total 1000 1000Statement 8
Per 1000 distribution of population by broad age
group in NSS 60
thand 58
throunds
India
rural male
rural female
age group
(years)
60
thrd.
58
thrd.
60
thrd.
58
thrd.
0-14 376 368 357 351 15-29 249 257 256 255 30-44 189 185 196 201 45-59 115 117 119 117 60 & above 70 72 71 76 all ages 1000 1000 1000 1000urban male
urban female
age group
(years)
60
thrd.
58
thrd.
60
thrd.
58
thrd.
0-14 299 302 290 297Summary of Findings
Statement 9
Number (per 1000) of persons reporting ailment (PAP) during last 15 days
India
rural urban rural + urban
broad
age-groups male female all male female all male female all
0-14 76 68 72 84 74 79 78 69 74 15-29 41 57 49 44 56 50 42 56 49 30-44 64 93 78 64 95 79 64 93 78 45-59 107 132 119 127 173 149 113 143 128 60 & above 285 282 283 352 383 368 301 307 304 all 83 (54) 93 (57) 88 (55) 91 (51) 108 (58) 99 (54) 85 (53) 97 (57) 91 (55) Figures in brackets give the corresponding estimates from NSS 52nd Round (1995-96)
Figure 1: Age-specific morbidity prevalence (PAP)
0 50 100 150 200 250 300 350 400
rural: male rural: female rural: all urban: male urban:
female
urban: all
no. (per 1000) of ailing persons
Summary of Findings
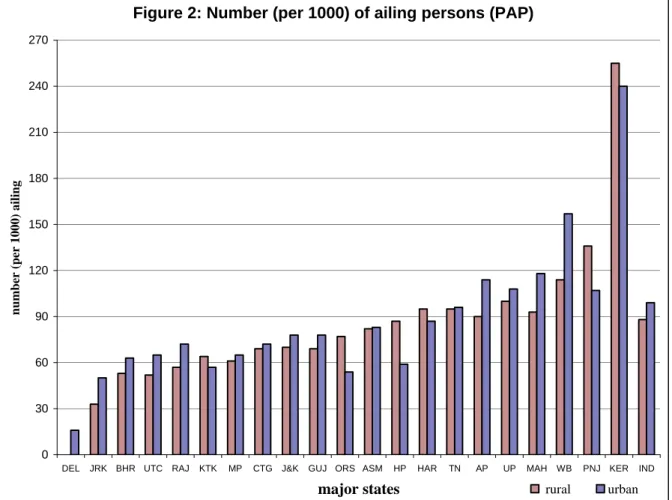
diseases a patient is afflicted with. Thus, only the estimated proportion (number per 1000) of
ailing persons is used as a measure of morbidity rates in this report. The comparison of the
survey estimates of morbidity rates, with those of the previous NSS round (52
ndround: July 1995
– June 1996) shows that the PAP has increased by 3 and 4 percentage points in the rural and
urban areas, respectively. The increase in PAP over time is probably due to increased health
consciousness over time and consequently, improvement in the self-reporting of ailments by the
informants. The PAPs for the major states are given in Figure 2.
Figure 2: Number (per 1000) of ailing persons (PAP)
0 30 60 90 120 150 180 210 240 270
DEL JRK BHR UTC RAJ KTK MP CTG J&K GUJ ORS ASM HP HAR TN AP UP MAH WB PNJ KER IND
major states
number (per 1000) ailing
rural urban