Virginia Commonwealth University Virginia Commonwealth University
VCU Scholars Compass
VCU Scholars Compass
Theses and Dissertations Graduate School
2018
Differences in Spatial Visualization Ability and Vividness of
Differences in Spatial Visualization Ability and Vividness of
Spatial Imagery Between People With and Without Aphantasia
Spatial Imagery Between People With and Without Aphantasia
Anita CrowderVirginia Commonwealth University
Follow this and additional works at: https://scholarscompass.vcu.edu/etd
Part of the Cognition and Perception Commons, Cognitive Psychology Commons, Educational Psychology Commons, and the Science and Mathematics Education Commons
© The Author Downloaded from Downloaded from
https://scholarscompass.vcu.edu/etd/5599
This Dissertation is brought to you for free and open access by the Graduate School at VCU Scholars Compass. It has been accepted for inclusion in Theses and Dissertations by an authorized administrator of VCU Scholars Compass. For more information, please contact [email protected].
DIFFERENCES IN SPATIAL VISUALIZATION ABILITY AND VIVIDNESS OF SPATIAL IMAGERY BETWEEN PEOPLE WITH AND WITHOUT APHANTASIA
A dissertation submitted in partial fulfillment of the requirements for the Doctor of Philosophy in Education, Educational Psychology
at Virginia Commonwealth University
by
Anita L. Crowder
Master of Art (Secondary Mathematics Education), Western Governors University 2012 Bachelor of Science (Systems and Control Engineering), Case Western Reserve University, 1988
Dissertation Chair: Kathleen M. Cauley, Ph.D. Associate Professor, Educational Psychology
Foundations of Education
Virginia Commonwealth University Richmond, Virginia
ii
Acknowledgment
Ever since I was a little girl, I have always been curious. I have loved to hear strangers’ stories, puzzles, and trying to understand how disparate things can fit together in a cohesive whole. For me, the journey is more important than the destination, which is why I do not believe I will ever stop realizing how much I do not know. Never in a million years did I imagine that I would earn my Ph.D, and there are so many people that I need to thank.
First, I would like to thank my dissertation committee. Dr. Kathleen Cauley. You have helped me more than you can imagine along the way, offering me insight, help, and advice to push me ahead. I cannot put into words how thankful I am that you have served as my advisor. Dr. James McMillan, thank you for teaching me so much about statistics, and how to be analytical without judgment. Dr. Christine Bae, I so appreciate that you were willing to jump into this crazy dissertation topic with me! I would like to say a heartfelt thank you to Dr. Adam Zeman, who was amazingly open to a random curious e-mail from a mathematics teacher from across the ocean. Dr. Zeman, your willingness to share your knowledge, expertise, and research on
aphantasia has been invaluable. I can only hope that my work can somehow, in some small way, help you further your own. A special note of gratitude must go to Dr. Michael Peters for
graciously allowing me to implement the Mental Rotation Test online for the first time. I hope that the results from this study will lead to further investigation of the cognitive processes of people with aphantasia.
I would like to express my gratitude to my family. First, my six siblings, Vedoster Ingram, Sherry Vital, Jeffrey Phelps, Ruth McPherson, and Robert Phelps, who cheered me on from afar, always believing that I could accomplish this goal, and never questioning my sanity. I know that our parents, Wilbur and Betty Phelps, would be so proud of all that we have accomplished. I want to especially thank my oldest sister, Dr. Janet Guyden, for sharing her wisdom and experience in taking on doctoral studies at a non-traditional age.
To my children - Alexandra, Leah, David, and Sarah – thank you for your love, support, and understanding when I couldn’t pick you up from school or attend an event. Please know that you are my most precious, important accomplishments and I am so proud of all of you.
Finally, to my husband Al, the smartest person I know. I could have never done any of this without your constant calm, faith, love and support. I love you so much, and I hope that one day I can return the favor.
iii
Table of Contents
Acknowledgment ... ii
Table of Contents ... iii
List of Tables ... vi
List of Figures ... vii
Abstract ... viii
Chapter One: Introduction ... 1
Statement of the Problem ... 3
Context of the Study ... 4
Study Rationale ... 5
Conceptual Framework ... 7
Research Questions ... 8
Definition of Terms ... 9
Chapter Two: Literature Review ... 11
Summary of Search Methodology... 11
Visualization... 12
Object and Spatial Visualization ... 15
Cognitive psychology ... 16
Neuroscience ... 20
Object vs. Spatial Visualization Ability ... 21
Measurement ... 22
Visualization and Mathematics ... 27
Aphantasia ... 34
Summary of Literature ... 36
Chapter Three: Research Method ... 38
Research Design ... 38 Instruments ... 43 Demographic survey ... 43 VVIQ ... 44 VOSIQ ... 44 MRT... 45
iv
Implementation... 46
Piloting and Testing ... 47
Procedure ... 48
Participants ... 51
Data Analysis Steps ... 52
Chapter Four: Results ... 56
Descriptive Statistics ... 56
Group Demographic Differences ... 58
Vividness of Mental Imagery ... 59
Object Imagery ... 60
Spatial Imagery ... 61
Mental Rotation Test Performance ... 61
Gender Differences in MRT Performance ... 62
Relationship between Vividness of Mental Imagery and Mental Rotation Test Performance . 67 Arts and STEM Self-efficacy and Aphantasia ... 68
Gender and STEM/Arts Self-efficacy ... 70
STEM Self-efficacy and MRT Performance ... 71
Further Analysis by Cluster... 73
Vividness Groups and Spatial/Object Vividness ... 75
Vividness Groups and Dependent Variables ... 75
Relationships and Vividness Clusters... 76
Chapter Five: Discussion ... 79
Aphantasia and Vividness of Mental Imagery ... 79
Aphantasia and arts/STEM Self-efficacy ... 79
Arts Self-efficacy ... 82
STEM Self-efficacy ... 82
Aphantasia, Mental Rotation, and Mathematics ... 84
MRT Performance ... 85
Gender ... 85
Mental Rotation and Mathematics ... 87
Limitations ... 89
Sample ... 89
Technology ... 91
Lack of prior research ... 91
Future Research ... 91
Qualitative Studies ... 93
STEM and Aphantasia ... 94
Other Content Areas ... 95
Conclusion ... 95
References ... 97
Appendix A: Demographic Survey Questions... 112
v
Appendix C: Vividness of Object and Spatial Imagery Questionnaire ... 115 Appendix D: Vandenberg & Kuse Mental Rotation Test – Redrawn Sample Items ... 117
vi List of Tables
1. Overview of Terms in the Literature ... 16
2. Demographic Descriptive Statistics by Group ... 52
3. Descriptive Statistics of Dependent Variables ... 57
4. Descriptive Statistics of Dependent Variables by Group ... 58
5. MRT Accuracy * Gender - By Group ... 66
6. Correlations by Group... 68
7. Arts Self-efficacy * Aphantasia ... 69
8. STEM Self-efficacy * Aphantasia ... 69
9. Arts/STEM Self-efficacy * Gender – by Group ... 71
10. Correlations: Dependent Variables and Arts/STEM Self-efficacy – Non-Aphantasia ... 72
11. Correlations: Dependent Variables and Arts/STEM Self-efficacy – Aphantasia ... 73
12. Descriptive Statistics of Dependent Variables by Vividness Cluster ... 74
13. Vividness Clusters * Dependent Variables ... 76
14. Correlations: Low Vividness Cluster * Dependent Variables ... 77
15. Correlations: Medium Vividness Cluster * Dependent Variables ... 77
vii List of Figures
1. Current research in visualization, aphantasia, and mathematics………5
2. Conceptual framework……….………...8
3. Two-way ANOVA: Transformed MRT speed x gender*aphantasia………..… 63
4. Two-way ANOVA: MRT score x gender*aphantasia………….…….……….…...64
Abstract
DIFFERENCES IN SPATIAL VISUALIZATION ABILITY AND VIVIDNESS OF SPATIAL IMAGERY BETWEEN PEOPLE WITH AND WITHOUT APHANTASIA
By Anita L. Crowder
A dissertation submitted in partial fulfillment of the requirements for the Doctor of Philosophy in Education, Educational Psychology at Virginia Commonwealth University
Virginia Commonwealth University, 2018 Dissertation Chair: Kathleen Cauley, Ph.D. Associate Professor, Educational Psychology
Foundations of Education
Mathematics education researchers have examined the relationship between visualization and mathematics for decades (e.g., Arcavi, 2003; Bishop, 1991; Duval, 1999; Fennema & Tartre, 1985; Presmeg, 1986; Rösken & Rolka, 2006). Studies have linked spatial visualization ability, such as measured in mental rotation tasks, directly to mathematics self-efficacy (Pajares & Kranzler, 1995; Weckbacher & Okamoto, 2014), which in turn influences mathematics
achievement (Casey, Nuttall, & Pezaris, 1997). With the important role that spatial visualization plays in learning mathematics, the recent identification of congenital aphantasia (Zeman, Dewar, & Della Sala, 2015), which is the lack of mental imagery ability, has raised new questions for mathematics education researchers. This study investigated the differences in mental rotation test performance and vividness of spatial imagery between people who have aphantasia and people who do not as a first step toward examining how aphantasia may affect mathematics learning and
ix
education. Results confirmed prior aphantasia research showing that there was no significant difference in mental rotation test performance between people with aphantasia and those without aphantasia, despite people with aphantasia reporting significantly lower vividness of spatial imagery. Results also showed that there was less difference in mental rotation test performance between the genders for people with aphantasia, while gender played a significant role in mental rotation test performance for people without aphantasia. People with aphantasia also reported lower self-efficacy in the arts than people without aphantasia. Implications of these results will be discussed within the context of current research, and possible directions for future research will be offered.
1
Chapter One: Introduction
With the decrease in the number of students from the United States studying STEM-related subjects, some have predicted that there will be a shortage of qualified Americans to fill the available STEM jobs within the next ten years (Joint Economic Committee Chairman’s Staff, Senator Bob Casey, Chairman, 2012). Success in higher level mathematics is considered a critical gateway for students pursuing careers in science, technology, engineering, and
mathematics (STEM; Maltese & Tai, 2011; Tyson, Lee, Borman, & Hanson, 2007). The United States Department of Education found a correlation between those who studied higher level mathematics in high school (e.g., trigonometry, pre-calculus, calculus) and those who studied STEM in college. On average, those students had earned at least a “B” in their high school mathematics classes (Chen, NCES, & IES, 2009). Research has also found that the biggest differences in mathematical self-concept are between people who major in STEM fields and those who do not (Sax, 1994). The Sax (1994) results showed that 52% of men and 41.2% of women enrolled in STEM majors rated themselves in the top 10% in mathematics ability,
compared to 16.9% of men and 8.6% of women in non-STEM majors. Moreover, the gender gap in mathematical self-concept was smaller in those enrolled in STEM majors than those enrolled in non-STEM majors (Sax, 1994). In contrast, poor performance in mathematics as early as the ninth grade may cause students to discount the possibility of studying further mathematics, engineering, or technology, and lead to choosing “lower prestige” careers (Shapka, Domene, & Keating, 2006). These findings bolster the theory that students tend to choose future study in fields where they have had prior success (Eccles, 2009). The potential shortage of qualified
2
American STEM professionals and the fact that mathematics is an important part of the STEM pipeline makes research into mathematics learning essential.
For decades, research has delved into the role that visualization plays in mathematics learning and problem-solving (e.g., Arcavi, 2003; Bishop, 1991; Duval, 1999; Fennema & Tartre, 1985; Presmeg, 1986; Rösken & Rolka, 2006). The term visualization has been defined in various ways in the literature, but in this proposed study, visualization means the production of a mental representation of an object not in sight; while the term mental imagery refers to the produced mental representation. In other words, visualization is the process and mental imagery is the product. Cognitive and neuro-imaging research into visualization supports two categories of visualization: object and spatial (e.g., Kosslyn, 1981; Logie & Pearson, 1997). Spatial
visualization is the creation of spatial imagery, which is a mental representation of an object that deals with attributes like 3D structure, location, and motion. Object visualization is the creation of object imagery, or a mental pictorial representation of an object dealing with color, shape, and texture (Blazhenkova, 2016). Spatial visualization ability appears to have a direct, positive relationship to both mathematics achievement and mathematics self-efficacy (Casey, Nuttall, & Pezaris, 1997; Pajares & Kranzler, 1995; Weckbacher & Okamoto, 2014), while object
visualization ability seems to have a parallel direct, positive relationship to achievement and self-efficacy in the arts (Blazhenkova & Kozhevnikov, 2016). In this context, self-self-efficacy reflects the “expectations of personal mastery” (Bandura, 1977) of a subject.
Given the apparent relationship between visualization and mathematics, what would happen if a student were given a geometry word problem such as, “Given triangle ABC, with side AB longer than side AC. Which angle is bigger, B or C?” and the student could not “see” the triangle in her mind’s eye? How would the student solve the problem? According to Zeman
3
et al. (2015), as many as one in thirty people are unable to create mental imagery, a condition he termed aphantasia. The identification of congenital aphantasia, which has been described as having a “blind mind’s eye,” has led to an interesting new avenue for visualization and
mathematics education researchers. Existing research on aphantasia has focused on object rather than spatial visualization and has not yet studied the potential impact this condition could have on education. Studying the spatial visualization abilities of people with aphantasia and how those abilities may affect mathematics learning could lead to important insights into mathematics education.
Statement of the Problem
Because spatial visualization is most closely related to mathematics achievement and self-efficacy, this study aimed to begin to build a connection between the spatial visualization abilities of people with aphantasia and the learning of mathematics. The first step toward that goal was to examine the differences in spatial visualization ability, such as measured by mental rotation tasks, and vividness of spatial imagery between people with aphantasia and those
without aphantasia. The study also explored differences in the level of self-efficacy in STEM and arts fields between people with and without aphantasia.
To date, published research on the visualization ability of people with aphantasia has dealt exclusively with object visualization. People with aphantasia score significantly lower than the general population on self-report instruments measuring vividness of object imagery (Zeman et al., 2010; Zeman et al., 2015). No research exists on the vividness of spatial imagery or spatial visualization ability of people identified with aphantasia. In fact, it was not until recently that researchers began to develop instruments meant to specifically target the two types of
4
validating the Vividness of Object and Spatial Imagery Questionnaire (VOSIQ), Blazhenkova (2016) found that vividness of object imagery and vividness of spatial imagery appeared to be two independent constructs. She also reported strong correlations between the vividness of object imagery scores and performance tasks that measured object visualization ability, and between the vividness of spatial imagery scores and spatial visualization ability performance tasks. Blazhenkova (2016) found a moderate correlation between the vividness of object and spatial imagery. However, Kozhevnikov, Blazhenkova, & Becker (2010) reported that there may be a trade-off between spatial and object visualization ability because of the brain’s use of shared resources to accomplish visualization tasks. Kozhevnikov et al. (2010) found that subjects with high spatial visualization ability had lower object visualization ability, and vice versa. No subjects in the Kozhevnikov et al. (2010) study possessed both high spatial visualization ability and high object visualization ability.
Working from the conceptual framework that spatial visualization ability and vividness of spatial imagery are tightly connected to each other and to mathematics achievement and self-efficacy, the impact of a person having both low object and low spatial visualization ability on mathematics learning could be severe. With so much unknown, however, it is quite possible that people with aphantasia have high spatial visualization ability, which may make them more prone to enter STEM fields. If the estimate that one in 30 people have some level of aphantasia is true (Zeman et al., 2015), this study could have far-reaching effects on understanding the
mathematics learning of a large segment of the population. Context of the Study
Over the past fifty years, a multitude of cognitive and neuroscientific studies have
5
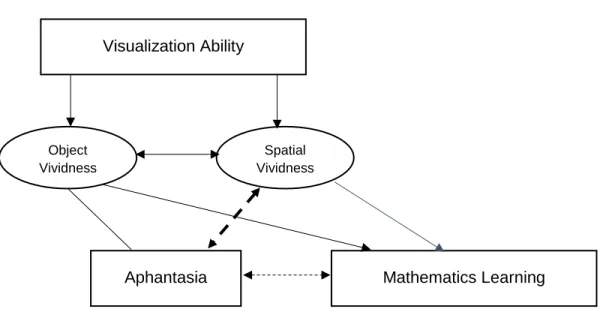
object visualization. Direct research on the relationship between object visualization and mathematics is rare and mostly tangential, resulting from examining the differences between spatial and object visualization ability (e.g., Xistouri & Pitta-Pantazi, 2011).Because congenital aphantasia is a recently identified phenomenon, very little published research on the condition exists, and that research has dealt exclusively with object visualization ability. There are no published studies on how aphantasia may affect spatial visualization ability and mathematics learning and education. Figure 1 represents where this study falls in the existing research into mathematics and visualization.
Figure 1: Current research in visualization, aphantasia and mathematics. Solid lines represent the existence of published studies on the relationships. Dotted lines mean that there is currently no published research on the relationships. The bold dotted line represents what the current study addressed.
Study Rationale
The purpose of this study was to examine the visualization characteristics of people with aphantasia. People with aphantasia score significantly lower on the Vividness of Visual Imagery Questionnaire (VVIQ; Marks, 1973; Zeman et al., 2015), which indicates very poor vividness of
Object Vividness Visualization Ability Spatial Vividness Mathematics Learning Aphantasia
6
object imagery. To date, no published data exists on vividness of spatial imagery of people with aphantasia. Further, no research on “normal non-imagers” (Faw, 2009) and their experiences with mathematics has been published. If people with aphantasia have high spatial imagery vividness and high spatial visualization ability, research would suggest that they would perform well in mathematics and tend to choose professions related to STEM. In fact, unpublished research using self-report data from thousands of participants has found that respondents with aphantasia were more likely to have careers in IT or mathematics, while respondents at the other end of the vividness of object imagery scale, those with hyperphantasia, were more likely to have careers in the arts (Winlove, Goddum, Heuerman-Williamson, & Zeman, 2017). This would seem to indicate that people with aphantasia have strong spatial visualization ability. However, because the only data available on people with aphantasia deals with vividness of object imagery and is based on self-report surveys, the level of their spatial visualization ability remains
unknown. Tests, such as the Object-Spatial Imagery Questionnaire (OSIQ; Blazhenkova, Kozhevnikov, & Motes, 2006) and the Vividness of Object Spatial Imagery Questionnaire (VOSIQ; Blazhenkova, 2016), as well as performance measures like the Mental Rotation and Paper Folding tasks, must be undertaken with subjects who report they have aphantasia. If results from spatial visualization tests show that people with aphantasia have low spatial visualization ability, along with low object visualization ability, yet are successful in
mathematics, they must be compensating with some other representation method. To determine whether spatial visualization ability can be considered “low,” there must be a baseline against which to compare, which is why this study is designed as a comparison study between people with aphantasia and people who do not have aphantasia.
7 Conceptual Framework
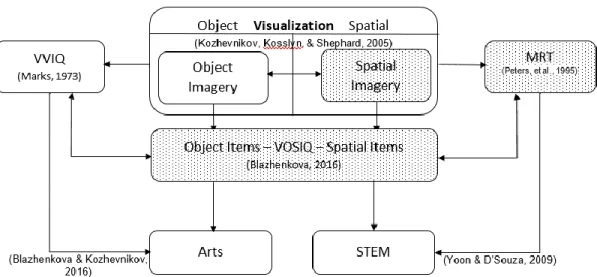
The design of this study aligned with previous research on visualization and mathematics, as well as the existing research on aphantasia. As indicated previously, studies have shown that there are two categories of visualization: spatial and object, corresponding to spatial and object imagery respectively (e.g., Chabris, et al., 2006). Other research has linked performance on spatial visualization ability tasks like the MRT to mathematics performance (e.g., Hegarty & Kozhevnikov, 1999), and performance on object visualization tasks such as the Fragmented Pictures task to object visualization ability (e.g., De Winter & Wagemans, 2004). Object visualization ability has been linked to self-efficacy and ability in the arts, while spatial visualization ability has been linked to self-efficacy and ability in STEM fields (e.g., Kozhevnikov, Kosslyn, & Shephard, 2005). Blazhenkova (2016) found strong correlations between responses on the object items of the VOSIQ and responses to the VVIQ, and between responses to the spatial items of the VOSIQ and performance on the MRT. This would seem to show that vividness of object imagery as measured on the VOSIQ is a satisfactory representation of object visualization ability; while vividness of spatial imagery is a satisfactory representation of spatial visualization ability. Figure 2 represents the conceptual framework of this study.
8
Figure 2. Conceptual framework. Graphic of how this study aligns with current research. Greyed boxes indicate the focus of this study regarding aphantasia.
Research Questions
The study addressed the following research questions:
1. Is the vividness of mental imagery of people with aphantasia significantly lower than the vividness of mental imagery of people without aphantasia?
a. Object Imagery b. Spatial Imagery
2. Is mental rotation test performance of people with aphantasia significantly lower than mental rotation test performance of people without aphantasia?
a. Accuracy b. Speed
3. Is there a significant correlation between mental rotation test performance and vividness of mental imagery?
9 b. Accuracy – Object Imagery c. Speed – Spatial Imagery d. Speed – Object Imagery
4. Is the level of self-efficacy in Arts/STEM independent of whether a person has aphantasia?
a. Arts b. STEM Definition of Terms
The definitions of the key terms used throughout this study are listed below:
1) Ability: Possessing capacity and/or talent to perform a task.
2) Aphantasia: The inability to create mental images of objects not in sight. This condition is characterized by a score of less than 30 on the Vividness of Visual Imagery Questionnaire (VVIQ; Marks, 1973; Zeman et al., 2015).
3) Arts: Fields in creative pursuits, such as literature, visual arts, music, dance, theater, etc. 4) Mental Imagery: Representation in the mind of an object that is not present.
5) Object Imagery: Pictorial representation in the mind dealing with attributes like shape, texture, and color of an object.
6) Self-efficacy: Belief in the capability of performing various activities (Bandura, 1982). 7) Spatial Imagery: Relational representation in the mind dealing with attributes like 3D
structure, location, and motion.
8) STEM: Fields in science, technology, engineering, and mathematics; including computer science.
10
9) Vividness: “the quality of the subjective imagery experiences in terms of their clarity and richness, sense of reality, and resemblance of actual perceptual experiences” (Blazhenkova, 2016, p. 491).
10)Visualization: The creation of a mental representation of an object when the object is not present (Presmeg, 2006).
11
Chapter Two: Literature Review
This section of the paper will give a broad overview of the history of research on visualization and how it has been broken down into object and spatial. The review will then delve into visualization research from the perspectives of cognitive psychology and
neuroscience. Next, the section will outline the theorized relationship between object and spatial visualization ability and the vividness of visualization will be outlined. Finally, the review will discuss current research on aphantasia.
Summary of Search Methodology
Literature for this review was gathered from both internet and in-print sources. Internet sources included Google Scholar, PsychINFO, ERIC, and JSTOR, while in-print sources included reprints of journal articles that were unavailable online and books from the VCU Libraries system. The search began with the keywords “aphantasia mathematics” using the VCU Libraries website, restricting results to peer-reviewed articles. This initial search returned no relevant results. The term was then shortened to just “aphantasia,” which returned four dissertations and three articles. The dissertations were conceptual in nature and none dealt directly with aphantasia. Of the three articles, two focused on aphantasia, while the third article was a review of the second. To widen the search, the single word “aphantasia” was used as a Google Scholar search term, which returned two further conceptual articles. Because of the lack of results, references from the aphantasia articles were then examined. I expanded the electronic and in-print searches to include the keyword visualization, which resulted in an overwhelming
12
amount of historical research, much of which did not meet this study’s definition of the term as the production of mental imagery. Therefore, the search was narrowed by using more specific terms like mental imagery and linking visualization and mathematics. Using these search terms revealed decades of research on visualization and mathematics, as well as books and articles focused on visualization as a cognitive process to create mental imagery and conceptual works on mental imagery itself. This line of research documented the bifurcation of object and spatial visualization, and the term “object spatial visualization” became the new keyword to continue the search. This term resulted in articles about the relationship each type of visualization had with preference, achievement, and career choice. Following along this path also led to ongoing neuroscientific research into object and spatial visualization as a neurological process that could be measured using methods such as functional magnetic resonance imaging (fMRI).
Visualization
Visualization is a complicated concept. In the research literature, the word visualization has had many definitions. The term visualization has been defined as the perception of concrete images, the use of images to illustrate or solve problems, and the creation of mental imagery of an object in the mind when the object is not present (Presmeg, 2006). In their exhaustive
research into the concept of visualization in the context of educational research, Phillips, Norris, & Macnab (2010), grouped the various definitions into categories like those of Presmeg:
visualization objects (concrete images); introspective visualization (mental imagery); and
interpretive visualization (use of images to solve problems; p. 26). When the word visualization is used in terms of perception, it could mean the pictures in a storybook created to represent the author’s words that the reader sees. When used in terms of mental imagery, visualization could mean the creation of pictures in the reader’s imagination to represent the author’s words sans
13
visual stimuli. In this proposal, the term visualization will refer to the production of mental imagery of an object that is not in sight, as defined by Presmeg (2006) and Phillips, et al. (2010).
Because the very act is not observable, the study of mental imagery was the domain of philosophers for much of history, starting with Aristotle’s view that all thought was accompanied by pictures, or visual mental imagery (Faw, 2009). Many researchers attribute the start of the formal study of mental imagery to Sir Francis Galton. In 1880, Galton published an article detailing his inquiry into the vividness of individual mental imagery ability (Burbridge, 1994; Galton, 1880). Vividness of mental imagery refers to how clearly a person can “see”
representations in their mind’s eye without a visual stimulus. Galton explained that the reason for his imagery research was his own curiosity. After reading articles describing people who could “present mental pictures that may be scrutinised with nearly as much ease and prolonged attention as if they were real objects” (Galton, 1883, p. 83), and what he saw as his own “dim” mental imagery ability, he decided to investigate the phenomenon. Galton developed an open-ended questionnaire that was meant to measure three properties of a person’s vividness of mental imagery: illumination, definition, and colouring (Galton, 1880, p. 301). He asked 100 adult men, including 19 scientists, as well as 172 students, to complete the questionnaire. An example item from Galton’s instrument was, “think of some definite object -- suppose it is your breakfast-table as you sat down to it this morning -- and consider carefully the picture that rises before your mind's eye” (1880, p. 302). Galton created the instrument and chose his subjects with the assumption that the more educated, most notably the scientists, would possess the most vivid imagery ability and would be best able to explain the experience. Instead, his data collection revealed that the scientists he questioned seemed to have little to no idea what he meant by mental imagery. Given his preconceptions, he was quite surprised at the results he received
14
when polling people from what he called the “general society.” He wrote, “On the other hand, when I spoke to persons whom I met in general society, I found an entirely different disposition to prevail. Many men and a yet larger number of women, and many boys and girls, declared that they habitually saw mental imagery, and that it was perfectly distinct to them and full of colour” (Galton, 1880, p. 303). The results of this inquiry led Galton to posit that lower vividness of mental imagery was a characteristic of scientists and those with higher intelligence.
When discussing the obstacles to research on mental imagery, Shepard (1978) wrote, “What makes a mental image such a difficult thing to study empirically or even to clarify conceptually is that it is inherently internal” (p. 128). In fact, the study of mental imagery became a risky proposition in the scientific world after the rise of behaviorism as a psychological philosophy. According to Bower (1972), “many experimental psychologists cannot entertain thoughts about imagery without some deep sense of guilt associated with some forbidden taboos” (p. 51). However, over one hundred years after Galton, researchers in the fields of cognitive psychology, neuroscience, and education began to take a renewed and intense interest in the concept of mental imagery and published a copious amount of research on the topic. As an example, because of conflicting accounts of scientists claiming to actively use visualization in their work, Brewer & Schommer-Aikins (2006) set out to test Galton’s conclusions about the relationship between low vividness of mental imagery and scientists. Brewer & Schommer-Aikins (2006) believed that Galton was not testing vividness of mental imagery, but vividness of recall memory, which they proposed was an entirely different process. In their report, the authors include a quote from Albert Einstein where he denied that words played any role in his thought processes. Instead, Einstein said, “The psychical entities which seem to serve as elements in thought are certain signs and more or less clear images which can be ‘voluntarily’
15
reproduced and combined” (Brewer & Schommer-Aikins, 2006, p. 133). As further examples, the authors cited quotes from scientists like J.J. Thompson. Thompson wrote that when thinking of mechanical models, “an attempt is made to form an idea of something concrete, a model, for example, which will supply us with a mental picture of what may be taking place in the physical phenomena under consideration” (Brewer & Schommer-Aikins, 2006, p. 133). This evidence of scientists appearing to use mental imagery as a core part of their thinking and problem-solving led Brewer & Schommer-Aikin to use Galton’s original open-ended instrument on a group of scientists and a group of undergraduate students. Two raters then scaled the answers from one to five, where one represented no imagery at all and five represented the highest vividness of imagery. Analyzing this newly collected data, Brewer & Schommer-Aikins (2006) found that only 6% of the scientist subjects appeared to have “feeble imagery,” much different from what Galton concluded. However, the scientists in Brewer & Schommer-Aikins (2006) did show lower vividness of mental imagery on average when compared to the undergraduate subjects. The researchers suggested that it was possible that Galton’s conclusions were biased by his own belief in his theory (Brewer & Schommer-Aikins, 2006).
Object and Spatial Visualization
Research on visualization has also led to the proposition that there are two types of visualization: object and spatial. Object visualization refers to the generation of pictorial images and includes being able to clearly visualize shape, color, and texture, such as measured by Galton’s instrument. Spatial visualization refers to the generation of a schema that represents an object’s three-dimensional structure, motion, and location (Chabris, et al., 2006), which arguably could describe the type of visualization used by the scientists quoted by Brewer & Schommer-Aikins (2006). Spatial visualization ability has been strongly associated with mathematics
16
learning via psychological and neurological experiments. Table 1 offers a brief overview of terms used in the literature that describe two separate types of imagery and visualization. Table 1
Overview of Terms in the Literature
Author Object Spatial
Bower, 1972 what how
Kosslyn, Brunn, Cave, & Wallach,
1984
surface representation deep representation
Presmeg, 1986 concrete imagery pattern imagery
Van Garderen, 2006 pictorial schematic
Blazhenkova & Kozhevnikov, 2009,
p. 640
“objects and scenes in terms of their shape, colour
information and texture”
“object location, movement, spatial relationships and transformations and other spatial
attributes” Clements, 2014 holistic (as strategy) analytic (as strategy) Blazhenkova, 2016 color, texture, shape 3D structure, location,
mechanism
Cognitive psychology
The natural assumption when discussing mental imagery is that it is visual, that humans are creating pictures in their minds to study and manipulate for some purpose, be it recall or problem-solving. However, cognitive researchers have offered the theory that visualization is both pictorial and propositional. In 1972, Bower posed the idea that mental imagery is used to describe both the “how” and the “what.” This idea means that while there may indeed be visual pictures generated in the mind (the “what”), mental imagery can also be structural and represent the “how” of an object. In other words, some mental imagery is less of a picture of an object than a verbal or spatial depiction of the object and how it behaves or relates to its context. The
17
words “propositional” and “structural” may refer to what is known as spatial reasoning. Many researchers have made the argument for this idea of propositional or spatial mental imagery, either instead of, or in addition to, visual or object mental imagery.
Pylyshyn (1973) was another one of the first cognitive researchers to discuss the
possibility of non-visual mental imagery existing alongside visual mental imagery (object). As evidence of this, Pylyshyn wrote of a hypothetical experiment where a subject learns a paired word association such as “boy-play” after looking at an image of a boy playing. In his example, the subject would later be given the stimulus “boy,” recall the image of the boy, and immediately associate the word “play.” Pylyshyn wrote, “The problem remains, however, to explain why the subject in this case chooses to respond play and not throw or ball or catch or any of an unlimited number of words equally appropriate to that image. Presumably it is because he remembers more than is contained in the image” (1973, p. 7). Pylyshyn also believed that the activity of
generating mental imagery was separate from the processing of information. Shepard (1978), however, believed that object, or pictorial, imagery was a crucial actor in creativity and invention. As examples, he wrote of scientists who created theories that could have only been based on some sort of mental imagery or internal visualization, such as Faraday and his depiction of how electromagnetic fields exist in space (Shepard, 1978). It could be argued that the imagery Shepherd described as being used by Faraday could be placed into the “spatial” category of imagery because the depiction of electromagnetic fields deals with location, motion, and structure more than a realistic pictorial image.
Anderson (1978) wrote a review of the disagreement between what he referred to as “image theorists” who believed that mental imagery was strictly visual and “propositional theorists” who believed that mental imagery was only descriptive or spatial. By examining the
18
existing proposed cognitive models of visualization at the time, Anderson found that none of them were able to adequately explain the phenomenon of mental imagery and its processing. Anderson (1978) even suggested the use of multiple information processing models, each to fit a specific mental imagery task or tasks. In one of the bullet points of his conclusion, Anderson wrote, “The frequent criticisms made of the picture metaphor are not valid. One can have a viable dual-code model involving picture and verbal representations” (1978, p. 275).
Cognitive psychologist and neuroscientist Stephen Kosslyn has been working on a model of mental imagery since the 1970’s. Kosslyn viewed mental imagery and its manipulation as a logical system. He used the theories of computer science to create a computer model of mental imagery composed of data and processes (Kosslyn, Brunn, Cave, & Wallach, 1984). The “data” for this model were very similar to the idea of spatial and object mental imagery. Kosslyn (1981) theorized that mental imagery was made up of two components: a surface representation and a deep representation. The surface representation was described as “a quasi-pictorial representation that occurs in a spatial medium; this representation depicts an object or scene and underlies the experience of imagery” (p. 49), while the deep representation “is the information in long-term memory that is used to generate a surface representation” (p. 49). In Kosslyn’s (1981) model, both the surface and deep representations could be acted upon by various processes: image generation, image inspection, and image transformation. The representations were theorized to be used for image retrieval and transfer between the long- and short-term memory stores by using the deep representation to construct the surface representation. Other systems-thinking cognitive psychologists described mental imagery processing in terms of the activities of perception, manipulation, storage, and retrieval in the context of working memory (e.g., Baddeley, 1988; Logie, 2014; Logie & Pearson, 1997, Pearson, 2001). Baddeley (1988)
19
theorized that mental imagery is stored by a visuo-spatial sketchpad. In Baddeley’s theory, the sketchpad is the storage place in working memory that contains the necessary object and spatial information to set up and manipulate mental visual images, which is very like Kosslyn’s
definition of surface and deep representation. Baddeley (2007) offers further evidence of the dissociation of visual and spatial information in working memory from a Logie & Marchetti (1991) study which showed that recall of a sequential series of colors was disrupted by showing the subjects images, and the ability to recall sequential order was disrupted by movement of the subject’s arm.
In their 1997 experiment on the development of the visuo-spatial sketchpad (VSSP) in working memory, Logie & Pearson found that there was evidence that both object and spatial representations are stored in the VSSP for use in working memory. The researchers tested groups of children on their recall and recognition of pattern and motion. The children were separated into three age range groups: five to six; eight to nine; and 11 to 12 years old. The results showed that the subjects’ ability to recall and recognize patterns increased rapidly with age, while the ability to recall and recognize motion seemed to develop more slowly. This led to the conclusion that visual and spatial skills developed at different rates, meaning that these skills were
independent. More recent cognitive psychology experiments have used different types of instruments and tests that target either object (pictorial) or spatial (structural or propositional) visualization. These instruments will be discussed in the Measurement section of this paper. Results from these experiments have provided even more evidence of the two styles of visualization (e.g., Blazhenkova & Kozhevnikov, 2010; Burton & Fogarty, 2003).
20 Neuroscience
Before the availability of reliable neuro-imaging, researchers had to rely on subjective self-report, supposition, or inferences from observable experiments to collect data on
visualization. Recent neuroscientific research has allowed scientists to analyze brain activation patterns and locations, supporting the distinction between object and spatial visualization that cognitive psychologists have theorized. Studies have found that there are two types of brain activation for these two different components of mental imagery (e.g., Botez, Olivier, Vézina, Botez, & Kaufman, 1985; Carlesimo, Perri, Turriziani, Tomaiuolo, & Caltagirone, 2001; Kosslyn, Ganis, & Thompson, 2001; Mishkin & Ungerleider, 1982). fMRI and ERP studies have discovered that there are two separate visual pathways in the brain, the dorsal and the ventral, which process spatial and object imagery respectively (e.g., Wang, et al., 1999). Studies have also found spatial visualization and mental rotation task ability differences between
genders. In most research over the past three decades, males have shown a higher level of spatial visualization and mental rotation task ability than women (Casey, Nuttall, & Pezaris, 1997; Debelak, Gittler, & Arendasy, 2014; Fennema & Sherman, 1977; Fennema & Tartre, 1985), even manifesting in differing areas of brain activation during visualization tasks (Jordan, Wüstenberg, Heinze, Peters, & Jäncke, 2002; Logie, Pernet, Buonocore, & Della Sala, 2011; Weiss et al., 2003). However, Moè (2009) wrote that self-efficacy plays a large part in mental rotation task performance for females. In their meta-analysis of the research on the gender differences in mental rotation task ability, Maeda & Yoon (2013) reported that the mental rotation test performance gap between males and females increases when the task is timed, which may indicate that the two genders may be using different strategies.
21 Object vs. Spatial Visualization Ability
Currently, most of the existing literature points to visualization being both object and spatial. Research on object-spatial visualization reveals that people prefer one or the other type of visualization, each of which has its own connection to education and preferred profession (e.g., Blazhenkova & Kozhevnikov, 2016; Yoon & D’Souza, 2009). Blazhenkova &
Kozhevnikov (2016) found that people with stronger, more vivid object imagery tended to select professions related to the arts, while people with stronger vividness of spatial imagery preferred STEM fields. Of course, visualization ability is not the sole predictor of career or chosen field of study. Wai, Lubinski, & Benbow (2009) found that females with high spatial ability more often enter creative fields in the arts, in contrast to males with high spatial ability who more often enter STEM fields. So, even when both genders display the same level of spatial ability, affect,
attitudes, and societal norms may play a part in education and career planning.
Research has also found that people with higher vividness of object imagery are better with autobiographical memory than those with low vividness of object imagery (Sheldon, Amaral, & Levine, 2017). Vannucci, Pelagatti, Chiorri, & Mazzoni (2016) found a significant correlation between high vividness of object imagery, fantasy proneness, and the frequency of specific types of video game play; a correlation that was not found in those with high vividness of spatial imagery. Yoon & D’Souza (2009) studied college students enrolled in design and architecture and found that object visualizers preferred to work in two dimensions and use familiar materials, while spatial visualizers preferred working in three dimensions with less concern about materials. In their comparison between college students majoring in interior design and those majoring in architecture, Yoon & D’Souza wrote, “it was also found that architecture students scored significantly higher in spatial visualization.” Because architecture is
22
considered a STEM field (Wai, et al., 2009), these results would seem to lend credence to the connection between spatial visualization ability and mathematics self-efficacy and achievement.
Measurement
While the study of mental imagery was once considered impossible because of the lack of observability, the subject has become increasingly important because of the possible implications for psychology and education. Most measurement of mental imagery ability has been based upon statistical analyses of the results of self-report surveys or the evaluation of performance tasks. Survey instruments have mostly focused on vividness of object mental imagery. Galton’s (1880) visualization questionnaire was intended to measure vividness, which included sharpness and brightness (or definition and illumination); color; “extent of field of mental view” (p. 310); ability to project an image onto a surface; and the size of mental images compared to the actual object. Of his purpose, he wrote, “I desire to define the different degrees of vividness with which different persons have the faculty of recalling familiar scenes under the form of mental pictures, and the peculiarities of the mental visions of different persons” (p. 302). He categorized the responses he received on his instrument into high, mediocre, and low faculty. While Galton focused on voluntary imagery, Betts (1909) used the work of Galton and Titchener (1909) to create a 150-item instrument to study the vividness of imagery that takes place during mental processes, or what he called “spontaneous imagery.” Sheehan (1967) created and validated the results from a shortened form of the Betts instrument. Sheehan explained that the Betts
questionnaire measured the vividness of seven types of imagery: “Visual, auditory, cutaneous, kinaesthetic, gustatory, olfactory, and organic” (p. 387). Marks (1973) created the Vividness of Visual Imagery Questionnaire (VVIQ) that is still in frequent use today (e.g., Blazhenkova, 2016; Campos, 1995; McKelvie, 1995; Zeman et al., 2015). The VVIQ is a self-report
23
questionnaire that asks respondents to describe how vividly they “see” described images in their minds using a Likert-type scale. The original VVIQ (Marks, 1973) grouped items after a prompt such as, “Visualize a rising sun. Consider carefully the picture that comes before your mind’s eye” (p. 24). The prompt was then followed by items asking the respondent to visualize certain aspects of the prompt. For example, one item following the prompt was, “Clouds. A storm blows up, with flashes of lightning” (p. 24). The response options were numbered from one to five, from most vivid to least vivid. Marks (1973) wrote the options as follows: 1) Perfectly clear and as vivid as normal vision; (2) Clear and reasonably vivid; (3) Moderately clear and vivid; (4) Vague and dim; and (5) No image at all, you only “know” that you are thinking of the object” (p. 18). The VVIQ relies exclusively on a person’s own opinion of what they are seeing with their mind’s eye.
With the distinction between two key varieties of mental imagery, object and spatial (Mishkin & Ungerleider, 1982), researchers developed other scales to measure object-spatial visualization ability and preference, as well as vividness of object-spatial visualization. Blazhenkova, Kozhevnikov, & Motes (2006) developed the Object-Spatial Imagery
Questionnaire (OSIQ) in response to cognitive and neuroscientific research that “emphasized a key distinction in visual information processing, namely, that there is a distinction between processing object properties and processing spatial relations” (p. 242). The items on the OSIQ target object or spatial visualization ability, and the response options are a scale from one to five, from total disagreement to total agreement respectively. As explained previously, object
visualization is when one imagines pictorial representations dealing with attributes like shape, texture, and color. Spatial visualization is associated with relational representations like 3D structure, location, and motion. An example of an object-related OSIQ item is, “My images are
24
colourful and bright,” while an example of a spatial-related OSIQ item is, “My images are more schematic than colourful and pictorial” (Pitta-Pantazi & Christou, 2010, p. 106). Keogh & Pearson (2017) used the OSIQ, VVIQ, and the spontaneous use of imagery scale (SUIS) in conjunction with the binocular rivalry task to compare the physical response and subject perception of visualization between people with aphantasia and a control group. Keogh & Pearson found that participants with aphantasia “were not impaired on their spontaneous use of spatial imagery” (2017, p. 6).
While the OSIQ was created to measure ability and preference, the Vividness of Object-Spatial Imagery Questionnaire (VOSIQ) was developed to measure the vividness of spatial and object imagery (Blazhenkova, 2016). The VOSIQ used the same response options as the VVIQ (Marks, 1973). An example VOSIQ item that targets the vividness of object imagery is, “Fine details of a zebra’s skin,” while “Mechanism of a door handle” targets vividness of spatial imagery (Blazhenkova, 2016, p.499). Results from validation studies of the VOSIQ show that (1) Marks’ VVIQ (1973) almost exclusively measures object imagery and (2) there is a trade-off between object and spatial visualization (Blazhenkova, 2016). Psychological and neuroscientific research has revealed that people have a natural preference and aptitude for either object or spatial visualization and are better at one than the other (Kosslyn & Thompson, 2012; Pitta-Pantazi & Christou, 2010).
A 1971 factor analysis of tests used in mental imagery research revealed that while spatial and image representation appear to be independent, results from subjective imagery measures were significantly affected by the social desirability factor. This suggests that
subjective reports on imagery may not be enough to stand on their own without some objective measure (Di Vesta, Ingersoll, & Sunshine, 1971). In their exhaustive review of instruments used
25
to measure object and spatial visualization ability and imagery vividness, Pearson, Deeprose, Wallace-Hadrill, Heyes, & Holmes (2013) evaluate performance task measures as well as subjective survey instruments that have been used extensively in research on mental imagery in psychological disorders. The authors separate the measures into the domains of image
generation, image maintenance, image inspection, mental rotation, restructuring and
reinterpretation, and mental synthesis. Pearson et al. (2013) state that objective performance tasks and subjective self-report instruments should be used together. As an example of that approach, when Blazhenkov (2016) validated the VOSIQ, she used alternative performance tasks to obtain concurrent validity for the results. For object imagery, she used the VVIQ, as well as Fragmented Pictures and Camouflage Pictures tasks. The Fragmented Pictures task gives subjects five minutes to discern objects from images of fragmented outlines (De Winter & Wagemans, 2004). The Camouflage Pictures task presents subjects with images of nature. The subjects are then given five minutes to find hidden objects in the pictures. Both tasks are meant to measure the ability of a person to perceive and recognize pictorial representations of whole objects.
To validate the spatial imagery portion of the VOSIQ, Blazhenkov (2016) added the Mental Rotation and Paper Folding tasks. Many variations of the mental rotation task have been developed, but one of the most used is from Vandenberg & Kuse (1978). The design of their task asks subjects to look at an irregularly shaped figure made of cubes. Subjects are then presented with what appear to be several images of the original figure rotated, but only two of the options are feasible rotations of that figure. The subjects have three minutes to select the options that are correct rotated representations. The Paper Folding task (Ekstrom, French, Harman, & Dermen, 1976) requires subjects to look at an image of folded paper and determine
26
how it would look unfolded. These tasks measure the subject’s ability to mentally manipulate objects in space. Blazhenkov (2016) correlated the results from the object imagery tasks and VVIQ with the responses on the VOSIQ object items, and the results from the spatial imagery tasks with the responses on the VOSIQ spatial items for concurrent validity of her scale. The VOSIQ may be a much more helpful measure than the VVIQ because it is measuring the vividness of both types of visualization.
Neuroscience has also lent its voice to objective measurement of the vividness of mental imagery. Cui, Jeter, Yang, Montague, & Eagleman (2007) first administered the VVIQ and then had the subjects perform a color naming task where they had to identify colors when they were flashed briefly in either color or word form. The researchers then used fMRI while their eight subjects were asked to create mental images of themselves either lifting weights or climbing stairs. Cui et al. (2007) found that there was a significant correlation between the results on the subjective measures and the measured relative activity (blood flow) in the early visual cortex of the brain. Their article states, “This finding is conceptually interesting because it shows that aspects of mental thought can be studied objectively with current technology (e.g., fMRI)” (p. 477). Another recent fMRI study found that a smaller primary visual cortex surface area was negatively correlated to the strength of mental imagery, and positively correlated with detail and location imagery (Bergmann, Genç, Kohler, Singer, & Pearson, 2016). This suggests that the trade-off hypothesized by object-spatial visualization researchers may be a factor of the size of the primary visual cortex. To quantify spatial visualization, neuroscientists have captured fMRI data while subjects are performing tasks like the Vandenberg & Kruse Mental Rotation test (1978). To measure object visualization, researchers have asked subjects to generate mental images based upon non-visual stimuli (Ganis, Thompson, & Kosslyn, 2004) during fMRI scans.
27
To date, the main purpose of fMRI implementation of visualization tests is less to measure ability than to determine which parts of the brain are activated when different subsets of the population are performing the tasks. Neuroscientific measurement allows for objective imagery testing but can also lend validity to the results of subjective self-report scales. Further, brain scans can be used to draw inferences on the relationship between brain activation patterns and measures like mathematics tests (de Hevia, Vallar, & Girelli, 2008).
Visualization and Mathematics
Even though the relationship between spatial ability and mathematics is acknowledged by most mathematics education researchers, there is no concrete explanation for this relationship. In her book about individual differences in mathematics, Dowker (2005) posited that verbal ability is a more important factor in mathematics than spatial ability, but she did write that spatial ability does have a direct relationship to geometry. Dowker also wrote that the relationship between spatial ability and types of mathematics other than geometry has not been proven. In a 1981 study, researchers found that high spatial visualization ability had less influence on mathematical performance than verbal-logical ability (Lean & Clements, 1981). However, Skagerlund & Träff (2016) used a mental rotation task to measure spatial transformation ability and found that mental rotation ability served as a predictor of overall mathematics ability.
Lean & Clements (1981) defined spatial ability as “the ability to formulate mental images and to manipulate these images in the mind.” This is slightly different from how other studies have defined spatial ability. For instance, Blazhenkova (2016) defined spatial ability as “visualizing spatial relations and movements of objects and their parts, and spatial
transformations” (p. 492). The latter definition strips the creation of mental images from spatial ability, a view that is more aligned with the preponderance of research on mathematics and
28
spatial visualization. It has been theorized that spatial ability is used when dealing with the capacity of numbers on a number line, using information for complex mental calculations, or being able to understand mathematics facts in a deeper way (Booth & Thomas, 1999; Presmeg, 1986). An example of how intertwined spatial visualization and mathematics has been in the research is the van Hiele model of geometric thinking (Fuys, Geddes, & Tischler, 1988; Hershkowitz, 1989). In the van Hiele model, the very first level of geometric thinking is visualization (van Hiele, 1984). In his article on the role of visualization in mathematics learning, Arcavi (2003) described visualization in terms of seeing what is not seen, of using the mind’s eye to imagine, rotate, and transform objects that may or may not be within physical sight. He wrote that visualization is being able to see “what we are unable to see because of the limitations of our visual hardware” (p. 55). Applying this to mathematics, Arcavi (2003) meant that visualization allows humans to, among other tasks, see patterns in data, represent objects symbolically, and abstract information for problem-solving.
In his review of the research on spatial abilities and mathematics, Bishop (2008) identified and discussed four different categories of researchers that have been engaged to provide evidence of the spatial-mathematical relationship: factor analysts; developmental psychologists; those focused on individual differences; and teaching experimenters. Clements (2014), in his own literature review on visualization and mathematics, also pointed out that the word visualization has had several meanings depending on the research focus. Clements wrote that psychologists have used the term in the context of factor analysis, meaning that
psychological researchers tend to study the acts of perception and mental imagery to identify the underlying structure of the behavior. In this definition, visualization has been broken down into the types of strategies people use to visualize; for instance, analytic and holistic. Analytic
29
strategy corresponds to the idea of spatial visualization, where items are viewed in the mind’s eye by their structure and the way the parts of the item fit together. Holistic strategy refers to object visualization, where an item is viewed as more of a concrete, whole pictorial
representation. In a 1996 study on spatial visualization ability and mathematics, Skemp (1996) studied girls with high and low spatial visualization ability. While both groups of girls
performed their mathematics tasks successfully, Skemp found that, when dealing with multiplication facts, girls with higher spatial visualization ability had what was called a
“relational” understanding, meaning that they understood the concepts beneath the multiplication facts. Girls with lower spatial visualization ability had a more surface understanding and
performed their mathematics tasks using rote memorization. The girls with lower spatial visualization ability were not able to translate the memorized mathematics facts to concrete representations, unlike the girls with higher spatial visualization ability (Skemp, 1996).
Given spatial visualization’s apparent role in mathematics learning, it is not surprising that this ability also appears to have an important relationship to participation in STEM fields (Wai, et al., 2009). Wai et al. wrote a review of spatial ability in STEM fields because “relatively little implementation of spatial ability is found for selection, curriculum, and instruction in educational settings— even in STEM domains, where it appears to be highly relevant” (p. 817). These researchers outlined what they referred to as “cumulative” psychological knowledge from studies on spatial ability and STEM subjects over the last half-century. In fact, some studies have recommended that spatial ability be measured outside of the mathematics domain as a means of recognizing potential talent for STEM fields (Shea, Lubinski, & Benbow, 2001; Wai, et al., 2009; Webb, Lubinski, & Benbow, 2007).
30
Researchers have also found that the different types of visualization ability have different relationships to mathematics domains. In her investigation of visualization in high school
mathematics, Presmeg (1986) utilized the Mathematical Processing Instrument (MPI), which consisted of different types of math problems intended to promote the use of some type of visual representation for solving. Presmeg identified five types of imagery: concrete; pattern; memory images of formulae; kinesthetic; and dynamic. Concrete imagery is pictorial in its representation of objects as contrasted to pattern imagery, which, like spatial imagery, strips pictorial details away and uses patterns between and among objects as representations. In this study, the highest performing student, who was classified as a “visualizer,” consistently used pattern imagery to solve problems. This result led Presmeg (1986) to cite a study by de Groot, where researchers flashed an image of a chess game situation for five seconds in front of different chess players. Only the ex-world champion chess player was able to recall perfectly where the chess pieces were placed on that image. However, this exact recall did not happen when chess pieces were placed randomly on a chessboard. This implied that the chess player’s familiarity with game play and his strategic expertise helped him to recognize the patterns on the board in the “real-life” situation, as opposed to the randomly placed pieces which would never happen during a match. A different study on expert chess players cited by Presmeg (1986) found that expert chess players in blindfolded matches did not use concrete, or object, visualization, they used pattern imagery, or spatial visualization. The data from her own study of high school mathematics, along with the studies described above, led Presmeg to the conclusion that spatial imagery is the
optimal visualization strategy for mathematics problem-solving. She reported that concrete imagery could impede mathematics problem-solving for some visualizers because they may be
31
unable to abstract the concrete image into pattern form. This also had negative implications on the use of realistic pictures in mathematics textbooks to illustrate problems.
Supporting Presmeg’s (1986) work, another group of researchers studied the relationship of abstraction to mathematics problem-solving (Campbell, Collis, & Watson, 1995). Campbell, et al. investigated the link between vividness of object imagery, logical, or spatial, operation ability, and problem-solving ability. They found no correlation between problem-solving ability and vividness of object imagery, but a positive correlation between spatial operation and
problem-solving abilities. This suggests that the ability to create images “rich” in detail and realism is not as important to mathematics problem-solving as the ability to abstract those images into logical constructs. In 1999, Hegarty & Kozhevnikov attempted to classify types of visual-spatial representations and their relationships to mathematical problem-solving. In their study, 33 young male participants completed mathematics problems from the MPI, as well as several spatial and verbal skills measures. These researchers found a positive correlation for what they called schematic imagery – equivalent to Presmeg’s pattern imagery or spatial imagery - and successful problem-solving, and a negative correlation between the use of pictorial imagery and problem-solving (Hegarty & Kozhevnikov, 1999).
Van Garderen (2006) published a study on visualization and spatial ability using young participants of different levels of academic ability (gifted, average, and students with learning disabilities). Participants in this study completed two spatial ability scales and used the MPI to solve word problems by drawing representations. The representations were then classified as “pictorial” or “schematic.” She found significant positive correlations between the use of
schematic imagery and performance on the MPI and two spatial measurement instruments, and a negative correlation between pictorial imagery and spatial skills. This seemed to indicate that
32
students with low spatial visualization skills tended to use pictorial imagery, while students with higher spatial visualizations skills used schematic imagery. Using fMRI in this context,
O’Boyle, Cunnington, Silk, Vaughan, Jackson, Syngeniotis, & Egan (2005) compared the brain activation patterns of males identified as gifted in mathematics as they completed mental rotation and matching tasks with the brain activation patterns of males who had not been identified as mathematically gifted. O’Boyle et al. (2005) found significant differences in areas and strength of brain activation patterns between the two groups, but only during the mental rotation task. During the mental rotation task, the gifted subjects showed significantly greater activation in areas of the brain associated with “spatial attention [15], working memory [14], the parsing of executive processes into strategic and evaluative error detection, conflict resolution, and the online monitoring of performance” (O’Boyle et al., 2005, p. 585). This objective measure of the difference in brain activity during the mental rotation task between those with high talent in mathematics versus those with average mathematics skill lends weight to the spatial-mathematics dynamic.
Khooshabeh & Hegarty (2010) studied how color and shape are used by high and low spatial visualizers during a mental rotation task of irregular shapes comprised of cubes. In one of their studies, the researchers used eye-tracking and participant verbalization during the task to find that low spatial visualizers used color cues to rotate shapes, while high spatial visualizers did not. This was very apparent when the researchers used consistent and inconsistent color blocks. When the color blocks were consistent with rotation, the speed and accuracy of the low spatial visualizers increased, while the high spatial visualizer speed and accuracy was not affected (Khooshabeh & Hegarty, 2010). In another interesting finding, Weckbacher & Okamoto (2014) report a positive correlation between mental rotation ability and student