The Effect of Changes in the U.S. Wage Structure on
Recent Immigrants’ Earnings
Darren Lubotsky
∗339 Wallace Hall
Research Program in Development Studies
Woodrow Wilson School of Public and International Affairs
Princeton University
Princeton, NJ 08544
[email protected]
September, 2001
∗I especially wish to thank David Card for his advice and encouragement. I also thank Alan Auerbach,
Kenneth Chay, Melissa Clark, Hilary Hoynes, Jonathan Leonard, Enrico Moretti, James Powell, Miguel Urquiola and participants in several seminars for their advice; and the staff of the California Census Research Data Center (CCRDC) for their help in facilitating my use of the confidential data. Financial support from the Robert Burch Center for Tax Policy Analysis, the Center for Labor Economics, and the Institute for Industrial Relations at U.C. Berkeley; the CCRDC; and the John D. and Catherine T. MacArthur Foundation is gratefully acknowledged. Part of the research in this paper was conducted while I was a research associate at the CCRDC in association with the Center for Economic Studies of the U.S. Bureau of the Census. Research results and conclusions are my own and do not necessarily indicate concurrence by the Bureau of the Census, the Center for Economic Studies, or the CCRDC.
Abstract
Since recent immigrants tend to earn less than natives, their relative labor market status has been adversely impacted by an increase in the return to labor market skills and widening wage inequality over the past two decades. To evaluate the magnitude of this effect, this study uses Social Security earnings records matched to recent cross– sections of the SIPP and CPS to estimate the change in the return to skills among native–born workers. This is then used to adjust the earnings gap between immigrants and natives in order to estimate what the gap would have been if the return to skills had remained at its 1980 level. The results suggest that the return to skills rose by 40 percent between 1980 and 1997, leading to a 10 to 15 percentage point decrease in the relative earnings of recent immigrants. Thus examining solely the earnings of recent immigrants may lead to an overly pessimistic picture of their actual labor market skills.
1
Introduction
Nearly ten million immigrants legally entered the United States between 1990 and 1998. The widely–held support for persistently high levels of immigration in the United States rests in large part on the success that past immigrant generations had assimilating into the U.S. labor market and culture. However, according to both cross–sectional data from the decennial U.S. Census and recently available longitudinal data from Social Security earnings histories, the earnings disadvantage of new immigrants relative to native–born workers has steadily increased during nearly all of the post–World War II period. These trends have led to recent policy initiatives to encourage more high–skilled immigration and to restrict means–tested welfare benefits that are otherwise available to the American–born poor and their children.
A significant part of the decline in the earnings of new immigrants was caused by a shift in the national origin composition of immigrant groups, as immigration from Europe declined and that from developing countries in Latin America and Asia increased substantially. Com-pared to their earlier arriving counterparts, these immigrants tended to have more limited English proficiency and lower educational attainment, and went to schools of worse quality. Because of differences in labor market institutions and the level of economic development, they likely found it more difficult to transfer their home–country labor market skills to the United States.1
However, there have been other confounding influences on the immigrant–native earnings gap. During last quarter century the U.S. experienced a historic rise in earnings inequality. Since new immigrant groups earn less on average than natives, widening inequality will tend to increase the earnings gap between the groups, even in the absence of changes in the relative skills of the groups. The argument of this paper is that in order to meaningfully evaluate the relative labor market success of recent immigrant cohorts, it is crucial to take into account the effect of aggregate labor market changes.
1A selection of references on immigrant earnings in the United States are Borjas (1985, 1995), Chiswick
(1978), LaLonde and Topel (1992), Schoeni, McCarthy and Vernez (1996), and Schoeni (1997). Studies that use Longitudinal data from Social Security earnings records are Duleep (1999), Hu (2000), and Lubotsky (2000). Surveys are given in Borjas (1999) and LaLonde and Topel (1997).
Researchers have proposed many causal factors for recent changes in the wage structure, such as technological change, increased trade with developing countries, and institutional changes in the labor market.2 One clear factor associated with the changing wage structure was an increase in the return paid to labor market skills. Since immigrants, particularly recent arrivals, have on average less labor market skills than native–born workers, rises in the return to skills increase the earnings gap between immigrants and natives, just as they increase the earnings gap between high and low–educated workers.
This study uses new longitudinal earnings data from Social Security earnings records to estimate the change in the return to overall labor market skills between 1980 and 1997, and then uses this estimate to ask what the earnings of immigrants who arrived in the U.S. would have been had the price of skill remained at its 1980 level. The change in the return to skills is identified by decomposing the variance in earnings within groups of native–born workers with similar educational attainment and labor market experience into a component based on skill and one based on luck or other non–productivity influences. Under the assumption that the within–group variance in skills is constant over time, the return to skills is estimated from changes in the proportion of the total earnings variance that is attributable to the skill component. The results indicate that the return to skills rose by about 40 percent during this time period. Adjusting the immigrant–native earnings gap by this factor shows that, had the price of skill remained at its 1980 level, by the late 1990s the earnings of immigrants who arrived between 1980 and 1984, 1985 and 1989, and 1990 and 1994 would have been higher by about seven, ten, and fifteen percentage points, respectively. These differences are large, accounting for between 25 and 35 percent of the total immigrant–native earnings difference, and indicate that changes in the U.S. wage structure had a sizable influence on the labor market outcomes of recent immigrants.
LaLonde and Topel (1992) examined immigrant earnings in the 1970s and were the first to decompose changes in the immigrant–native earnings gap into changes in skills and changes in the wage structure. Their method assumes that, in the absence of skill assimilation,
2 On changes in the structure of wages in the 1980s and 1990s see Bound and Johnson (1992), Katz and
Murphy (1992), Juhn, Murphy and Pierce (1993), DiNardo, Fortin and Lemieux (1996), and Katz and Autor (1999).
immigrant groups would experience the same change in earnings over the 1970s as did native– born workers who began the decade at the same point in the earnings distribution. The difference between the immigrant group’s actual wage change and the counterfactual wage change is due to skill accumulation. Among their findings is that Mexicans who immigrated to the United States between 1965 and 1969 experience a 14 percentage point increase in their wages relative to natives over the 1970s, but that if not for changes in the wage structure, their earnings would have been 8 percentage points higher in 1980 than they actually were. This study builds on LaLonde and Topel’s work in two important ways: first it examines immigrants who arrived between 1980 and 1997, the period when the largest changes in the wage structure occurred. Second, because this work is based on longitudinal earnings data from Social Security earning records, many problems encountered in past work can be over-come. Nearly all previous studies of U.S. immigrants follow synthetic arrival cohorts across decennial Censuses. However, as many as one–third of immigrants to the U.S. eventually return to their home country; thus, immigrant earnings growth and the extent to which it is affected by changes in the wage structure will be confounded with changes caused by selective outmigration. Lubotsky (2000) finds that lower–earning immigrants are more likely to leave the U.S. and, as a consequence, a comparison of an entry cohorts’ earnings across Censuses severely overstates the actual earnings growth experienced by immigrants who remained in the country. For example, the outmigration of low–earning Mexican immigrants in the 1970s means that the 14 percent earnings increase cited above is an overestimate of the earnings growth among Mexicans who remained in the country. The 8 percent effect of changes in the wage structure applies to the group of Mexicans who were in the U.S. in 1970; the effect is smaller for the higher–earning subset of Mexicans who remained in the U.S. until 1980. The end result is that selective outmigration by low earnings immigrants leads to an overestimate of both the effect of wage growth among immigrants and of the effect of changes in the wage structure. These confounding influences of outmigration are avoided in this study by the use of longitudinal earnings data for immigrants who remain in the U.S.
This study proceeds as follows: The next section of the paper describes the matched Social Security earnings data, highlights some of their strengths and weaknesses, and provides an initial picture of the evolution of the immigrant–native earnings gap during the 1980s and
1990s. Section 3 presents a model of wage determination with a time–varying return to skills. This model formally shows how changes in the immigrant–native earnings gap confound immigrant assimilation – the process by which immigrants accumulate labor market skills over time relative to natives – and changes in the return to labor market skills. Section 4 develops the identification strategy that first calculates the return to skills between 1980 and 1997, and then uses that information along with the immigrant–native earnings gap to calculate immigrants’ assimilation profiles. Section 5 presents the estimation results and Section 6 concludes.
2
The benefits and costs of using longitudinal Social
Security earnings data
Since as many as one–third of immigrants to the U.S. eventually leave the country, the composition of an immigrant arrival cohort changes over time. If below–average earning immigrants are more likely to leave, then estimates from repeated cross–sectional data will confound the earnings growth among immigrants who remain in the country with the rise in earnings brought about by the compositional change in the cohort. Edin, LaLonde and ˚
Aslund (2000) and Lubotsky (2000) provide evidence that this is, in fact, the case in Sweden and the United States, respectively. Longitudinal data are necessary to accurately estimate the earnings trajectory of immigrants who remain in the country.
The data used in this analysis are the 1990 and 1991 Survey of Income and Program Participation linked by individuals’ Social Security number to annual Social Security earnings records from 1951 to 1993, and the March Supplement to the 1994 Current Population Survey linked to earnings records from 1951 to 1997. The earnings records are from reports made by employers to the Social Security Administration for the purpose of assessing Social Security taxes on employees. These data are confidential and are used through an arrangement with the Center for Economic Studies of the U.S. Census Bureau.
The ability to accurately measure the earnings progress of immigrants who remain in the U.S. is the main benefit of these data compared to cross–sectional datasets used in nearly all previous studies. Nevertheless, there are some important limitations of the longitudinal
data. The remainder of this section first provides details of the data and how the sample used in this study is constructed. Next, six limitations of the data are addressed. The section concludes by comparing the raw earnings differences between immigrants and natives during the 1980s and 1990s.
The sample consists of men born between 1930 and 1969. Since most men work full–time, labor supply decisions do not pose as significant an issue as they would for an analysis of women. Men born before 1930 would be over 60 years old at the time of the 1990, 1991, or 1994 surveys; thus there is a risk that nonrandom mortality would bias the sample of older workers in favor of the more healthy. Those born after 1969 would be under 25 years old at the time of the 1990, 1991, and 1994 cross–sectional surveys, and may have not completed their schooling. Finally, a small number of people whose reported gender in the cross–sectional survey do not match that in the Social Security record or whose year of birth differed by more than two years in the two sources are not included in this analysis.
The Social Security records contain longitudinal information on an individual’s annual earnings and the number of quarters of covered employment in the year. Educational at-tainment, the date and place of birth, and other demographic information is available from the CPS or SIPP cross–sectional surveys. Individuals born outside of the United States are classified as immigrants. People born abroad to American parents, born in Puerto Rico or other outlying areas of the U.S., or who arrived in the U.S. prior to age 18 are not included in the sample. Longitudinal information is not available on how many weeks or hours worked each year, whether individuals were self–employed, where they lived, and when and where they obtained schooling or job training.
The first, and most important, limitation of the longitudinal data is that selective outmi-gration influences comparisons of earnings across immigrant arrival cohorts. Since the data are drawn from cross–sections of the 1990, 1991, and 1994 population, they represent the group of immigrants who choose to stay in the U.S. until that time. Therefore, the group of immigrants who arrived in 1980 is composed of people who chose to stay at least 10 to 14 years, while the group who arrived in 1990 may stay as short as a year before emigrating and still appear in the data. If immigrants with below–average earnings (or slower than average earnings growth) tend to leave the country sooner, then it will appear in these data as if
earlier arrival cohorts have a higher level (or a faster growth rate) of earnings. Thus, while longitudinal data allow for an accurate measure of the earnings trajectory among immigrants from the same arrival cohort, earnings differences across cohorts could be due to differences in labor market skills or to differential outmigration patterns. These issues are discussed more formally in Lubotsky (2000).
The second issue is that many illegal immigrants may not be represented in this data. Since the data only represent earnings covered by the Social Security system, illegal immi-grants (and natives) who work in informal, uncovered employment will not be represented, even if they participated in the CPS or SIPP survey. Immigrants who may have purchased a black market Social Security card would also not be in the sample unless the gender and birth year associated with the Social Security number matched their own. It bears mention, however, that since the coverage of illegal immigrants across decennial Censuses may have changed over time, compositional changes in immigrant groups may hamper that data. The comparability of immigrant earnings in the longitudinal data and in the more familiar CPS is addressed below.
The third issue is that discrepancies between immigrant’s reported year of arrival in the U.S. in the CPS or SIPP survey and the first year of earnings in the Social Security system create difficulties in assigning immigrants to arrival cohorts. The CPS and SIPP surveys record the year immigrants arrived in the U.S. “to stay.” However, 14 percent of immigrants in the matched dataset have Social Security covered earnings prior to their reported date of arrival. This is likely the result of immigrants moving back and forth between the U.S. and their birth country, and reporting their most recent date of arrival in the CPS or SIPP survey. Many immigrants do not have covered earnings until significantly after their reported date of arrival. This type of discrepancy is caused in part by immigrants who arrived in the U.S. illegally during the late 1970’s or the first half of the 1980’s and did not work in the covered sector, but were granted amnesty through the 1986 Immigration Reform and Control Act (IRCA) and began working in the covered sector at that time.3 Significant compositional changes in arrival cohorts arise as earnings data become available for newly
3See Bean, Edmonston and Passel, eds (1990) and Smith and Edmonston, eds (1997) for more information
legalized immigrants. Therefore, to maintain consistent cohorts, immigrants are classified into arrival cohorts based on their first year of covered earnings in the Social Security data (that is, their reported date of arrival is ignored). The cohorts are 1980 to 1984, 1985 to 1989, and 1990 to 1994.
The fourth issue is that not all respondents in the three cross–sectional datasets are matched to earnings records. The primary reason for this is that an individual refused to give his Social Security number – or gave the wrong number – to the survey interviewer. The match rate for the native born population is 84 percent in the CPS, and 91 and 87 percent in the two SIPPs. The proportion of immigrants who are matched is lower, so that among immigrants who arrived in the 1980s and 1990s, only 62 percent of immigrants in the CPS and 75 percent immigrants in the SIPP are matched to earnings records.
To correct for selection bias induced by non–random matches to Social Security earnings data, population weights are computed for the matched subsample to reflect the observ-able characteristics of the full cross–sectional population. Specifically, let p(x) denote the probability that a person with characteristics x is matched to an earnings record. If that observation is matched and used in the analysis, his weight is given by wi/pˆ(xi), where wi is the population weight from the CPS or SIPP cross–sectional survey and ˆp(xi) is the esti-mated match probability. The cross–sectional survey weights are rescaled such that within each survey the weights sum to one. The probability of a match to Social Security earnings records is estimated with a logit model that includes controls for educational attainment, a square in potential labor market experience, weeks and hours worked, a square in reported earnings (in the CPS or SIPP), and indicators for Hispanics, nonwhites, Hispanic nonwhites, Asians, as well as for those who did not work in the survey year or were self–employed, worked in agriculture, for the government, or in the private sector. The model is estimated separately by cross–sectional year and by natives and the three immigrant arrival cohorts.4 Since earnings reported in the cross–sectional survey are used to construct the match proba-bilities, unobservable factors (such as motivation or ability) that are correlated with earnings and may be more prevalent among the matched subsample are, to an extent, incorporated into the weights.
The fifth issue with the Social Security earnings data is that only an individual’s annual earnings that are covered by the Social Security system are recorded. An earnings record of zero dollars in a given year reflects someone who was not employed that year, was outside of the United States, or whose only earnings were from informal or other uncovered employment. Some people work entirely in the uncovered sector and thus will not have any Social Security earnings, though they may report their uncovered earnings in the Census, CPS, or SIPP surveys. It is not possible to distinguish between immigrants who are legal residents of the U.S. and work in jobs not covered by the Social Security system, and immigrants in the U.S. legally or illegally who work “under the table” and do pay taxes on their earnings. Other workers may have earnings in both the covered and uncovered sectors, and thus their earnings in the longitudinal dataset are only a portion of their total earnings.
To gauge how well covered Social Security earnings reflect the more familiar earnings reported in the CPS, Table 1 compares the full sample of workers in the March Supplement to the 1994 CPS (which records total earnings from 1993) with the 1993 Social Security earnings record. This comparison suggests that the issues of coverage and matching discussed above do not significantly detract from the benefits of using the longitudinal Social Security earnings data.
The first two columns of Table 1 display the average reported log earnings among the full sample and the subsample that is matched to Social Security earnings records, as well as the earnings gap between each immigrant cohort and natives, the standard error of the earnings gap, and the (unweighted) sample size. Because reported earnings in the CPS are heavily clustered at round numbers, the comparison of medians is problematic. Table 1, therefore, reports means, after censoring CPS earnings at $57,600, the Social Security taxable maximum in 1993. Topcoded observations in both the CPS and longitudinal earnings records are multiplied by 1.38. This factor approximates the uncensored mean among the artificially topcoded observations in the 1994 CPS. In addition, for this table only, immigrants are classified by their date of arrival reported in the CPS, rather than by their first year of covered earnings. This is necessary because immigrants who are not matched to earnings data cannot be classified by the latter method. Finally, observations with annual earnings below $1000 are dropped from this table.
Using CPS earnings data, differences in reported earnings between natives and immi-grants are seven to thirteen percentage points smaller among the matched subsample than among the full CPS sample. However, when the matched immigrants are reweighted to re-flect the observable characteristics of the full CPS sample (column three), the earnings of the matched sample are similar to those of the full sample. The differences are less than three percentage points apart. The fourth column reports the earnings and earnings gaps based on the 1993 Social Security earnings record for the matched subsample. About 6.5 percent fewer natives have Social Security earnings than report earnings in the CPS (= 1−21,296/22,781) and average Social Security earnings among natives are about 11 percent lower than the re-ported earnings in the CPS. However, the earnings gaps between natives and immigrants based on Social Security earnings records are quite similar to those based on CPS–reported earnings: Using the weights to account for non–matches (columns three and five), the dif-ferences between the gaps measured with the CPS data and with the Social Security data are three and ten percentage points for the 1980–84 and 1985–89 cohorts, and are equal for the 1990–94 cohort. Based on these comparisons, the use of Social Security earnings data, rather than the familiar self–reported earnings in the CPS, does not systematically affect immigrant–native earnings comparisons.
The sixth and final issue with the Social Security data is that earnings are censored at the taxable earnings ceiling in each year.5 In 1980 the tax ceiling was $25,900, which left 16.1 percent of the sample censored. Throughout the 1980s and 1990s the tax ceiling was adjusted to keep up with inflation; in 1997 the ceiling was $65,400 and 13.4 percent of the sample is censored. Prior to the late 1970s the tax ceiling was considerably lower and in many years close to one half of the sample has censored earnings. Although the econometric procedures used below take into account the censored nature of the data, the fact that only a small proportion of the sample is censored in the 1980s and 1990s is an additional reason this study focuses on that period.
This section concludes by presenting, in Figure 1, data on the relative earnings of
im-5A small number of observations from the two SIPP sources are above the tax ceiling in a few years. This
may have arisen from people working two jobs during the year and the second employer over–withholding income for Social Security taxes. Since the reported earnings may still be censored, though at a higher level, earnings for these observations are replaced with the taxable maximum in that year.
migrants who entered the U.S. in 1980–84, 1985–89, and 1990–94. These are computed by estimating for each immigrant cohort a series of cross–sectional median (or least absolute deviation) regressions of annual earnings on an immigrant dummy variable and quartics in calendar time and potential experience, for each year that the group has been in the United States. The group that arrived between 1980 and 1984 entered the labor market with earnings about 65 percent below natives, though within five years the gap closed by 35 percentage points. This is an interesting group since it comprises an unusually large group of refugee immigrants from Afghanistan, Cambodia, Cuba, Ethiopia, Haiti, Laos, Vietnam, and former Soviet bloc countries. Indeed, in 1981 alone over 155,000 refugees, 26 percent of the total number of non–refugee immigrants, were approved to emigrate to the United States. That fraction averaged 9.4 percent, and was never higher than 12 percent, between 1982 and 1993 (See the Statistical Yearbook of the Immigration and Naturalization Service
(various issues)). The data here are consistent with that presented in Cortes (2001), who shows that between the 1980 and 1990 Censuses, refugees had faster earnings growth than did other immigrants, possibly indicating that their low probability of leaving the United States led them to accumulate more U.S.–specific human capital.
The group that entered in the second half of the 1980s includes a large proportion of immigrants who were possibly in the U.S. prior to that time, but were only brought into the covered sector with the 1986 amnesty. Their first recorded earnings were 55 percent below natives, and the earnings gap closed by about 12 percentage points over the next 10 years. Finally, immigrants who entered in the early 1990s earned 58 percent less than natives upon entry. Unlike the earlier two arrival cohorts, the relative earnings of this group did not increase during their first six years in the U.S.
One reason for the declining rate of (relative) earnings growth across the three cohorts is that immigrants with slower than average earnings growth may selectively emigrate from the U.S. As described at the beginning of this section, since immigrants can only be in the sample if they were in the U.S. in 1990, 1991, or 1994 when the SIPP and CPS surveys were taken, the earlier arrival cohorts are disproportionately composed of immigrants who chose to stay longer in the U.S. If immigrants who have slower earnings growth are more likely to emigrate in a given year, then in data collected at a single point in time, earlier
cohorts will appear to have faster earnings growth than more recent cohorts, even if at the time of arrival all groups have equal earnings growth potential. A similar type of effect may influence comparisons of the levels of earnings across cohorts. In light of these difficulties, one must be cautious in making comparisons across cohorts.
3
Changes in the structure of wages and the skills of
recent immigrants
This section details the key identification problem addressed in this paper; namely, how the earnings gaps just presented confound changes in the relative skills of immigrants with changes in the wage structure. Define wijt to be the earnings of person i at time t, where
j indexes native–born workers (j = n) and the three immigrant arrival cohorts (j = c). Suppose individual earnings are determined by a simple function of quartics in potential labor market experience and calendar time, a latent index of “skill” or “ability,” aijt, and an unobservable term,εijt, that represents measurement error and any nonproductivity–related influences on earnings. Specifically, earnings are given by
wijt=α+βf(Experienceijt) +γf(Yeart) +ψtaijt+εijt (1)
where β and γ are parameters in the experience and calendar–time quartics, and ψt is the return to skills in period t. Most applications of such earnings functions treat educational attainment as a sufficient measure for an individual’s skill level. Here it is useful to think about education as being one of many contributing factors to an individual’s skill. Other influences include school quality, family and neighborhood characteristics, language fluency, health, and cognitive ability. Since the skill index is not observed, some normalization on the productψtaijt is required, so the price of skill is set to one in 1980, the first year used in this study.
To model differences in skill levels between immigrants and natives, let immigrants’ skills be given by an additive function of a permanent arrival–cohort effect, kc, a time in the U.S. effect, yct, and an individual–specific skill component, ηict, as follows:
The skills of native–born workers consist only of the individual component (i.e. aint =
ηint). The individual skill (ηijt) and nonproductivity (εijt) components are assumed to be
independent of each other. The immigrant arrival cohort effect, kc, and the assimilation effect, yct, measure the permanent and time–varying differences in immigrant and native labor market skills. kc is negative if immigrants arrive in the U.S. with a lower skill level than natives; yct is zero upon arrival but becomes positive as immigrants accumulate skills faster than do natives. With larger sample sizes and richer data on individual characteristics, one might want to generalize the model above by also allowing the skill components to vary by immigrants’ country of origin, age at migration, social and employment connections, language ability, or refugee status, for example.
Equations 1 and 2 are a “single–index” model of skills. Card and Lemieux (1996) explore a similar model in the context of black–white wage differentials and conclude that such a model provides a reasonably good descriptive device for changes in the wage structure during the 1980s. A key feature of single–index models is that, in the absence of differential skill accumulation between groups of workers, groups with similar earnings in a base period will experience similar wage changes over time. This motivates LaLonde and Topel (1992) to measure immigrant skill accumulation in the 1970s as the difference between immigrant earnings growth and the earnings growth of natives who began the decade at a similar point in the earnings distribution.
To see this, and how changes in the price of skill affect the relative earnings of immigrants more generally, note that conditional on the age and period effects, the expected value of the earnings gap between new immigrants and native–born workers at timet= 0 is equal to the product of the skill gap upon arrival and the return to skill that prevails at that time:
GAPc0 = E(wic0|Experienceijt,Yearijt)−E(win0|Experienceijt,Yearijt) =ψ0kc (3) Thus, even if more recent immigrants had the same skill deficit relative to natives as did earlier arrival cohorts, a rising price of skill would generate a decline in the entry earnings across cohorts.
the relative increase in immigrant skills due to labor market assimilation, ycs:
GAPcs = E(wics)−E(wins) =ψs(kc+ ycs) (4) where the expectations are conditional on experience and calendar time. The magnitude of immigrant–native earnings convergence between time t = 0 and t = s is given by the difference in the earnings gaps at those times:
∆GAPc = [E(wic10)−E(win10)]−[E(wic0)−E(win0)] = (ψs−ψ0)kc+ψsycs (5) Changes in the return to skills over time will change the observed earnings gap between immigrants and natives through permanent skill differences. Therefore, without knowing how ψt changes over time, the process of assimilation cannot be identified from observed changes in the earnings gap between immigrants and natives.
In addition, the effect of the relative human capital accumulation by immigrants on earnings depends on the time period in which the immigrant worked in the U.S. Immigrants who arrive when the return to skill is relatively low will experience a slower rate of earnings growth (over and above the earnings growth of the native base) than will immigrants with a similar skill assimilation profile but who arrived when the return to skill was higher.
LaLonde and Topel’s measure of assimilation is essentially given by the product ψsycs in equation 5 (rather than simply ycs). Since they consider earnings changes between two points in time, 1969 and 1979, this amounts to measuring skill accumulation in 1979 skill prices. Since this study utilizes 18 years of annual data with immigrants observed during different periods of time, it is important to measure skill changes for all groups using a constant price of skill, and here the 1980 price is used.
Butcher and DiNardo (1998) take a complementary approach to the counterfactual change in immigrant earnings by estimating what the distribution of recent immigrants’ earnings would look like if they faced the same return to observable characteristics, such as education, race, and ethnicity, as did recent immigrants in 1990. By focusing on changes in observables, Butcher and DiNardo are able to pinpoint those particular characteristics that have most influenced changes in the earnings gap. Indeed, they find that much of the decline in the relative earnings of recent immigrants can be attributed to changes in the return to observable
characteristics, particularly race and ethnicity. LaLonde and Topel’s and this study analyze the total skill gap, which includes skills unmeasured by surveys.
4
Identification of the return to skills and immigrant
assimilation
This section details the procedures used to identify the return to skills and thereby the immigrant–native skill gap. At a point in time, the immigrant–native earnings gap is the product of the price of skills and the skill gap. The skill gap is identified, therefore, by first estimating the return to skills and then using it to deflate the empirical earnings gap into a skill gap (much like how one would compute the real change in the price of a good from nominal prices and a price index).
The return to skills is estimated from changes in the variance of native–born workers’ earnings over time within narrowly defined education and experience cells. Natives alone are used to compute the return to skills because the large number of observations permits the sample to be broken down into skill groups with large sample sizes. The variance of immigrants’ earnings depends on the permanent (kc) and assimilation (yct) components in equation 2, and immigrant cells based on these characteristics, in addition to education and labor market experience, would be quite small. Since immigrants make up only about 12 percent of the workforce, the loss in efficiency from using only the sample of natives to estimate the return to skill is likely to be small.
Instead of indexing natives and immigrant arrival cohorts, let j now represent more narrowly defined education and experience cells among natives. The five education groups are those without a high school degree, high school graduates without any college, high school graduates with between one and three years of college, four–year college graduates, and those with any post–graduate education. The six five–year labor market entry cohorts are 1960–64 to 1985–89. From equation 1, the variance in earnings within groupj in period
t is given by
Var(wijt) =ψ2tVar(aijt) + Var(εijt) (6) To identify the return to skills, the variance of the individual unobservable skill
com-ponent (ηijt) is assumed to be constant over time, though it may vary across groups. The variance of the nonproductivity component (εijt) is assumed to be constant across groups, but may vary over time. This decomposition of the variance in earnings into a permanent and transitory component is common in the literature. However, most other studies use the time series properties of the earnings variance as a source of identification. See, for example, MaCurdy (1982) and Moffitt and Gottschalk (1995). The method used in this section is based on the model developed by Chay and Lee (1999) and does not require the autoco-variance structure of earnings to be known. Instead, the large cross–sectional sample size is exploited to identify the parameters through restrictions on the variance in earnings across skill groups.
Under these assumptions, the within–group variance in earnings can be written as
Var(wijt) = ψt2σηj +σεt (7) With the above restrictions, the return to skills parameterψt can be identified from changes over time in the within–group variances. In particular, increases in the return to skill lead to changes in the within–group earnings variance that are proportional to the permanent com-ponent of variance,σηj. In contrast, increases in the noise or measurement error component lead to increases in earnings variance that are constant across groups.
The parameters in equation 7 are estimated with minimum distance methods. Leth(θ) =
ψ2
tσηj+σεt be the (j×t)–row vector of the theoretical cell variances, stacked by group and
time. θ is the set of 2t+j−1 parameters, ψt,σηj, andσεt (where the return to skill in 1980 is normalized to be one). The parameters are estimated by minimizing the distance between the empirical cell variances and their theoretical counterparts. Specifically, ˆθ is given by:
ˆ
θ = argmin(Var(wijt)−h(θ))0W(Var(wijt)−h(θ)) (8) where W is a diagonal weighting matrix. Altonji and Segal (1996) show that sampling error in the estimated earnings variances is correlated with sampling error in the estimated variance–covariance matrix of the cells. This may lead to a small sample bias in the estimated parameters if the inverse of the variance–covariance matrix is used as the weighting matrix in equation 8. To avoid this problem, the diagonal matrix of cell sample sizes is used as a
weighting matrix. The variance of ˆθ is given by:
Var(ˆθ) = (h0Wh0)−1h0WΩWh0(h0Wh0)−1 (9) where h0 = ∂h(θ)/∂θ and Ω is an estimate of the variance–covariance matrix of the cells variances.
Since the earnings data are censored, the observed earnings variance within the skill– group cells will be smaller than the true variance. In addition, changes in the fraction of the sample censored from year to year may influence the observed variance in earnings. To estimate the within–group earnings variance while accounting for the topcode, it is assumed that the log of earnings is normally distributed. The variances are estimated by running a separate tobit model of log earnings on a constant term, for each skill group in each year. If the parametric assumption is true, this maximum likelihood procedure delivers an efficient and unbiased estimate of the earnings variance. The effect of possible misspecification of the earnings distribution is minimized, however, since the proportion of the sample that is censored is low and stable after 1980. The tobit procedure is then bootstrapped to obtain an estimate of the variance–covariance matrix of the cell variances (Ω) that is robust to within–group serial correlation, which may be present due to the longitudinal structure of the data.
The skill gap between immigrants and natives can be identified from estimates of the earnings gap and the return to skills. From equation 3, the permanent skill gap between natives and 1980 arrivals is given by the ratio of the earnings gap to the price of skill in 1980 (which is normalized to be one):
k80= ˆ GAP80,80 ˆ ψ80 = ˆ GAP80,80 1 (10)
That is, the entire earnings gap upon arrival is attributed to the skill difference between immigrants and natives. One might be concerned that immigrant–native earnings differences also reflect labor market discrimination against immigrants, or the tendency of immigrants to live in cities with large existing immigrant stocks, thereby depressing the groups’ earnings (see Greenstone (1998)). No attempt is made here to disentangle these possible effects from earnings differences arising from skills.
The earnings gap upon entry for groups that arrived in the U.S. after 1980 will overstate their initial skill gap if the price of skill has risen. For example, the permanent skill gap for the 1990 arrivals is given by k90 = GAPˆ 90,90
ˆ
ψ90 <
ˆ
GAP90,90 if ψ90> ψ80≡ 1.
The effect of ten years of U.S. labor market experience on the relative skills of immigrants is given by ycs in equation 4: y80,90 = GAPˆ 80,90 ˆ ψ90 − k80 = ˆ G80,90 ˆ ψ90 − ˆ G80,80 (11)
The quotient, GAPˆˆ 80,90
ψ90 , is the earnings gap in 1990 deflated by the relative increase in the
price of skill (recall that ψ80 ≡ 1), which can be interpreted as the skill gap in 1990 (or equivalently as what the earnings gap would have been in 1990 if the return to skill did not change). Thus assimilation is measured as the difference in the skill gap between 1990 and its initial level in 1980.
Since recent immigrants are grouped into three five–year arrival cohorts (1980–84, 1985– 89, and 1990–94), the return to skills used in equations 10 and 11 is a weighted average of the return to skills among the immigrants within each cohort. For example, the return that prevailed during the 1980–84 arrivals’ first year in the labor market is given by ψ =
α80ψ81+α81ψ82+α82ψ83+α83ψ84+α84ψ85, where theα’s are the share of the 1980–84 cohort
that arrived in each year.
5
Estimation results
The panels in Figure 2 plot the change in the estimated earnings variance for native– born high school and college graduates, and the difference in median earnings between the two groups, from 1980 to 1997, for four cohorts of labor market entrants from 1965–69 to 1980–84. There is a clear upward trend in both the high school–college earnings gap and the variability in earnings among both groups. The initial level and the increase over time in the earnings variance is larger among the college educated groups than among the high school graduates. This relationship between the level and subsequent growth is consistent with the model of within–group variance given by equation 7.
The estimates of the return to skill and residual variance parameters from equation 7 are given in Table 2. Figure 3 plots the point estimates and includes for reference the overall trend in the earnings gap between high school and college educated workers. The return to skills is estimated to have increased by 31.4 percent over the 1980s and then increased by another 10 percentage points over the 1990s. These estimates are similar in magnitude to those in Card and Lemieux (1996) and Chay and Lee (1999). The residual variance increases sharply in 1981 (possibly due to the recession), but then declines smoothly until 1992, when it begins to increase. The high school–college earnings gap increased by about twice as much as the estimated return to skill during this period, nearly doubling from 28 to 53 percent.
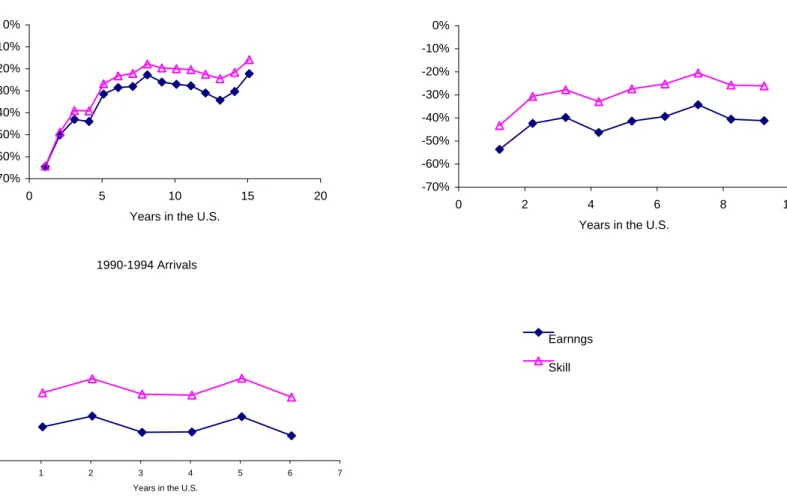
The immigrant earnings gaps given in Figure 1 are translated into skill gaps by the formulas in equations 10 and 11. The panels in Figure 4 plot the raw immigrant–native earnings gap for each of the three arrival cohorts in the 1980s and 1990s, along with the estimated skill gap. Upon arrival, median earnings among the 1980–84 cohort were 65 percent below that of natives. After ten years the earnings gap was only 28 percent, an increase of 38 percentage points. However, the skills of the 1980–84 arrivals increased faster than indicated by their increased earnings: after ten years the skill gap with natives was only 21 percent, an increase of 44 percentage points over the initial gap. Thus the relative increase in immigrant earnings understates their actual accumulation of skills by six percentage points.
Much of the rise in the return to skills had already occurred by the time the 1985–89 and 1990–94 immigrants entered the labor market. Thus the change in their earnings gap with natives closely parallels their change in skills. However, for both cohorts their entry earnings severely overstate the initial skill gap: the 1985–89 immigrants entered with median earnings 55 percent below natives. Evaluated at the 1980 price of skill, however, their labor market skills were only 44 percent less than natives. Similarly, the 1990–94 immigrants entered with an earnings gap of 58 percent, though their skill gap was only 43 percent below natives. To put these numbers in perspective, the relative earnings among all immigrants who arrived after 1980 grew by about 22 percent during their first ten years in the U.S. Recent increases in inequality reduced their earnings by ten to fifteen percent.
For comparison, LaLonde and Topel conclude that changes in the wage structure in the 1970s reduced the earnings of immigrants with less than 10 years of schooling who arrived
in the 1960s by two to five percentage points. Mexican immigrants who arrived during the 1960s experienced a five to eight percentage point decline. This, along with the evidence presented above, supports the widely held view that changes in the wage structure in the 1980s were more profound than those in the 1970s or 1990s.
6
Conclusion
Since new immigrants to the United States earn less on average than native–born workers, widening wage inequality over the past twenty years has increased the earnings gap between the groups. The estimates presented above indicate that the return to labor market skills rose by 40 percent between 1980 and 1997. If, instead, the price of skills had remained at its 1980 level, the earnings of immigrants who arrived between 1980 and 1994 would have been between six and fifteen percentage points higher at the end of the period, depending on their date of arrival.
This study used longitudinal earnings data on immigrants who remained in the U.S., and thus, unlike much previous research, the estimated earnings and skill progression is not influenced by selective outmigration. Selective outmigration does, unfortunately, limit the comparisons that can be made across immigrant arrival cohorts.
Immigrant skill accumulation is not the only criterion used to judge immigrants’ success or to evaluate alternative policies, however. Immigrants’ overall wellbeing, and analyses of taxation, welfare, and other program participation depend on immigrants’ earnings. The message of this paper is that, in order to compare recent immigrants to earlier arriving cohorts, or to forecast based on the experience of recent immigrants in the U.S., one needs to keep in mind that the economic ground beneath these immigrants was shifting. Their earnings progress understates their rate of labor market assimilation. Future immigrants who are otherwise similar to those who arrived in the recent past may experience faster earnings growth if the return to labor market skills does not continue to rise.
References
Altonji, Joseph G. and Lewis M. Segal, “Small–Sample Bias in GMM Estimation and Covariance Structures,” Journal of Business and Economics Statistics, July 1996, 14
(3), 353–366.
Bean, Frank D., Barry Edmonston, and Jeffrey S. Passel, eds, Undocumented Mi-gration to the United States: IRCA and the Experience of the 1980’s, Washington, D.C.: Urban Institute Press, 1990.
Borjas, George J., “Assimilation, Changes in Cohort Quality, and the Earnings of Immi-grants,” Journal of Labor Economics, 1985, 3, 463–489.
, “The Economics of Immigration,” Journal of Economic Literature, December 1994,
32, 1667–1717.
, “The Economic Analysis of Immigration,” in Orley Ashenfelter and David Card, eds.,
Handbook of Labor Economics, Vol. 3, Amsterdam, The Netherlands: Elsevier Science B.V., 1999, chapter 28.
Bound, John and George Johnson, “Changes in the Structure of Wages in the 1980’s: An Evaluation of Alternative Explanations,”American Economic Review, 1992, 82(3), 371–392.
Butcher, Kristen F. and John DiNardo, “The Immigrant and Native–born Wage Distri-bution: Evidence from United States Censuses,” Working Paper 6630, National Bureau of Economic Research July 1998.
Card, David and Thomas Lemieux, “Wage Dispersion, Returns to Skill, and Black– White Wage Differentials,”Journal of Econometrics, 1996, 74, 319–361.
Chay, Kenneth Y. and David S. Lee, “Changes in Relative Wages in the 1980’s: Returns to Observed and Unobserved Skills and Black–White Wage Differentials,” April 1999. Unpublished manuscript, University of California, Berkeley.
Chiswick, Barry R., “The Effect of Americanization on the Earnings of Foreign–born Men,”Journal of Political Economy, October 1978, 86 (5), 897–921.
Cortes, Kalena E., “Are Refugees Different from Economic Immigrants? Some Empirical Evidence on the Heterogeneity of Immigrant Groups in the United States,” Working paper 41, Center for Labor Economics, University of California, Berkeley July 2001.
DiNardo, John, Nicole M. Fortin, and Thomas Lemieux, “Labor Market Institutions and the Distribution of Wages, 1973–1992: A Semiparametric Approach,” Economet-rica, September 1996, 64(5), 1001–1044.
Duleep, Harriet Orcutt, “Immigrant Earnings Growth 1960–1990: Initial Insights from Longitudinal Data on Individuals,” 1999. Unpublished manuscript, Urban Institute.
Edin, Pers-Anders, Robert J. LaLonde, and Olof ˚Aslund, “Emigration of Immi-grants and Measures of Immigrant Assimilation: Evidence from Sweden,” Working paper 00.20, Harris School of Public Policy Studies, University of Chicago September 2000.
Greenstone, Michael, “The Wage Consequences of Enclave Residence: Evidence from the 1990 and 1980 Censuses,” Working paper 6, Center for Labor Economics, University of California, Berkeley November 1998.
Hu, Wei-Yin, “Immigrant Earnings Assimilation: Estimates from Longitudinal Data,”
American Economic Review Papers and Proceeding, May 2000, 90 (2), 368–372.
Juhn, Chinhui, Kevin M. Murphy, and Brooks Pierce, “Wage Inequality and the Rise in the Returns to Skill,”Journal of Political Economy, 1993, 101, 410–442.
Katz, Lawrence F. and David H. Autor, “Changes in the Wage Structure and Earnings Inequality,” in David Card and Orley Ashenfelter, eds., Handbook of Labor Economics, Vol. 3, The Netherlands: Elsevier Science B.V., 1999, chapter 26.
and Kevin M. Murphy, “Changes in Relative Wages, 1963–1987: Supply and De-mand Factors,” The Quarterly Journal of Economics, February 1992, 107, 35–78.
LaLonde, Robert J. and Robert H. Topel, “The Assimilation of Immigrants in the U.S. Labor Market,” in George J. Borjas and Richard B. Freeman, eds., Immigration and the Work Force, Chicago: The University of Chicago Press, 1992, pp. 67–92.
and , “Economic Impact of International Migration and The Economic Perfor-mance of Migrants,” in Mark R. Rosenzweig and Oded Stark, eds., Handbook of Popu-lation and Family Economics, Vol. 1B, Amsterdam, The Netherlands: Elsevier Science B.V., 1997, chapter 14.
Lubotsky, Darren H., “Chutes or Ladders? A Longitudinal Analysis of Immigrant Earn-ings,” Working paper 445, Industrial Relations Section, Princeton University August 2000.
MaCurdy, Thomas E., “The Use of Time Series Processes to Model the Error Structure of Earnings in a Longitudinal Data Analysis,”Journal of Econometrics, 1982,18, 83–114.
Moffitt, Robert A. and Peter Gottschalk, “Trends in the Autocovariance Structure of Earnings in the U.S.: 1969–1987,” Working Paper 355, Department of Economics, The Johns Hopkins University July 1995.
Nevo, Aviv, “Using Weights to Adjust for Sample Selection,” Unpublished manuscript, University of California, Berkeley August 1998.
Schoeni, Robert F., “New Evidence on the Economic Progress of Foreign–Born Men in the 1970’s and 1980’s,” The Journal of Human Resources, 1997, 32(4), 683–740.
, Kevin F. McCarthy, and Georges Vernez, The Mixed Economic Progress of Immigrants, Santa Monica, CA: Center for Research on Immigration Policy, RAND, 1996.
Smith, James P. and Barry Edmonston, eds, The New Americans: Economic, De-mographic, and Fiscal Effects of Immigration, Washington, D.C.: National Academy Press, 1997.
U.S. Immigration and Naturalization Service, Statistical Yearbook of the Immigra-tion and NaturalizaImmigra-tion Service, Washington, D.C.: U.S. Government Printing Office, Various issues.
Full Matched Reweighted Matched Reweighted
sample subsample subsample subsample subsample
Natives Log earnings 10.16 10.17 10.16 10.06 10.05 Sample size 27,052 22,781 22,781 21,296 21,296 Immigrant cohorts 1980-85 Log earnings 9.79 9.87 9.81 9.79 9.73 Earnings gap -36.60% -29.46% -34.81% -27.08% -32.05% Standard error (3.63) (4.32) (4.44) (5.03) (5.00) Sample size 750 517 517 462 462 1986-89 9.66 9.74 9.65 9.71 9.65 -49.64% -42.96% -50.59% -35.14% -39.74% (4.10) (5.81) (5.43) (6.33) (5.78) 560 320 320 286 286 1990-94 9.58 9.71 9.60 9.57 9.49 -58.17% -45.33% -55.46% -49.12% -55.48% (5.02) (6.47) (6.17) (7.49) (7.10) 456 254 254 203 203
Note: 1993 CPS earnings are individuals' self-reported wage and salary, self-employment, and farm income from the 1994 CPS. These earnings are topcoded at the 1993 Social Security maximum of $57,600. Topcoded observations in both datasets are multiplied by 1.38 to approximate the uncensored mean. Only observations with positive earnings are used. Earnings gaps are computed as the difference in log earnings between each immigrant cohort and all natives. The means given in the first, second, and fourth columns are weighted by the March Supplement weights. The means in the third and fifth columns are reweighted by the probability of each individual in the public use file being matched to earnings records. See text for details. Sample sizes are unweighted. Observations with annual earnings less than $1000 ($1993) are dropped. Standard error of the earnings gap given in parentheses.
Table 1: Average Immigrant and Native Earnings in the March 1994 CPS and Social Security Earnings Data
Year Return to Standard Residual Standard
skill error variance error
1980 1.0000 - 0.2574 0.0040 1981 0.8895 0.0312 0.2910 0.0068 1982 1.0604 0.0289 0.2669 0.0065 1983 1.0362 0.0318 0.2823 0.0067 1984 1.0796 0.0348 0.2795 0.0084 1985 1.1460 0.0313 0.2499 0.0064 1986 1.2446 0.0391 0.2400 0.0083 1987 1.1797 0.0365 0.2518 0.0075 1988 1.2674 0.0375 0.2435 0.0078 1989 1.3141 0.0391 0.2375 0.0076 1990 1.3211 0.0402 0.2300 0.0077 1991 1.3008 0.0363 0.2345 0.0060 1992 1.3910 0.0417 0.2324 0.0080 1993 1.3970 0.0416 0.2458 0.0082 1994 1.3495 0.0430 0.2647 0.0083 1995 1.3983 0.0450 0.2581 0.0092 1996 1.3834 0.0471 0.2630 0.0100 1997 1.4140 0.0510 0.2721 0.0105
Average skill variance
High school graduates 0.0773 0.0018
College graduates 0.1979 0.0061
Number of cells 525
Table 2: Return to Skill Estimation Results
Note: See text for estimation details. The average skill variance for high school and college graduates is an unweighted average among the respective cells.
Figure 1: Median Immigrant Earnings in the 1980s and 1990s
Relative to natives
Note: Earnings gaps are based on cross-sectional LAD models conditional on experience and calendar time effects. See footnote 55 for details. The sample size of the 1980-84 cohort is 473, for the 1985-89 cohort it is 839, and for the 1990-94 cohort it is 366.
-70% -60% -50% -40% -30% -20% -10% 0% 0 2 4 6 8 10 12 14 16
Years in the U.S.
Immigrant earnings relative to natives
1980-84 1985-89 1990-94
Figure 2: High School - College Earnings Gap and Earnings Variance
1980-1997, by period of labor market entry
Note: The solid lines plot the change in the variance in earnings of high school and college graduates, computed by the method of maximum likelihood. The dotted line is the change in the earnings gap between the two groups. Only native-born workers are used. See text for details. Below each graph is the level in 1980 (1985 for the 1980-84 entrants) of the variance in earnings among high school and college graduates, and the difference in the log of earnings between the groups.
1965-69 labor market entrants
0 0.1 0.2 0.3 1980 1985 1990 1995 Change since 1980
1970-74 labor market entrants
0 0.1 0.2 0.3
1980 1985 1990 1995
1975-79 labor market entrants
-0.1 0 0.1 0.2 0.3 1980 1985 1990 1995 Change since 1980
1980-84 labor market entrants
-0.1 0 0.1 0.2 0.3 1980 1985 1990 1995
High school graduates College graduates Earnings gap
Figure 3: The High School-College Earnings Gap, Return to Skills, and Residual Variance
Note: The level of the high school-college earnings gap is 27.9 percent in 1980; the level of the residual variance is 0.257. The high school-college earnings gap is computed from a series of median regressions that also condition on a quartic in potential labor market experience. See text for details.
0.8 1.0 1.2 1.4 1.6 1.8 2.0 1980 1982 1984 1986 1988 1990 1992 1994 1996 Year Level relative to 1980
High school-college earnings gap Return to skills
Note: Figures show the relative earnings and skill gaps between immigrants and natives. See text for details.
Figure 4: Immigrant-Native Earnings and Skill Gaps in the 1980s and 1990s
1980-1984 Arrivals -70% -60% -50% -40% -30% -20% -10% 0% 0 5 10 15 20
Years in the U.S.
Earnings/skills relative to natives
1985-1989 Arrivals -70% -60% -50% -40% -30% -20% -10% 0% 0 2 4 6 8 10
Years in the U.S.
1990-1994 Arrivals -70% -60% -50% -40% -30% -20% -10% 0% 0 1 2 3 4 5 6 7
Years in the U.S.
Earnings/skills relative to natives
-70% -60% -50% -40% -30% -20% -10% 0% 0 1 2 3 4 5 6 7 Earnngs Skill