Novice Java Programming Mistakes:
Large-Scale Data vs. Educator Beliefs
NEIL C. C. BROWN and AMJAD ALTADMRI, University of Kent, UK
Teaching is the process of conveying knowledge and skills to learners. It involves preventing misunder-standings or correcting misconceptions that learners have acquired. Thus, effective teaching relies on solid knowledge of the discipline, but also a good grasp of where learners are likely to trip up or misunderstand. In programming, there is much opportunity for misunderstanding, and the penalties are harsh: failing to produce the correct syntax for a program, for example, can completely prevent any progress in learning how to program. Because programming is inherently computer-based, we have an opportunity to automatically observe programming behaviour – more closely even than an educator in the room at the time. By observ-ing students’ programmobserv-ing behaviour, and surveyobserv-ing educators, we can ask: do educators have an accurate understanding of the mistakes that students are likely to make? In this study, we combined two years of the Blackbox dataset (with more than 900 thousand users and almost 100 million compilation events) with a survey of 76 educators to investigate which mistakes students make while learning to program Java, and whether the educators could make an accurate estimate of which mistakes were most common. We find that educators’ estimates do not agree with one another or the student data, and discuss the implications of these results.
Categories and Subject Descriptors: K.3.2 [Computers And Education]: Computer and Information Sci-ence Education
General Terms: Experimentation, Human Factors
Additional Key Words and Phrases: Programming Mistakes; Educators; Blackbox; Java
ACM Reference Format:
Neil C. C. Brown and Amjad Altadmri. 2016. Novice Java Programming Mistakes.ACM2, 3, Article 1 (May 2016), 22 pages.
DOI:http://dx.doi.org/10.1145/0000000.0000000
1. INTRODUCTION
Educators typically form opinions on which mistakes students are likely to make and use this to inform their teaching. Textbooks often feature such opinions: “Failing to use equals() to compare two strings is probably the most common single mistake made by Java novices” [van der Linden 2004], “The most common mistake made with an if-statement is the use of a single equal sign to compare equality” [Hoisington 2012], “A common mistake in for-loops is to accidentally put a semicolon at the end of the line that includes the for statement” [Cadenhead 2012]. If these opinions are used to inform teaching design and practice, it matters whether they are correct.
Accurate knowledge of likely student mistakes allows teaching approaches to be modified to guard against misconceptions or slips. There is some evidence in physics education [Sadler et al. 2013] that knowledge of common student misunderstandings This paper incorporates work from two previous papers [Brown and Altadmri 2014; Altadmri and Brown 2015]. See section 1.1 for how this paper differs from that previous work.Authors’ address: School of Computing, University of Kent, Canterbury, Kent, CT2 7NF, UK; emails: [email protected], [email protected].
Permission to make digital or hard copies of all or part of this work for personal or classroom use is granted without fee provided that copies are not made or distributed for profit or commercial advantage and that copies bear this notice and the full citation on the first page. Copyrights for components of this work owned by others than ACM must be honored. Abstracting with credit is permitted. To copy otherwise, or repub-lish, to post on servers or to redistribute to lists, requires prior specific permission and/or a fee. Request permissions from [email protected].
c
2016 ACM. 0000-0000/2016/05-ART1 $15.00
is related to teaching effectiveness. It is important for instructional design to be able to predict where students will likely err, and which topics need more explanation or practice. We believe that most educators will use their own intuition, knowledge and experience to predict which mistakes are most frequent or most important, but to our knowledge neither the accuracy of educators’ opinions, nor the true statistics in the large have been assessed.
There has been much previous work to examine the mistakes made by students within a single institution. A distinctive feature of the work reported in this paper is the scale of the student mistake data. The Blackbox data collection project [Brown et al. 2014] has now been running for over two years, during which time it has cap-tured data from almost 100 million compilations across over 10 million programming sessions from users learning Java in the beginners’ programming environment BlueJ. This dataset thus provides a new opportunity to examine novice programmers in a wide-scale, multi-institution, global dataset.
In this paper, we provide a detailed examination of mistakes that BlueJ users make, and we compare the frequency and time-to-fix for these mistakes to educators’ esti-mates of same. Our primary research questions (RQs) are as follows:
RQ1: What are the frequencies and times-to-fix of a specific set of eighteen Java mistakes by students in a large-scale multi-institution dataset?
RQ2: How do the patterns of these mistakes change over time for each user? RQ3: Do educators’ views form a consensus about the frequency and time-to-fix
of a specific set of eighteen Java mistakes by students?
RQ4: Do educators’ views of mistake frequency and time-to-fix match the ob-served frequencies and time-to-fix by students in a large-scale multi-institution dataset?
RQ5: Are more experienced educators’ views more likely to match the students’ data than those of novice educators?
The paper is organised as follows. We begin by reviewing related work in section 2. We introduce the set of programming mistakes that underpin our work in section 3 before providing an overview of the Blackbox dataset in section 4. In section 5, we pro-vide analyses of the frequencies and time-to-fix for these mistakes, analysing patterns by time. The second part of our work begins in section 6 where we examine the results of a survey of educators as to their estimates of the frequency and time-to-fix of our mistakes, and finally, we finish our work with a comparison of these estimates and the Blackbox data in section 7. Discussion and conclusions are provided in sections 8 and 9 respectively.
1.1. Contribution and Relation To Authors’ Previous Work
This paper features aspects of two previous conference papers. In our first conference paper [Brown and Altadmri 2014], we examined educators’ estimates of frequency only and compared them to the frequency in a four-month slice of the Blackbox data. In our second conference paper [Altadmri and Brown 2015], we provided an examination of error frequencies and time-to-fix for different errors over one year. In this capstone journal paper, we recap parts of this analysis:
— We detail eighteen mistakes we will use for our analysis, and provide statistics on mistake frequencies and time-to-fix for each mistake in the Blackbox dataset. — We provide data from a survey of computing educators, with predictions for the
frequency of each of the mistakes, and then compare these estimates to the Blackbox dataset.
For the analysis in this paper we use a larger dataset – two years of the Blackbox dataset – but the analysis is also expanded and improved in the following ways: — We provide an analysis of educators’ estimates for mistake time-to-fix, as well as
for mistake frequency, including a new cross-comparison: do educators’ estimates of frequency align with time-to-fix (i.e. do educators only see the errors the students have most trouble with)?
— We describe a new approach to ranking mistake importance, looking not just at frequency or time-to-fix exclusively, but combining the two into a total seconds ap-proach.
— We change how we analyse temporal data. Our earlier attempt looked at mistake frequencies and time-to-fix against calendar time, on the basis that student learn-ing would generally follow the academic calendar. However, this was vulnerable to several confounds, notably that the academic calendar varies globally. In this paper, we use a more parsimonious approach, looking at “user lifetime”: the time since the user first appeared in the data. Through this new lens, we re-analyse trends in mis-take frequency and time-to-fix over user lifetime, and thus investigate the learning that is taking place among the users.
2. RELATED WORK
2.1. Observing Student Errors
The concept of monitoring student behaviour and mistakes while programming has a long history in computing education research. The Empirical Studies of Program-ming [Soloway and Iyengar 1986] workshops in the 1980s had several papers making use of this technique for Pascal and other languages. More recently, there have been many such studies specifically focused on Java, which is also the topic of this study.
Many of these studies used compiler error messages to classify mistakes. Jadud [2006] looked in detail at student mistakes in Java and how students went about solving them. Tabanao et al. [2011] investigated the association between errors and student course performance. Denny et al. [2012] looked at how long students take to solve different errors, Dy and Rodrigo [2010] looked at improving the error messages given to students, and Ahmadzadeh et al. [2005] looked at student error frequencies and debugging behaviour. Jackson et al. [2005] identified the most frequent errors among their novice programming students. All six of these studies used compiler error messages to classify errors. However, work by McCall and K¨olling [2014] suggests that compiler error messages have an imperfect (many-to-many) mapping to student mis-conceptions. Additionally, all six studies looked at cohorts of (up to 600) students from a single institution.
The Blackbox dataset is novel in that it incorporates student mistakes from a much larger number of students (more than 900,000 over two years) from a large number of institutions1, thus providing more robust data about error frequencies. An ear-lier paper about Blackbox gave a brief list of the most frequent compiler error sages [Brown et al. 2014], but in this work, we do not simply use compiler error mes-sages to classify errors. Instead, we adapt error classifications from Hristova et al. [2003], which are based on surveying educators to ask for the most common Java mis-takes they saw among their students.
There has been other recent work on large-scale programming education datasets, although none looking in detail at mistake types in Java. Ahadi et al. [2016] looked at specific mistakes but in SQL. Jadud and Dorn [2015] looked at applying the general 1We have no way of measuring the number of institutions in the Blackbox data, but simply: the 900,000
error quotient measure to the Blackbox dataset, but did not investigate specific types of mistakes. Petersen et al. [2015] also investigated the error quotient measure on other large-scale datasets, and Ahadi et al. [2015] compared the measure against course performance. There have also been other studies on aspects of student behaviour (but not specific programming mistakes) [Spacco et al. 2013, 2015; Vihavainen et al. 2014]. An extensive review of such datasets was provided by a recent ITiCSE working group report [Ihantola et al. 2015].
2.2. Educators’ Opinions on Student Mistakes
Work by Spohrer and Soloway [1986] proposed to examine the accuracy of educator folk wisdom. However, they did not survey educators, and instead took two anecdo-tal pieces of folk wisdom about learning to program and then compared them to actual data from students (in Pascal). Ben-David Kolikant [2011] interviewed some educators about students’ approaches to programming, but at a higher level, without reference to a specific language. Hristova et al. [2003] surveyed a combination of local teaching assistants and students, as well as educators from 58 universities, asking about com-mon Java mistakes. This data was combined to form a list of 20 Java mistakes that were detectable at compile-time. We base our classification of mistakes on this work, but Hristova et al. did not test these predictions themselves against actual student data. As far as we are aware, our body of work is the first to survey educators about Java programming mistakes and compare their opinions to actual data.
3. PROGRAMMING MISTAKES
We use the 18 mistakes from our previous work [Brown and Altadmri 2014] as a basis for our analysis, which were derived from Hristova et al’s [2003] twenty student mis-takes (in turn derived from interviewing educators). The eighteen mismis-takes, labeled A through R, are informally categorized into syntax, semantics, and type errors and given shorthand for easier referencing as follows:
Misunderstanding (or forgetting) syntax:
A
eqSyn Confusing the assignment operator (=) with the comparison opera-tor (==).For example:if (a = b) ...
C
brktSyn Unbalanced parentheses, curly or square brackets and quotation marks, or using these different symbols interchangeably.For example:while (a == 0]
D
andOrSyn Confusing “short-circuit” evaluators (&&and||) with conventional logical operators (&and|).For example:if ((a == 0) & (b == 0)) ...
E
smiConSyn Incorrect semi-colon immediately after an if-condition or after thefor- or while-condition, which unintentionally forms the if/loop body. For example:if (a == b); return 6;
F
forSepSyn Wrong separators in for-loops (using commas instead of semi-colons)G
curIfSyn Inserting the condition of an if-statement within curly brackets in-stead of parentheses.For example:if {a == b} ...
H
keySyn Using keywords as methods’ or variables’ names. For example:int new;J
parCalSyn Forgetting parentheses after a method call.For example:myObject.toString;K
smiHdSyn Incorrect semicolon at the end of a method header.For example:public void foo();
{
...
}
L
cmpSyn Getting greater than or equal/less than or equal wrong, i.e. using=> or=<instead of>=and<=.For example:if (a =< b) ...
P
typCalSyn Including the types of parameters when invoking a method.For example:myObject.foo(int x, String s);Type errors:
I
calTyp Invoking methods with wrong arguments (e.g. wrong types). For example:list.get("abc")Q
rtnTyp Incompatible types between method return and type of variable that the value is assigned to.For example:int x = myObject.toString();
Other semantic errors:
B
strEqSem Use of==instead of.equalsto compare strings. For example:if (a == "start") ...M
statSem Trying to invoke a non-static method as if it was static. For example:MyClass.toString();N
discSem A method that has a non-void return type is called and its return value ignored/discarded.O
noRtnSem Control flow can reach an end of a non-void method without return-ing. For example:public int foo(int x)
{
if (x < 0) return 0; x += 1;
}
R
impSem A class claims to implement an interface but does not implement all the required methods.For example:class Y implements ActionListener { }
Note that mistake N-discSem (ignoring the non-void result of a method) is not al-ways an error (e.g. when you call a remove method that returns the item removed, you may not need to do anything with the return value).
We refer in this paper to mistakes, and do not seek to distinguish between mis-conceptions (longstanding confusion) and slips (occasional mistakes). This is because trying to provide an operational distinction between the two is difficult. How many times must one user make a mistake before it is considered a misconception rather than a slip? We would probably require an estimation of the number of opportunities to make a mistake, in order to normalise per-user – a task much more difficult than spotting the mistakes themselves. For the sake of parsimony we therefore only look at the counts of mistakes, without trying to further subcategorise.
4. BLACKBOX DATASET
BlueJ [K¨olling et al. 2003], released in 2003, is an Integrated Development En-vironment (IDE) designed to help beginners learn to program in Java. It is used worldwide, typically by students in their first year of university study. The Blackbox project [Brown et al. 2014] was begun in 2013 to allow BlueJ users to opt-in to a large-scale data collection project. Each BlueJ user is asked on the first load if they are will-ing to opt-in to data collection. Source code and compilation errors, among other data, is collected from opted-in users on the central Blackbox server. (Interested researchers can sign up and get access to the data.)
For the analysis in this paper, we used data from Blackbox for the two-year period from 1st September 2013 to 31st August 2015, inclusive. We looked for the presence of the mistakes listed in the previous section and calculated frequency and time-to-fix. Frequency is simply a count of the number of mistakes in the data set, ignoring the number of users who committed each mistake; because a Blackbox user does not necessarily correspond one-to-one with an actual person (e.g. if multiple people share one account), we generally shy away from using number of users or per-user statistics. We had two methods of detecting the mistakes. For four of the student mistakes, I-calTyp, M-statSem, O-noRtnSem, R-impSem, we were able to use the Java compiler error message directly from Blackbox’s compilations to detect the mistake. However, this was not possible for the other errors, as some do not consistently map to the same compiler error, and some are logical errors that do not cause a compiler error. Thus, for one of the other mistakes (C-brktSyn) we performed a post-lexing analysis (matching brackets), and for the final thirteen we used a customized permissive parser to parse the source code and look for the errors.
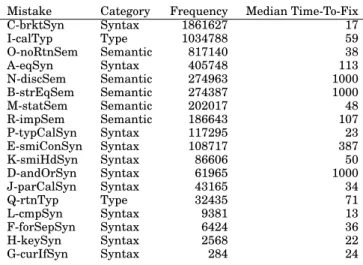
Table I. Frequency and median time-to-fix for the eighteen mistakes in the chosen two year subset of the Blackbox dataset, sorted by descend-ing order of frequency.
Mistake Category Frequency Median Time-To-Fix
C-brktSyn Syntax 1861627 17 I-calTyp Type 1034788 59 O-noRtnSem Semantic 817140 38 A-eqSyn Syntax 405748 113 N-discSem Semantic 274963 1000 B-strEqSem Semantic 274387 1000 M-statSem Semantic 202017 48 R-impSem Semantic 186643 107 P-typCalSyn Syntax 117295 23 E-smiConSyn Syntax 108717 387 K-smiHdSyn Syntax 86606 50 D-andOrSyn Syntax 61965 1000 J-parCalSyn Syntax 43165 34 Q-rtnTyp Type 32435 71 L-cmpSyn Syntax 9381 13 F-forSepSyn Syntax 6424 36 H-keySyn Syntax 2568 22 G-curIfSyn Syntax 284 24
Given the scale of the data we are working with, an automatic detector is neces-sary: manual detection of errors simply could not scale up to this size of data set. One possible problem with automatic detection is that our detectors may encounter false positives or false negatives. One known case when this can occur is if the code becomes unparseable; if our detectors cannot parse the code, it is impossible to know whether the error has been fixed or not, but parsing syntactically incorrect code is a larger topic beyond the scope of this work. Our own testing on a small subset of data suggested the detectors were accurate, but to allow for further corroboration, re-analysis or re-use, we have published the source code of all the tools we created2.
We took each source file in the dataset and tracked the file over time. At each compi-lation, we checked the source file for the eighteen mistakes. If the mistake was present, we then looked forward in time to find the next compilation where the mistake was no longer present (or until we had no further data for that source file). When the mistake was no longer found – which could have been because the mistake was corrected or because the offending code was removed or commented out – we counted this as one instance of the mistake. Further occurrences in the same source file were treated as distinct instances, and the number of instances was recorded asfrequency. We calcu-lated the time in seconds between the first appearance of the mistake and the possible fix, with a ceiling of 1000 seconds (just over 15 minutes), for any mistake which takes longer than 1000 seconds to fix, or is never fixed. This was recorded astime-to-fix.
Since our measure of time-to-fix looks forward to the next compile event, it is possible that if some users do not compile again immediately after fixing a mistake, this could inflate the time-to-fix. Because our detectors rely on compiler error messages and being able to parse the code, detecting whether the mistake was fixed between compilation is less reliable. So this is a potential weakness of our approach to measuring time-to-fix. 5. BLACKBOX ANALYSIS
Table I shows the frequency and median time-to-fix for each mistake in the dataset. The median is selected for time-to-fix to reign in the effect of the outlier students who are hitting the cap time of 1000 seconds. Mistake C-brktSyn [mismatched brackets] 2See: http://www.cs.kent.ac.uk/∼nccb/blackbox/
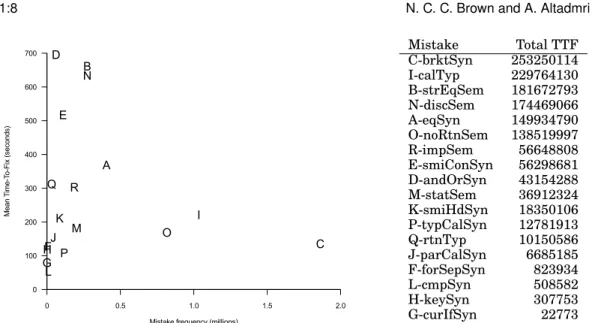
Mistake Total TTF C-brktSyn 253250114 I-calTyp 229764130 B-strEqSem 181672793 N-discSem 174469066 A-eqSyn 149934790 O-noRtnSem 138519997 R-impSem 56648808 E-smiConSyn 56298681 D-andOrSyn 43154288 M-statSem 36912324 K-smiHdSyn 18350106 P-typCalSyn 12781913 Q-rtnTyp 10150586 J-parCalSyn 6685185 F-forSepSyn 823934 L-cmpSyn 508582 H-keySyn 307753 G-curIfSyn 22773
Fig. 1. The graph on the left shows mistake frequency plotted against mean time-to-fix in seconds (after capping at max. 1000 seconds). The total to-fix for each mistake is frequency multiplied by mean time-to-fix, and thus is the area of the rectangle formed between the point and the origin. These numbers for total time-to-fix (TTF) are given in the table on the right (measured in seconds). It can be seen that the ordering by frequency (on the X-axis in the graph) is not the same as the ordering in the table of total time-to-fix.
is the most frequent mistake, followed by mistake I-calTyp [wrong method argument types] and mistake O-noRtnSem [missing return statement]. Note that not all the mistakes cause a compiler error (e.g. B-strEqSem [using == to compare strings]) and such mistakes tend to have inflated time-to-fix.
Frequency is useful as a coarse-grain indicator, but it is not the full story. Mistake C-brktSyn, the most frequent mistake, occurs 1.8 million times, but its median time-to-fix is 17 seconds: students do not get stuck for long. Mistake I-calTyp occurs only 1.0 million times, but its median time-to-fix is 59 seconds: three times as long. Which mistake should be considered more of a problem for students?
We propose that the severity of a mistake is not measured solely by frequency nor time-to-fix, but by their combination. Namely: the total time spent by all students in the dataset tackling the mistake. Mistake severity is literally measured by the time spent fixing it. To measure this, we sum the time spent fixing each mistake across the whole dataset, with each individual fix time capped at a maximum of 1000 seconds.
Figure 1 shows this calculation. The graph on the left plots the frequency of a mis-take against its time-to-fix, where the rectangular area formed by each mismis-take from (0,0) to (Frequency, Mean-TTF) equals the total of the TTF for all incidents of this mistake: since the mean is total divided by frequency, the mean multiplied by the fre-quency produces the total. The ordering by total time-to-fix is shown in the table on the right-hand side of the figure. The ordering by frequency is not always the same as by total time-to-fix. For example, mistake O-noRtnSem [missing return statement] is the third most frequent mistake but is only sixth when ranked by total time-to-fix. 5.1. Learning
The analyses provided so far are interesting for comparing mistakes across the dataset as a whole. But there is one important feature of the dataset: we would hope that each student is on a learning trajectory which will improve their ability to avoid making mistakes, and to speed up fixing each mistake. We will consider each issue in turn.
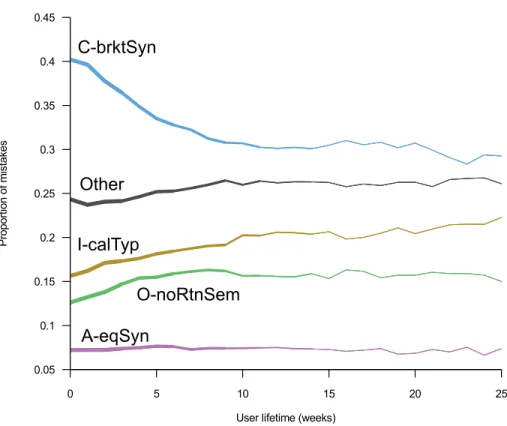
Fig. 2. The proportion of mistakes of selected types, over the user lifetime (weeks since the user first ap-peared in the dataset). The thickness of the lines indicate how many users were used to form the data for that segment of the line (regardless of whether or not the user actually made that mistake); the lines get thinner as there is less data.
We begin with investigating learning to avoid mistakes. This is a complicated anal-ysis which cannot look solely at frequency, due to many complicating factors. If stu-dents do more programming at particular points in their learning (e.g. for course as-signments) their frequencies will increase. As students become more proficient at pro-gramming, they may actually makemore mistakes as measured by raw counts: they spend less time stuck on each mistake and so they reach the next mistake faster. Nor-malising by time on task thus seems problematic. Instead, we choose to normalise by looking at the proportion of each mistake: occurrences of individual mistake types, di-vided by the total number of mistake occurrences for each user. This shows whether the make-up of each student’s mistakes changes: for example, do students make less syntax but more semantic mistakes over time?
The graph in Figure 2 compares the proportion of the four most frequent mistakes (C-brktSyn, I-calTyp, O-noRtnSem, A-eqSyn) and the remaining mistakes, over user lifetime. The X-axis is time, measured in calendar weeks since the student first ap-peared in the dataset. The Y-axis is the proportion of mistakes, normalised to an in-dividual student’s total mistakes in that week. The thickness of the line indicates the number of students we have data for in a given lifetime-week; for longer timespans, we have fewer students who remained active that long, and thus the line thins and the data becomes noisier.
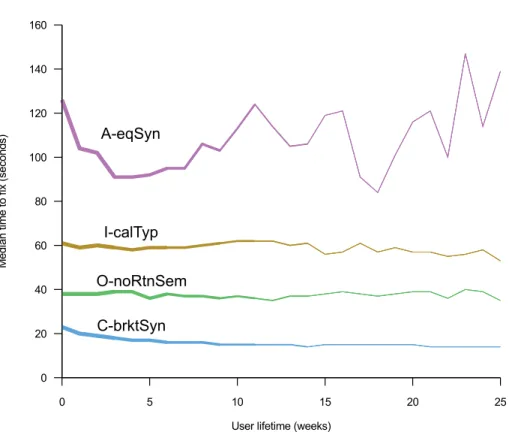
Fig. 3. The median time-to-fix (seconds) for mistakes of selected types, over the user lifetime (weeks since the user first appeared in the dataset). The thickness of the lines indicate how many users were used to form the data for that segment of the line (regardless of whether or not the user actually made that mistake); the lines get thinner as there is less data.
It can be seen from this graph that students learn to avoid mistake C-brktSyn [mis-matched brackets] over their first ten weeks of programming, although it is far from eliminated. (We will shortly look at whether students get faster at fixing these mis-takes.) Students make mistake I-calTyp [wrong method argument types] increasingly often, but this highlights another difficulty in interpreting this data: it is not neces-sarily the case that students get worse at avoiding mistake I-calTyp. As the students’ courses progress to more difficult subject matter, they will probably write more and more method calls with more complex types and thus are in situations where mis-take I-calTyp becomes more likely. We can remain confident that students do avoid the syntactic mistake C-brktSyn more, however, as students never progress to a situation where syntax becomes irrelevant. Note however, that since the graph is of proportions, an increase or decrease in one error will lead to a corresponding decrease or increase in others.
We can also investigate whether students learn to solve mistakes more quickly. The graph in Figure 3 shows the median time-to-fix over user lifetime. It is apparent that mistake A-eqSyn has very noisy data; it is lower frequency (one-quarter of that of C-brktSyn, the most frequent mistake) but this is unlikely to be a complete explanation. We do not know why A-eqSyn would be so much noisier than the other mistakes. For several of the other mistakes, it is difficult to make out a trend on this graph, and additionally, the median throws away information about skew in the distribution.
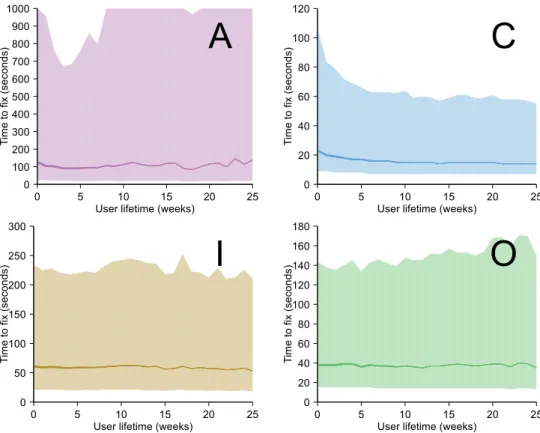
Fig. 4. The time-to-fix (seconds) for mistakes of selected types, over the users’ lifetime (weeks since the user first appeared in the dataset). Illustrated mistakes are A-eqSyn, C-brktSyn, I-calTyp and O-noRtnSem. The shaded data portrays the interquartile range: the bottom of the shared area is the lower quartile, the line is the median, and the top of the shaded range is the upper quartile. The thickness of the lines indicate how many users were used to form the data for that line segment; lines get thinner as there is less data. Recall that each time-to-fix data point is capped at 1000 seconds, which is thus the limit for the upper quartile. Note that the Y-axes are scaled differently on each graph, so only trends and shapes can be compared.
For this reason, we provide split graphs in Figure 4 showing the lower-, median, and upper-quartiles of time-to-fix for each of the four mistakes. Note that the Y-axes differ between each graph, so their heights are not comparable, only the trends and shapes of each. It can be seen that only mistake C-brktSyn shows any downward trend. The students do not seem to become any better at solving mistakes I-calTyp or O-noRtnSem as time progresses. This may be because they do not learn to cope any better, or it may be that the mistakes they are encountering are more complex as their programs and tasks grow in size and complexity.
6. EDUCATOR SURVEY
The previous sections detailed the data about student mistakes which we found in the Blackbox data. The other part of our work asked educators for their opinions about these mistakes. We prepared a questionnaire that listed our eighteen student mistakes and asked respondents to rate each mistake on a scale of infrequent to frequent, by making a mark along a visual analogue scale (a straight line with endpoints, like so: ), and similarly from quick-to-fix to slow-to-fix. These scales were measured to the nearest 1
This paper questionnaire was given out to attendees of the ICER 2013 conference. An equivalent online electronic version of the questionnaire was also later developed, and advertised via the SIGCSE mailing list, the UK Computing At School forum and Twitter (those who completed at ICER 2013 were instructed not to complete the online version). The research was approved by the University of Kent ethics process.
29 participants returned a paper questionnaire and 191 started filling out the on-line questionnaire (although many did not complete). Only 76 participants filled in all scales for all questions (20 paper, 56 online), and this formed the sample set for all analyses. Participants were also asked about their educational experience in different sectors. 56 had experience only in the tertiary sector (age 18+), 3 only in secondary (ages 11–18), 14 in secondary and tertiary, and the remaining 3 at all ages (4–18+). 6.1. Inter-Educator Agreement
To measure agreement among educators, we used Kendall’s coefficient of concordance (aka Kendall’sW) [Kendall 1990]. This statistic can be used to assess the agreement among ranks assigned by a group of raters to a set of items, by looking at the vari-ance among the ranks of the different mistakes. We performed two such tests: one for agreement between educators when ranking the frequency of mistakes, and one for agreement between educators when ranking the time-to-fix of mistakes.
Our analysis for mistake frequency produced the result W = 0.408. For aid in in-terpretation, we use a conversion to Spearman’sρcorrelation for ranked data [Howell 2002, p313], which givesρ= 0.400. Informally, this means that the educators are closer to chance agreement than they are to complete agreement. The educators we sur-veyed form a weak consensus about which errors are most frequently made by students. Our parallel analysis for time-to-fix of mistakes produced the result
W = 0.243, which converts toρ= 0.233. Thus,the educators form an even weaker consensus about which errors will be most quickly fixed by students.
7. EDUCATORS AND BLACKBOX
Using both the Blackbox data and the educators’ opinions about the mistakes, we per-formed several analyses to compare the Blackbox data against the educator data. 7.1. Educator and Student Agreement
To measure agreement between educators’ ratings and the Blackbox data, we used the average Spearman’sρ(rho) for pairwise comparisons between each educator and the Blackbox data (thus: one correlation per rater). Spearman’sρis a correlation between the ranks of the two different variables, and thus looks only at theorderingof mistake frequency, not the exact frequencies nor the educator’s 0–100 ratings. We term these pairwise correlations between educators and the Blackbox data: educatoraccord. This use of the average was originally recommended by Lyerly [1952], then explained and generalised by Taylor and Fong [Taylor and Fong 1963; Taylor 1964] to add a signif-icance test. In our analysis, Taylor’s ρt,c¯ is the average of the pairwise correlations between the Blackbox data and each educator, corrected for continuity.
7.1.1. Educator Frequency Ranking vs Blackbox Frequency Ranking. The averageρ for cor-relations between each educator and the Blackbox data for mistake frequency was
0.501 (3 s.f.). Corrected for continuity [Taylor 1964], this gives aρt,c¯ = 0.501, soz = 18.0(3 s.f.) and thusp <0.001. Since the standard deviation ofρ¯t,cis 0.028 (3 s.f.)
[Tay-lor and Fong 1963] and normality is assumed, the 95% confidence interval is [0.447, 0.556] (3 s.f.). Therefore, there was a statistically significant overall agreement, termed frequency accord, between educators and the Blackbox data for mistake frequency at the 5% level, with an average correlation of0.501.
Fig. 5. Examples of different accord scores. Perfect agreement is shown by the solid diagonal line, and accord is proportional to the square of the vertical distance of each point from the line. The filled triangles are the ranks assigned by the educator with the highest accord (0.870). The empty squares are the ranks assigned by one of the educators surrounding the median accord (0.520). The crosses are the ranks assigned by the educator with the lowest accord (-0.111).
The distribution of frequency accord scores is shown later at the top of Figure 6. An example of accord is shown in Figure 5, demonstrating that while the educator with the highest accord (the filled triangles) was reasonably close to the correct answer, the median educator (the empty squares) had only a moderate level of agreement, ranking the most frequent Blackbox mistake as joint thirteenth, and getting most other errors wrong by around three ranks.The level of agreement between educators and the student data for mistake frequency was thus moderate.
7.1.2. Educator Time-To-Fix Ranking vs Blackbox Time-To-Fix Ranking. The averageρfor cor-relations between each educator and the Blackbox data for mistake frequency was
0.358 (3 s.f.). Corrected for continuity [Taylor 1964], this gives aρ¯t,c = 0.358, so z =
12.9(3 s.f.) and thusp <0.001. Since the standard deviation ofρt,c¯ is 0.028 (3 s.f.) [Tay-lor and Fong 1963] and normality is assumed, the 95% confidence interval is [0.303, 0.412] (3 s.f.). Therefore, there was a statistically significant overall agreement, termed time-to-fix accord, between educators and the Blackbox data for time-to-fix rankings at the 5% level, with an average correlation of0.358. The distribution of time-to-fix accord scores is shown at the right-hand side of Figure 6. Similar to (but worse than) mistake frequency,the level of agreement between educators and the student data for mistake frequency was thus in general low.
7.1.3. Educator Frequency Ranking vs Blackbox Time-To-Fix Ranking.Given that the two previous accord measures were low, we wondered if the following explanation held. Educators may only see the mistakes with which students have serious problems. An educator might not consider many of the syntax errors to be frequent because students solve them quickly by themselves, and thus an educator with a class of students may not deal with these errors often. Instead, an educator’s time might be more likely to be taken up by subtle or difficult errors (such as string equality in Java) which students struggle with for longer. To test this theory, we correlated the educators’ rankings for frequencywith the Blackbox rankings fortime-to-fix.
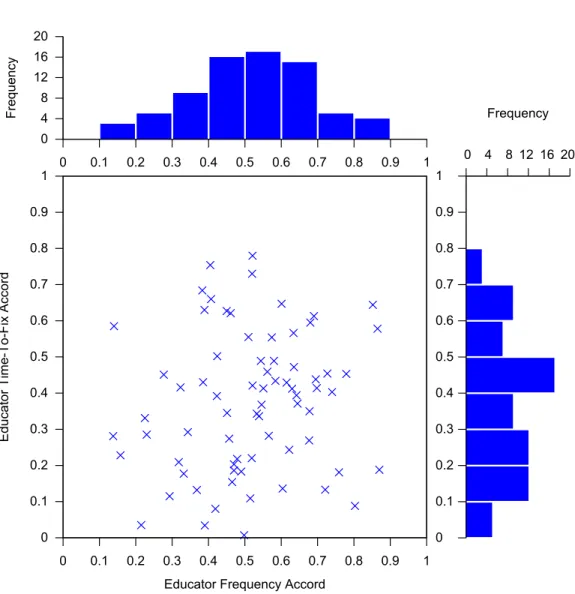
Fig. 6. A plot of educator frequency accord (X-axis) against educator time-to-fix accord. It can be seen that there is no strong relation between the two accords, suggesting that ability to predict mistake frequency is unrelated to ability to predict time-to-fix. Three data points are omitted from the graph where the accord was negative. A histogram for each axis is also provided.
The average ρ for correlations between each educator and the Blackbox data for mistake frequency was0.317(3 s.f.). Corrected for continuity [Taylor 1964], this gives aρt,c¯ = 0.317, soz= 11.4(3 s.f.) and thusp <0.001. Since the standard deviation ofρt,c¯
is 0.028 (3 s.f.) [Taylor and Fong 1963] and normality is assumed, the 95% confidence interval is [0.263, 0.372] (3 s.f.). Therefore, there was a statistically significant over-all agreement, termed accord, between educators frequency rankings and the Black-box data time-to-fix rankings at the 5% level, with an average correlation of 0.317. Although it was significant, the correlation between the educators’ frequency rankings and the Blackbox time-to-fix was worse than the correlation with Blackbox frequency, which suggests that this theory about how educators may estimate frequency is not supported.
(a) (b) (c)
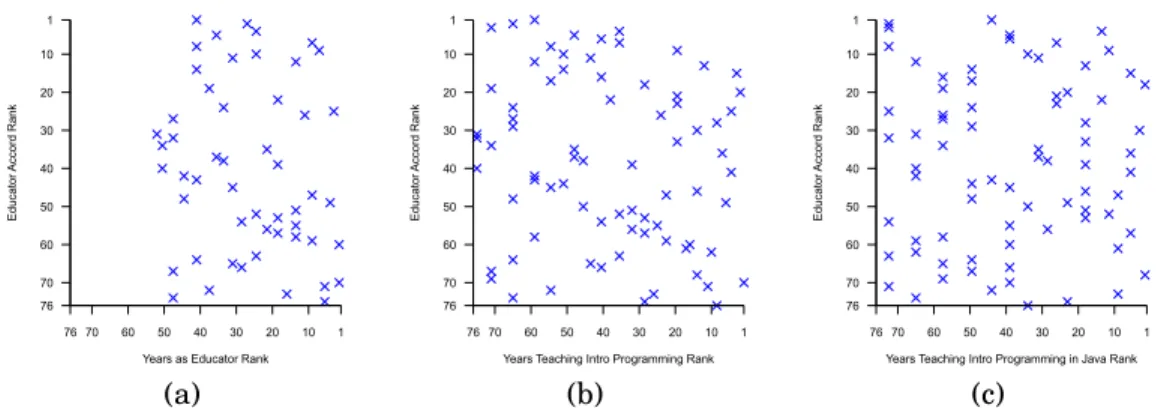
Fig. 7. Graphs showing ranks for educator frequency accord (i.e. their agreement with the Blackbox data) against ranks for (a) the years they have been an educator, (b) the years they have taught introductory programming and (c) the years they have taught introductory programming in Java. Ranks are plotted such that the highest values (and thus lowest ranks) are towards the top or right of the graph. Perfect agreement would be a diagonal line from bottom-left to top-right; a perfect disagreement would be a diagonal line from top-left to bottom-right. Note that for (a), only 52 of the 76 educators in our sample answered this question, whereas all answered for (b) and (c). Rank correlations were insignificant in all three cases.
7.2. Educator and Student Agreement – Frequency And Time-To-Fix Accord
We have examined educators’ frequency accord (i.e. the level of agreement between educators’ estimates of mistake frequency, and the observed mistake frequency in the Blackbox data), and also time-to-fix accord (the same, but for estimates/observations of mistake time-to-fix). We can thus ask the question: are these accords correlated? That is, does the ability of an educator to predict mistake frequency match their ability to predict time-to-fix frequency? It seems reasonable that it might. To this end, we again used Spearman’sρ. The result wasρ = 0.118, p= 0.309, thus showing no significant correlation between the two at the 5% level. This can be confirmed by inspection of Figure 6, which plots the two accord values against each other for each educator.There is no relation between an educator’s ability to predict mistake frequency and their ability to predict time-to-fix.
7.3. Educator and Student Agreement – Effect of Experience
To check if educator accord was affected by educators’ experience, we used the following procedure. As described in the previous sections, we first calculated educator accord, using Spearman’sρas a measure of agreement between each educator’s rankings and the Blackbox rankings (one correlation per rater). This accord was then correlated (again with Spearman’sρ) with the educators’ total years of experience3. A significant correlation would indicate an effect of experience on educators’ agreement with the Blackbox data.
Our data contains three measures of an educator’s experience: total years as an educator, years spent teaching introductory programming, and years spent teaching introductory programming in Java. The relations between each of the measures of experience and the frequencyaccord are plotted in Figure 7. The correlations, using Spearman’s ρwere non-significant (Years as educator: ρ = −0.179, p = 0.203; Years teaching intro. prog.: ρ = −0.129, p = 0.268; Years teaching intro. prog. in Java:ρ = 0.017,p= 0.883) with False Discovery Rate (FDR) correction at the 5% level.
3Our use ofρhere means that we do not look for a linear effect of experience (e.g. accuracy increasing
linearly from 5 to 10 to 15 years), but rather: when educators are ordered by experience, does this match their ordering by accuracy?
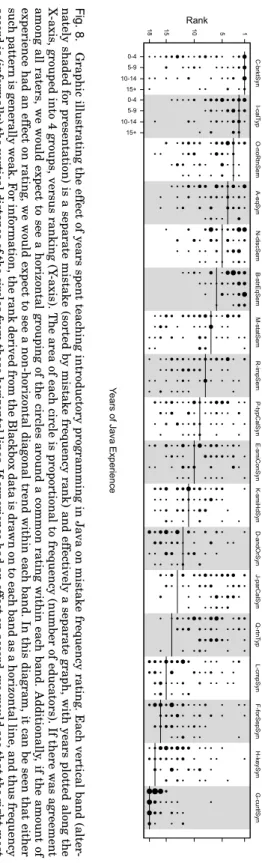
Fig. 8 . Graphic illustrating the effect of years spent teac hing introductory programming in J a va on mistake frequency rating . Eac h vertical band (alter -nately shaded for presentation) is a separate mistake (sorted by mistake frequency rank) and effectively a separate graph, with years plotted along the X-axis , grouped into 4 groups , versus ranking (Y -axis). The area of eac h circ le is proportional to frequency (number of educators). If there w as agreement among all raters , we would expect to see a horizontal grouping of the circ les around a common rating within eac h band. Additionally , if the amount of experience had an effect on rating , we would expect to see a non-horizontal diagonal trend within eac h band. In this diagram, it can be seen that either suc h pattern is generally weak. F or information, the rank derived from the Blac kbox data is dra wn on to eac h band as a horizontal line , and thus frequency accord is (informally) the vertical distance of the circ les from these horizontal lines . If experience had an effect on accord, we would see that the right-most points within eac h band were closer to the horizontal line than the left-most points , but this is also not the case .
An additional analysis correlating these experience measures withtime-to-fixaccord similarly found that the correlations were non-significant (Years as educator:ρ= 0.119,
p= 0.422; Years teaching introductory programming:ρ= 0.104,p= 0.373; Years teach-ing introductory programmteach-ing in Java: ρ = 0.165, p = 0.155) with False Discovery Rate (FDR) correction at the 5% level.There was no effect of experience on an educator’s ability to predict mistake frequency or time-to-fix.
7.4. Summary Figure
Some of the key patterns in the educator frequency rankings (compared to mistake frequency in the Blackbox data) are visualised in Figure 8, as explained in the figure caption.
8. DISCUSSION
8.1. Mistake Frequency and Time-To-Fix
RQ1: What are the frequencies and times-to-fix of a specific set of eighteen student Java mistakes in a large-scale multi-institution dataset?
RQ2: How do the patterns of these mistakes change over time for each user?
Our results in Table I show that mismatched brackets are the most frequent mis-take. However, while it is much more frequent (1.8 million) than the next most frequent mistake (wrong types in method call: 1.0 million), this difference is much closer if we look at the mistakes using total time-to-fix in the dataset (253 million seconds vs 230 million). We suggest that total time-to-fix (see Figure 1) is a better measure of mistake severity for judging which mistakes cause the most problems for students.
The one drawback is that mistakes which do not cause a compiler error, and thus can exist in code for a long time before students spot them, bias the analysis. This problem with the analysis can either be viewed as an issue with the methodology, or with the programming tools. If comparing strings with == is always wrong (i.e. using .equals is always a better idea) – mistake B-strEqSem – then why should it go unhighlighted by compilers? Similarly, mistake E-smiConSyn (semi-colon after if header) is always incorrect but is not a compiler error. We would argue that it should be.
Looking at the proportion of mistake frequencies over user lifetime (Figure 2), we see that students do learn to avoid the mistake of mismatching brackets, and learn to solve this issue more quickly (Figures 3 and 4). However, we see little or no learning for the time required to fix other mistakes. This may be because the complexity of the mis-takes encountered increases as students attempt to write more complex programs as they progress through their courses. Alternatively, it may be that three to six months of a school/university course is too short a duration to expect a sizeable learning effect for semantic errors.
8.2. Inter-Educator Agreement
RQ3: Do educators’ views form a consensus about the frequency and time-to-fix of a specific set of eighteen Java mistakes by students?
Our implicit expectation when beginning this research was that there would be a reasonably strong consensus among educators as to the frequency of Java mistakes. The low level of agreement between educators (for either frequency or time-to-fix) was a surprise – and even more so, because years of experience (generally, or within Java) made no apparent difference to the ratings assigned by the educators (see Figure 8 for a visualisation of these results). This result colours some of the interpretation of the results regarding an agreement between the educators and Blackbox: if educators do not agree with one another, it is unlikely that there would be a very strong agreement between the educators and the Blackbox data.
One explanation for this lack of agreement is that the educators are all correct, in their own context: each educator may be correct about their own classroom, but their opinions do not generalise to other classrooms. Further work would be needed to in-vestigate this, by getting many educators to tag their own students in the dataset. An-other explanation for the lack of generalisability is that looking at frequencies of Java mistakes is the wrong level of abstraction to find common ground among educators. If educators talked about programming features at a higher level (e.g. the conceptual difficulties that students have with looping or variables) then we might find more of a consensus than when looking at specific syntax and semantic mistakes.
8.3. Educator-Student Agreement
RQ4: Do educators’ views of mistake frequency and time-to-fix match the observed fre-quencies and time-to-fix by students in a large-scale multi-institution dataset?
We looked at several different measures of whether educators’ ratings for frequency and time-to-fix match with the data in the Blackbox dataset. Given the lack of agree-ment among educators, it is not surprising that educators do not on average agree well with the dataset.
A visual inspection of Figure 8 shows the big “hits and misses” from the educators. MistakeB-strEqSem, the use of==to compare strings, was clearly overrated by most, as were mistakesJ-parCalSyn(forgetting parentheses for a method call) andQ-rtnTyp (incompatible types when assigning a method call result). Some of these mistakes are relative to the use of the underlying constructs: if students wrote fewer method calls than educators expected, this would explain the lower frequency of mistakes in mak-ing method calls. Similarly, the frequency of mistake R-impSem (not implementmak-ing all methods from an interface) will depend heavily on the frequency with which the sampled students implement interfaces (a relatively advanced feature for novices).
Surprised by the lack of agreement between educators and the dataset, we formed an additional hypothesis: perhaps the educators were predicting frequency based on the mistakes which they saw students spent a long time on. If this were the case, we would expect to see a relationship between thefrequencyprediction of educators, and thetime-to-fixof the students. However, performing an additional analysis showed that this relation was even weaker than the correlations between educators’ frequency predictions and student mistake frequency, or the same for time-to-fix. Thus, we dis-counted this alternative explanation.
The mistakes in this study were automatically detected using a set of tools. If the tools were not sufficiently accurate in picking up mistakes, this could have affected our measure of educator accord. To this end, we have made the source code available (see section 4) in case further investigation is warranted. As well as the tool, the choice of mistakes has an effect on educator accord. Looking at Table I, it is clear that some of the mistakes (especially L-cmpSyn,F-forSepSyn,H-keySyn andG-curIfSyn) are par-ticularly low frequency, in contrast to the aim of Hristova et al. [2003] to find the most common errors. Figure 8 confirms that, especially forG-curIfSyn, educators predicted these low-frequency items consistently – ifG-curIfSynwere excluded from the analy-sis, educator accord would reduce. A more principled search for the top mistakes, and accurate classifiers for these, may provide a better picture of educator accord, but this may decrease educator accord rather than increase it. Educators seem to be accurate at identifying rare mistakes as rare but not at comparing higher frequency mistakes to one another – although it could be said that the former is more important than the latter.
8.4. Effect of Experience
RQ5: Are more experienced educators’ views more likely to match the students’ data than those of novice educators?
Our analysis, depicted visually in Figure 7, found that there was no effect of edu-cator experience (as measured by years as an eduedu-cator, years teaching introductory programming in any language, or years teaching introductory programming in Java) on educator accord. That is: no matter how many years the educator had been teaching, it had no effect on their accuracy in predicting the frequencies or time-to-fix for mis-takes in the Blackbox student data. This is a very surprising result. Our expectation had been that experience would surely provide some sort of increase to accuracy.
If one assumes that educator experience must make a difference to educator efficacy, then this would imply that ranking student mistakes is therefore unrelated to educator efficacy. However, work from Sadler et al. [2013] in physics found that “a teacher’s ability to identify students’ most common wrong answer on multiple-choice items... is an additional measure of science teacher competence.” While picking answers to a multiple choice question is not exactly the same as programming mistakes, there is a conflict here – either the Sadler et al. result does not transfer and ranking common student mistakes is not a measure of programming teacher competence, or experience has no effect on teacher competence. The first option seems more likely.
9. CONCLUSIONS
We investigated educators’ opinions about the frequency and time-to-fix of eighteen Java mistakes among programming novices. Our first finding was that educators have only a weak consensus about these frequencies and times-to-fix. It remains possible that these frequencies and times are contextual, and thus each educator is correct for their own students. Regardless, this suggests that in cases where educators communi-cate with one another (e.g. via online communities, or when writing textbooks), talking about which mistakes students make or get stuck on will not provide much agreement. Our further result that educators are not very accurate compared to a large dataset of students suggests that educators are also not accurate about the frequencies of these mistakes, so any claims that “students always make mistake X” are unlikely to be accurate. This may just mean that a different level of discourse is required: educators may still be accurate about the cause of mistakes and student’s conceptions of the mistakes, but just not about the frequency and time-to-fix of such mistakes.
Our most surprising result was that an educator’s level of experience (as measured by years as an educator, years teaching introductory programming in any language, or years teaching introductory programming in Java) had no effect on how closely the educator’s frequency rankings agreed with those from the Blackbox data. A strong in-terpretation of this result would be that experience has little effect on educator efficacy. However, it must be remembered that this task (ranking mistakes by frequency and time-to-fix) is not necessarily aligned with educator efficacy – this result only shows that experience has no effect on ranking mistake frequency and time-to-fix. Instead, this result may indicate that such a task is therefore not representative of educator efficacy (which we would expect to increase with experience).
Another surprising result is that our data shows little learning effect over the course of the three to six months for which most users are present in the data. The time spent to fix mismatched brackets reduces, but we see no such consistent effect for other mis-takes. For some mistakes (e.g. incorrect types) this may be because the programs being written are increasingly complex, which counterbalances any learning effect. How-ever, some mistakes (e.g. getting the assignment operator wrong, comparing strings correctly) are surely unrelated to program complexity, yet still show no learning effect.
9.1. Future Work
One drawback of the Blackbox dataset is that it comes with no contextual information: no demographic information on the individual user and no definite information on each user’s aim. Additionally, we cannot tally individual educators against their own students in the dataset as it stands. This is the trade-off made in achieving such large-scale data collection. However, the Blackbox project also supports local data collection, which can be matched against other collected information such as course grades or prior programming experience. We believe that studies such as this one, highlighting interesting overall global trends in the data can provide a launchpad for further, lo-calised studies which look in more detail at some of the effects we have found, such as the lack of learning effect in the time-to-fix, or matching educator’s opinions against their own classes.
For the work presented here, we chose a single set of mistakes based on work by Hristova et al. [2003]. Although that work was aiming to find the most frequent Java mistakes, our results here suggest that several of the mistakes were quite infrequent. Future work, such as that begun by our colleagues, McCall and K¨olling [2014], could construct error classifications using the Blackbox data, or at least validate frequency claims using the Blackbox data.
REFERENCES
Alireza Ahadi, Vahid Behbood, Arto Vihavainen, Julia Prior, and Raymond Lister. 2016. Students’ Syntactic Mistakes in Writing Seven Different Types of SQL Queries and Its Application to Predicting Students’ Success. InProceedings of the 47th ACM Technical Symposium on Computing Science Education (SIGCSE ’16). ACM, New York, NY, USA, 401–406. DOI:http://dx.doi.org/10.1145/2839509.2844640
Alireza Ahadi, Raymond Lister, Heikki Haapala, and Arto Vihavainen. 2015. Ex-ploring Machine Learning Methods to Automatically Identify Students in Need of Assistance. In Proceedings of the Eleventh Annual International Conference on In-ternational Computing Education Research (ICER ’15). ACM, New York, NY, USA, 121–130. DOI:http://dx.doi.org/10.1145/2787622.2787717
Marzieh Ahmadzadeh, Dave Elliman, and Colin Higgins. 2005. An Analysis of Patterns of Debugging Among Novice Computer Science Students. In Proceed-ings of the 10th Annual SIGCSE Conference on Innovation and Technology in Computer Science Education (ITiCSE ’05). ACM, New York, NY, USA, 84–88.
DOI:http://dx.doi.org/10.1145/1067445.1067472
Amjad Altadmri and Neil C. C. Brown. 2015. 37 Million Compilations: In-vestigating Novice Programming Mistakes in Large-Scale Student Data. In Proceedings of the 46th ACM Technical Symposium on Computer Sci-ence Education (SIGCSE ’15). ACM, New York, NY, USA, 522–527.
DOI:http://dx.doi.org/10.1145/2676723.2677258
Yifat Ben-David Kolikant. 2011. Computer science education as a cultural encounter: a socio-cultural framework for articulating teaching difficulties. Instructional Science 39, 4 (2011), 543–559. DOI:http://dx.doi.org/10.1007/s11251-010-9140-7
Neil C. C. Brown and Amjad Altadmri. 2014. Investigating Novice Programming Mis-takes: Educator Beliefs vs. Student Data. InProceedings of the Tenth Annual Confer-ence on International Computing Education Research (ICER ’14). ACM, New York, NY, USA, 43–50. DOI:http://dx.doi.org/10.1145/2632320.2632343
Neil C. C. Brown, Michael K¨olling, Davin McCall, and Ian Utting. 2014. Blackbox: A Large Scale Repository of Novice Programmers’ Activity. InProceedings of the 45th ACM Technical Symposium on Computer Science Education (SIGCSE ’14). ACM, New York, NY, USA, 223–228. DOI:http://dx.doi.org/10.1145/2538862.2538924
R. Cadenhead. 2012. Sams Teach Yourself Java in 21 Days. Pearson Education. Paul Denny, Andrew Luxton-Reilly, and Ewan Tempero. 2012. All Syntax Errors Are
Not Equal. InProceedings of the 17th ACM Annual Conference on Innovation and Technology in Computer Science Education (ITiCSE ’12). ACM, New York, NY, USA, 75–80. DOI:http://dx.doi.org/10.1145/2325296.2325318
Thomas Dy and Ma. Mercedes Rodrigo. 2010. A Detector for Non-literal Java Er-rors. In Proceedings of the 10th Koli Calling International Conference on Comput-ing Education Research (Koli CallComput-ing ’10). ACM, New York, NY, USA, 118–122.
DOI:http://dx.doi.org/10.1145/1930464.1930485
C. Hoisington. 2012. Android Boot Camp for Developers using Java. Cengage Learn-ing.
David C. Howell. 2002. Statistical Methods for Psychology(fifth ed.). Duxbury.
Maria Hristova, Ananya Misra, Megan Rutter, and Rebecca Mercuri. 2003. Iden-tifying and Correcting Java Programming Errors for Introductory Computer Sci-ence Students. InProceedings of the 34th SIGCSE Technical Symposium on Com-puter Science Education (SIGCSE ’03). ACM, New York, NY, USA, 153–156.
DOI:http://dx.doi.org/10.1145/611892.611956
Petri Ihantola, Arto Vihavainen, Alireza Ahadi, Matthew Butler, J ¨urgen B¨orstler, Stephen H. Edwards, Essi Isohanni, Ari Korhonen, Andrew Petersen, Kelly Rivers, Miguel ´Angel Rubio, Judy Sheard, Bronius Skupas, Jaime Spacco, Claudia Szabo, and Daniel Toll. 2015. Educational Data Mining and Learning Analytics in Pro-gramming: Literature Review and Case Studies. InProceedings of the 2015 ITiCSE on Working Group Reports (ITICSE-WGR ’15). ACM, New York, NY, USA, 41–63.
DOI:http://dx.doi.org/10.1145/2858796.2858798
J. Jackson, M. Cobb, and C. Carver. 2005. Identifying Top Java Errors for Novice Programmers. In Frontiers in Education, 2005. FIE ’05. Proceedings 35th Annual Conference. DOI:http://dx.doi.org/10.1109/FIE.2005.1611967
Matthew C. Jadud. 2006. Methods and Tools for Exploring Novice Compila-tion Behaviour. In Proceedings of the Second International Workshop on Com-puting Education Research (ICER ’06). ACM, New York, NY, USA, 73–84.
DOI:http://dx.doi.org/10.1145/1151588.1151600
Matthew C. Jadud and Brian Dorn. 2015. Aggregate Compilation Behavior: Findings and Implications from 27,698 Users. InProceedings of the Eleventh Annual Interna-tional Conference on InternaInterna-tional Computing Education Research (ICER ’15). ACM, New York, NY, USA, 131–139. DOI:http://dx.doi.org/10.1145/2787622.2787718 Maurice Kendall. 1990.Rank Correlation Methods(fifth ed.). Edward Arnold.
Michael K¨olling, Bruce Quig, Andrew Patterson, and John Rosenberg. 2003. The BlueJ System and its Pedagogy.Computer Science Education13, 4 (2003), 249–268.
DOI:http://dx.doi.org/10.1076/csed.13.4.249.17496
S. B. Lyerly. 1952. The average Spearman rank correlation coefficient. Psykometrika 17 (1952), 421–428.
Davin McCall and Michael K¨olling. 2014. Meaningful Categorisation of Novice Pro-grammer Errors. In2014 Frontiers In Education Conference.
Andrew Petersen, Jaime Spacco, and Arto Vihavainen. 2015. An Exploration of Error Quotient in Multiple Contexts. InProceedings of the 15th Koli Calling Conference on Computing Education Research (Koli Calling ’15). ACM, New York, NY, USA, 77–86.
DOI:http://dx.doi.org/10.1145/2828959.2828966
Philip M. Sadler, Gerhard Sonnert, Harold P. Coyle, Nancy Cook-Smith, and Jaimie L. Miller. 2013. The Influence of Teachers’ Knowledge on Student Learning in Middle School Physical Science Classrooms. American Educational Research Journal50, 5 (2013), 1020–1049. DOI:http://dx.doi.org/10.3102/0002831213477680
Elliot Soloway and Sitharama Iyengar (Eds.). 1986. Empirical Studies of Program-mers: Papers Presented at the First Workshop on Empirical Studies of Programmers. Intellect Books.
Jaime Spacco, Paul Denny, Brad Richards, David Babcock, David Hovemeyer, James Moscola, and Robert Duvall. 2015. Analyzing Student Work Patterns Using Pro-gramming Exercise Data. In Proceedings of the 46th ACM Technical Symposium on Computer Science Education (SIGCSE ’15). ACM, New York, NY, USA, 18–23.
DOI:http://dx.doi.org/10.1145/2676723.2677297
Jaime Spacco, Davide Fossati, John Stamper, and Kelly Rivers. 2013. Towards Improving Programming Habits to Create Better Computer Science Course Out-comes. In Proceedings of the 18th ACM Conference on Innovation and Technology in Computer Science Education (ITiCSE ’13). ACM, New York, NY, USA, 243–248.
DOI:http://dx.doi.org/10.1145/2462476.2465594
James C. Spohrer and Elliot Soloway. 1986. Novice Mistakes: Are the Folk Wisdoms Correct? Commun. ACM 29, 7 (July 1986), 624–632.
DOI:http://dx.doi.org/10.1145/6138.6145
Emily S. Tabanao, Ma. Mercedes T. Rodrigo, and Matthew C. Jadud. 2011. Predicting At-risk Novice Java Programmers Through the Analysis of On-line Protocols. In Proceedings of the Seventh International Workshop on Com-puting Education Research (ICER ’11). ACM, New York, NY, USA, 85–92.
DOI:http://dx.doi.org/10.1145/2016911.2016930
Wilson L. Taylor. 1964. Correcting the Average Rank Correlation Coefficient for Ties in Rankings. J. Amer. Statist. Assoc.59, 307 (1964), 872–876. http://www.jstor.org/ stable/2283105
Wilson L. Taylor and Ching Fong. 1963. Some Contributions to Average Rank Corre-lation Methods and to the Distribution of the Average Rank CorreCorre-lation Coefficient. J. Amer. Statist. Assoc.58, 303 (1963), 756–769. http://www.jstor.org/stable/2282723 P. van der Linden. 2004. Just Java 2. Pearson Education.
Arto Vihavainen, Juha Helminen, and Petri Ihantola. 2014. How Novices Tackle Their First Lines of Code in an IDE: Analysis of Programming Session Traces. In Proceedings of the 14th Koli Calling International Conference on Comput-ing Education Research (Koli CallComput-ing ’14). ACM, New York, NY, USA, 109–116.
DOI:http://dx.doi.org/10.1145/2674683.2674692