1 | P a g e
National Strategic Indicators, 2014-15
National Strategic Indicators (NSIs) are used to measure the performance of local authorities at a national level and focus on key strategic priorities. They are collected by each local authority and up to 2012-13 a sample of the indicators were audited by the Wales Audit Office. The indicators were not audited by the Welsh Audit Office in 2014-15. Each indicator is aligned to one or more of the Welsh Government’s strategic priorities, and they have been chosen for their focus on outcomes.
Local authorities are legally obliged to collect and publish data for each of the NSIs. Welsh Ministers have the power to set performance indicators and standards for Welsh local authorities, with the current set specified in the Local Government (Performance Indicators and Standards) (Wales) Order 2012.
Since 2010-11 the NSI dataset has been collected directly by the Welsh Government and is available from StatsWales. Data for 2009-10 and prior years were collected by the Data Unit - Wales on behalf of the Welsh Government, and the historic dataset is available from the Data Unit Wales website.
Local authorities also use these performance indicators, along with other indicators that they choose to use and a wider range of information, in order to plan and deliver improved services.
Key results
The data for 2014-15 NSIs showed an overall picture of improvement over 2013-14 in the performance measured by the Welsh average, with an improvement in performance for seventeen indicators and thirteen indicators showing a decline in performance. To note, the indicators measured in 2014-15 were the same as 2013-14.
Between 2013-14 and 2014-15, where applicable the Welsh average;
• Improved in eight out of the twelve comparable indicators for social care; • Improved in one of the three indicators for housing;
• Improved in four out of the eight comparable indicators for education;
• Improved in three out of the four comparable indicators for environment and transport; • Improved in the one comparable indicator for planning and regulatory services.
• Declined in both of the two comparable indicators for leisure and culture; • Declined in four out of the twelve comparable indicators for social care; • Declined in four out of the eight comparable indicators for education; • Declined in two of the three comparable indicators for housing;
• Declined in one out of the four comparable indicators for environment and transport. The performance of each NSI indicator can be found in Annex 1.
Further analysis for individual local authorities can be undertaken in StatsWales.
Statistician: Nia Jones Tel: 029 2082 5088 E-mail:[email protected]
Next Update: September 2016 (provisional)
Twitter:www.twitter.com/statisticswales | www.twitter.com/ystadegaucymru
2 | P a g e
Key Quality Information
1. Local Authority Services Performance publication
A new Local Authority Services Performance website presenting key indicators is currently being developed. The website will bring together key performance indicators including National Strategic Indicators amongst others. The website will be in two phases. For the first phase only the National Strategic Indicators data will be available, scheduled to be launched in mid-September. Further
development will continue on the website thereafter which includes the additional facility to choose and compare council performances as well as other Local Authority performance indicators. This website is intended to replace the existing National Strategic Indicators data visualisation tool and the annual Local Authority performance publication. The existing National Strategic Indicators data visualisation tool has therefore been discontinued.
2. Homelessness (HHA/013)
A Wales Audit Office report ( http://www.wao.gov.uk/publication/local-improvement-planning-and-reporting-wales) in 2013 identified a wide variation in how local authorities interpret guidance for indicator HHA/013 relating to homelessness prevention. In addition to different practices in local authorities, this has resulted in a wide variation in performance. Therefore, this indicator should not be compared by local authority. However, comparisons can be made over time for individual local
authorities.
3. Data Coverage
The current selection of National Strategic Indicators (NSIs) was chosen to cover the Welsh
Government’s strategic priorities. In 2014-15, there were indicators covering social care, education, leisure and culture, housing, planning and regulatory services, environment and transport. The
indicators were collected by each individual local authority. The data generally covers the financial year 2014-15, i.e. from 1st April 2014 to 31st March 2015. However, some indicators are based on different time periods.
More information on the indicators, with full guidance and definitions can be found at:
http://gov.wales/statistics-and-research/national-strategic-indicators-data-collection/?lang=en
4. Comparability and Consistency
The current set of National Strategic Indicators has been created and amended over several years. The indicators have remained unchanged from last year. In 2012-13, the definition of seven indicators
changed which meant that they were no longer directly comparable to previous years. In addition seven new indicators were added in 2012-13.
Up to 2012-13, a sample of the National Strategic Indicators was audited by the WAO. The nature and extent of the audit testing varied according to the auditor’s assessment of risk of performance indicators collected and reported by authorities. On occasions, for various reasons, data was not deemed robust enough and was therefore qualified by the WAO. This data is included in the StatsWales tables. However, it is clearly labelled and users should be aware of this when using the data.
Prior to the 2013-14 National Strategic Indicator data collection, the Wales Audit Office (WAO) decided that there will no longer be a mandatory data quality review at each authority in every year. WAO will instead consider, from time to time, whether a data quality review is required, and if so undertake one as part of their work on performance management.
3 | P a g e 5. Accessibility and Clarity
This statistical first release is pre-announced and then published in the Statistics and Research section of the Welsh Government website. It is accompanied by more detailed tables on StatsWales, a free to use service that allows visitors to view, manipulate, create and download data.
6. Revisions
We follow the Welsh Government’s statistical revisions policy, details of which are available at:
http://gov.wales/statistics-and-research/about/statement-of-compliance/revisions-errors-postponements/?lang=enn
7. Further Information
All the data for each local authority is available to download from the NSI area of the StatsWales website:
https://statswales.wales.gov.uk/Catalogue/Local-Government/National-Strategic-Indicators-of-Local-Authority-Perfomance/NationalStrategicIndicators-by-LocalAuthority-Indicator
The Welsh Government publication Local Authority Services Performance, 2013-14 is available here: http://gov.wales/topics/improvingservices/publications/local-authority-service-performance-2013-14/?lang=en
This report provides context and commentary for local authority service performance data.
The National Survey for Wales collects information on citizens’ satisfaction with public services in Wales:
http://gov.wales/statistics-and-research/national-survey/?lang=en
Comments and contact information
We actively encourage feedback from our users. If you have any comments please e-mail us at: [email protected]
All content is available under the Open Government Licence v3.0 , except where otherwise
stated.
4 | P a g e
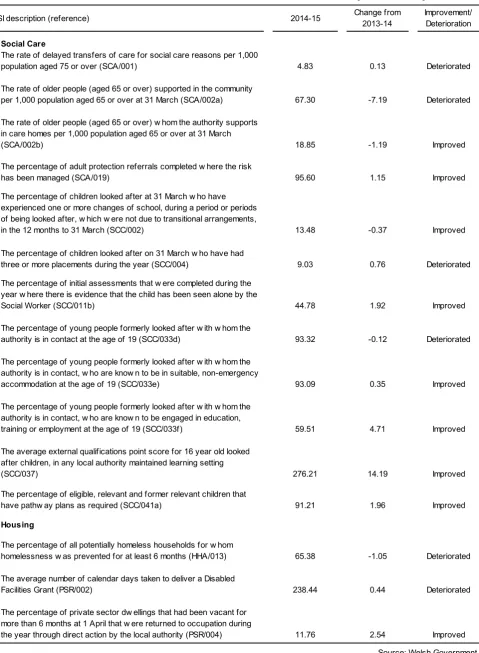
[image:4.595.53.533.107.761.2]Annex 1 – Summary of Wales Level NSI Performance
Table 1: Summary of Wales Level NSI Performance
NSI description (reference) 2014-15 Change from
2013-14
Improvement/ Deterioration
Social Care
The rate of delayed transfers of care for social care reasons per 1,000
population aged 75 or over (SCA/001) 4.83 0.13 Deteriorated
The rate of older people (aged 65 or over) supported in the community
per 1,000 population aged 65 or over at 31 March (SCA/002a) 67.30 -7.19 Deteriorated
The rate of older people (aged 65 or over) w hom the authority supports in care homes per 1,000 population aged 65 or over at 31 March
(SCA/002b) 18.85 -1.19 Improved
The percentage of adult protection referrals completed w here the risk
has been managed (SCA/019) 95.60 1.15 Improved
The percentage of children looked after at 31 March w ho have experienced one or more changes of school, during a period or periods of being looked after, w hich w ere not due to transitional arrangements,
in the 12 months to 31 March (SCC/002) 13.48 -0.37 Improved
The percentage of children looked after on 31 March w ho have had
three or more placements during the year (SCC/004) 9.03 0.76 Deteriorated
The percentage of initial assessments that w ere completed during the year w here there is evidence that the child has been seen alone by the
Social Worker (SCC/011b) 44.78 1.92 Improved
The percentage of young people formerly looked after w ith w hom the
authority is in contact at the age of 19 (SCC/033d) 93.32 -0.12 Deteriorated
The percentage of young people formerly looked after w ith w hom the authority is in contact, w ho are know n to be in suitable, non-emergency
accommodation at the age of 19 (SCC/033e) 93.09 0.35 Improved
The percentage of young people formerly looked after w ith w hom the authority is in contact, w ho are know n to be engaged in education,
training or employment at the age of 19 (SCC/033f) 59.51 4.71 Improved
The average external qualifications point score for 16 year old looked after children, in any local authority maintained learning setting
(SCC/037) 276.21 14.19 Improved
The percentage of eligible, relevant and former relevant children that
have pathw ay plans as required (SCC/041a) 91.21 1.96 Improved
Housing
The percentage of all potentially homeless households for w hom
homelessness w as prevented for at least 6 months (HHA/013) 65.38 -1.05 Deteriorated
The average number of calendar days taken to deliver a Disabled
Facilities Grant (PSR/002) 238.44 0.44 Deteriorated
The percentage of private sector dw ellings that had been vacant for more than 6 months at 1 April that w ere returned to occupation during
the year through direct action by the local authority (PSR/004) 11.76 2.54 Improved
Source: Welsh Government
5 | P a g e
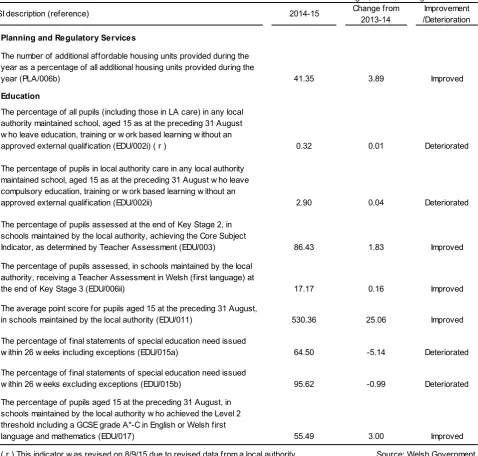
Table 1 (continued): Summary of Wales Level NSI Performance
NSI description (reference) 2014-15 Change from
2013-14
Improvement /Deterioration
Planning and Regulatory Services
The number of additional affordable housing units provided during the year as a percentage of all additional housing units provided during the
year (PLA/006b) 41.35 3.89 Improved
Education
The percentage of all pupils (including those in LA care) in any local authority maintained school, aged 15 as at the preceding 31 August w ho leave education, training or w ork based learning w ithout an
approved external qualification (EDU/002i) ( r ) 0.32 0.01 Deteriorated
The percentage of pupils in local authority care in any local authority maintained school, aged 15 as at the preceding 31 August w ho leave compulsory education, training or w ork based learning w ithout an
approved external qualification (EDU/002ii) 2.90 0.04 Deteriorated
The percentage of pupils assessed at the end of Key Stage 2, in schools maintained by the local authority, achieving the Core Subject
Indicator, as determined by Teacher Assessment (EDU/003) 86.43 1.83 Improved
The percentage of pupils assessed, in schools maintained by the local authority, receiving a Teacher Assessment in Welsh (first language) at
the end of Key Stage 3 (EDU/006ii) 17.17 0.16 Improved
The average point score for pupils aged 15 at the preceding 31 August,
in schools maintained by the local authority (EDU/011) 530.36 25.06 Improved
The percentage of final statements of special education need issued
w ithin 26 w eeks including exceptions (EDU/015a) 64.50 -5.14 Deteriorated
The percentage of final statements of special education need issued
w ithin 26 w eeks excluding exceptions (EDU/015b) 95.62 -0.99 Deteriorated
The percentage of pupils aged 15 at the preceding 31 August, in schools maintained by the local authority w ho achieved the Level 2 threshold including a GCSE grade A*-C in English or Welsh first
language and mathematics (EDU/017) 55.49 3.00 Improved
( r ) This indicator w as revised on 8/9/15 due to revised data from a local authority. Source: Welsh Government
[image:5.595.53.532.85.541.2]6 | P a g e
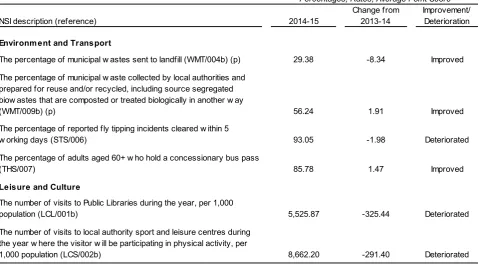
Table 1 (continued): Summary of Wales Level NSI Performance
Percentages, Rates, Average Point Score
NSI description (reference) 2014-15
Change from 2013-14
Improvement/ Deterioration
Environment and Transport
The percentage of municipal w astes sent to landfill (WMT/004b) (p) 29.38 -8.34 Improved
The percentage of municipal w aste collected by local authorities and prepared for reuse and/or recycled, including source segregated biow astes that are composted or treated biologically in another w ay
(WMT/009b) (p) 56.24 1.91 Improved
The percentage of reported fly tipping incidents cleared w ithin 5
w orking days (STS/006) 93.05 -1.98 Deteriorated
The percentage of adults aged 60+ w ho hold a concessionary bus pass
(THS/007) 85.78 1.47 Improved
Leisure and Culture
The number of visits to Public Libraries during the year, per 1,000
population (LCL/001b) 5,525.87 -325.44 Deteriorated
The number of visits to local authority sport and leisure centres during the year w here the visitor w ill be participating in physical activity, per
1,000 population (LCS/002b) 8,662.20 -291.40 Deteriorated
[image:6.595.55.535.83.347.2]