POUR L'OBTENTION DU GRADE DE DOCTEUR ÈS SCIENCES
acceptée sur proposition du jury: Dr P. Pu Faltings, présidente du jury Dr D. Gatica-Perez, directeur de thèse
Prof. A. Nijholt, rapporteur F. Pianesi, rapporteur Prof. J.-Ph. Thiran, rapporteur
Computational Modeling of Face-to-Face Social Interaction
Using Nonverbal Behavioral Cues
THÈSE N
O4986 (2011)
ÉCOLE POLYTECHNIQUE FÉDÉRALE DE LAUSANNE
PRÉSENTÉE LE 6 mAI 2011
À LA FACULTÉ SCIENCES ET TECHNIQUES DE L'INGÉNIEUR LABORATOIRE DE L'IDIAP
PROGRAmmE DOCTORAL EN GÉNIE ÉLECTRIQUE
Suisse 2011 PAR
i
Abstract
The computational modeling of face-to-face interactions using nonverbal behavioral cues is an emerging and relevant problem in social computing. Studying face-to-face in-teractions in small groups helps in understanding the basic processes of individual and group behavior; and improving team productivity and satisfaction in the modern work-place. Apart from the verbal channel, nonverbal behavioral cues form a rich communica-tion channel through which people infer - often automatically and unconsciously - emo-tions, relationships, and traits of fellow members.
There exists a solid body of knowledge about small groups and the multimodal nature of the nonverbal phenomenon in social psychology and nonverbal communication. How-ever, the problem has only recently begun to be studied in the multimodal processing com-munity. A recent trend is to analyze these interactions in the context of face-to-face group conversations, using multiple sensors and make inferences automatically without the need of a human expert. These problems can be formulated in a machine learning framework involving the extraction of relevant audio, video features and the design of supervised or unsupervised learning models.
While attempting to bridge social psychology, perception, and machine learning, cer-tain factors have to be considered. Firstly, various group conversation patterns emerge at different time-scales. For example, turn-taking patterns evolve over shorter time scales, whereas dominance or group-interest trends get established over larger time scales. Sec-ondly, a set of audio and visual cues that are not only relevant but also robustly computable need to be chosen. Thirdly, unlike typical machine learning problems where ground truth is well defined, interaction modeling involves data annotation that needs to factor in inter-annotator variability. Finally, principled ways of intergrating the multimodal cues have to be investigated.
In the thesis, we have investigated individual social constructs in small groups like dominance and status (two facets of the so-called vertical dimension of social relations). In the first part of this work, we have investigated how dominance perceived by external ob-servers can be estimated by different nonverbal audio and video cues, and affected by an-notator variability, the estimation method, and the exact task involved. In the second part,
we jointly study perceived dominance and role-based status to understand whether dom-inant people are the ones with high status and whether dominance and status in small-group conversations be automatically explained by the same nonverbal cues. We employ speaking activity, visual activity, and visual attention cues for both the works.
In the second part of the thesis, we have investigatedgroupsocial constructs using both supervised and unsupervised approaches. We first propose a novel framework to charac-terize groups. The two-layer framework consists of a individual layer and the group layer. At the individual layer, the floor-occupation patterns of the individuals are captured. At the group layer, the identity information of the individuals is not used. We define group cues by aggregating individual cues over time and person, and use them to classify group con-versational contexts - cooperative vs competitive and brainstorming vs decision-making. We then propose a framework to discover group interaction patterns using probabilistic topic models. An objective evaluation of our methodology involving human judgment and multiple annotators, showed that the learned topics indeed are meaningful, and also that the discovered patterns resemble prototypical leadership styles -autocratic,participative, andfree-rein- proposed in social psychology.
Key words:Small group, face-to-face interactions, nonverbal cues, automatic social in-ference, group conversational context, cooperative behavior, competitive behavior, brain-storming, decision-making, group behavior discovery, topic models.
iii
R´esum´e
La mod´elisation informatique des interactions face-`a-face `a partir de manifestations non verbales du comportement constitue un probl`eme ´emergent et pertinent en sociolo-gie informatique. Etudier les interactions directes de petits groupes permet de mieux com-prendre les processus fondamentaux qui r´egissent les comportements individuels et de groupe, ainsi que d’am´eliorer la productivit´e et la satisfaction de groupe en milieu profes-sionel. En plus du discours, le comportement non verbal constitue un riche moyen de com-munication par lequel les gens d´eterminent (souvent automatiquement et inconsciem-ment) les ´emotions, les rapports ainsi que la personnalit´e des membres du groupe.
Dans le domaine de la psychologie sociale et de la communication non-verbale, il existe d´eja un solide ensemble de connaissances concernant l’´etude de petits groupes et la nature multimodale des manifestations non verbales. Toutefois, ce n’est que r´ecemment que la communaut´e du traitement du signal multimodal a commenc´e `a s’attaquer au probl`eme. Une tendance r´ecente consiste `a analyser les interactions `a l’aide de plusieurs capteurs, dans le cas de conversations de groupe en face-`a-face, et `a ´etablir des inf´erences automa-tiquement sans l’intervention humaine d’un expert. Ces probl`emes peuvent ˆetre formul´es dans un cadre d’apprentissage automatique, impliquant l’extraction de primitives audi-tives et visuelles pertinentes, ainsi que la conception de mod`eles d’apprentissage avec ou sans ´etiquettes.
En tentant de lier psychologie sociale, perception sociale et apprentissage automatique, certains facteurs doivent ˆetre pris en consid´eration. Tout d’abord, diff´erents motifs de con-versation de groupe apparaissent `a diff´erentes ´echelles de temps. Par exemple, un change-ment de locuteur se manifeste temporellechange-ment de mani`ere locale, alors qu’une relation de domination ou l’´emergence de tendances de groupe sont observ´ees sur une ´echelle de temps plus ´etendue. Par ailleurs, outre la pertinence de l’ensemble de signaux visuels et auditifs choisis, leur tractabilit´e informatique revˆet une importance capitale. De plus, con-trairement aux tˆaches habituelles trait´ees en apprentissage automatique dans lesquelles la v´erit´e de terrain est disponible, la mod´elisation des interactions implique de prendre en compte la variabilit´e des annotations provenant de diff´erents annotateurs. Enfin, des m´ethodes d’int´egration de signaux mutimodaux doivent ˆetre explor´ees.
Dans cette th`ese, nous nous sommes int´eress´es aux concepts sociaux de domination et de statut, qui sont deux facettes de la dimension dite verticale des relations sociales. Dans une premi`ere partie, nous avons ´etudi´e comment la domination peut ˆetre estim´ee `a l’aide de diff´erentes manifestations sonores et visuelles et affect´ee par la variabilit´e inter-annotateur, par la m´ethodes d’estimation et par la tˆache exacte en question. Dans une sec-onde partie, nous ´etudions conjointement la domination et le statut bas´e sur le rˆole afin de comprendre si les personnes dominantes sont celles qui ont un statut ´elev´e et si la domi-nation et le statut dans les conversations en petits groupes peuvent ˆetre automatiquement expliqu´es par les mˆemes ´el´ements non verbaux. Pour ces deux tˆaches, nous avons employ´e l’activit´e de parole, l’activit´e visuelle et l’attention visuelle.
Dans la deuxi`eme partie de la th`ese, nous avons explor´e les mˆemes concepts sociaux de mani`ere `a la fois supervis´ee et non supervis´ee. Nous proposons tout d’abord un cadre pour caract´eriser les groupes. Cette approche consiste en deux niveaux. Au niveau indi-viduel, l’implication de chaque individu dans la conversation est d´etermin´ee. Au niveau du groupe, l’identit´e des individus n’est pas utilis´ee. Les groupes sont d´efinis en regroupant les signaux individuels de chaque personne sur une p´eriode de temps et en les utilisant pour classifier la nature des conversations du groupe : coop´eratif vs comp´etitif et brainstorm-ing vs prise de d´ecision. Nous proposons ensuite une approche pour d´ecouvrir les mo-tifs d’interactions de groupe bas´ee sur des mod`eles probabilistes appel´es ”topic models”. Une ´evaluation objective de notre m´ethodologie bas´ee sur le jugement humain et faisant intervenir plusieurs annotateurs r´ev`ele que les motifs appris sont en effet significatifs et ´egalement que les tendances d´ecouvertes s’apparentent `a des prototypes de style de lead-ership propos´es en psychologie sociale : leadlead-ership autocratique, leadlead-ership laisser-faire, ou leadership d´emocratique.
Mots cl´es : Petits groupes, interactions face-`a-face, comportement non verbal, inf´erence sociale automatique, contexte conversationnel de groupe, comportement coop´eratif, comportement comp´etitif, brainstorming, prise de d´ecision, d´ecouverte de comportement de groupe, mod`eles `a topic.
Acknowledgements
First and foremost I would like to thank my supervisor Daniel Gatica Perez, for choosing me to work on this interesting thesis. I am greatly indebted to his perfect mentoring, and support - both technical and personal. Interactions with him are always positive and fruitful. I would always cherish this 4 years experience and take back plenty of wisdom that he has happily shared with me.
I also would like to thank my wife Kavitha. Her constant encouragement and sacrifices need special mention. I attribute a lot of my character and scholarship to my parents. Thanks to them for that. I also thank my lovely brother and all my relatives who have supported me.
I am grateful to the contribution of my thesis committee - Fabio Pianesi, Anton Nijholt, Jean-Philippe Thiran, Daniel Gatica Perez, and Pearl Pu - for being part of my thesis and providing con-structive feedbacks to improving it.
Collaborating with Sileye, Hayley, Jean-Marc, Chuohao, Bogdan, Taemie, and Dayra was a great learning opportunity. Sileye and Hayley supported me a lot in the beginning of my PhD. I would also like to thank all the group members of the social computing group - Radu, Kate, Joan, Paco, Dayra, Oya, Hari, Gokul, and Minh-Tri. The group’s diversity and talent is amazing. I had lots of opportunities to interact with Jean-Marc’s group. Learnt a lot in their reading groups.
Idiap is a great environment. Thanks to Herve for creating such a place. The support staff at Idiap -Nadine, Sylvie, Chris, Ed, Vincent, Valerie, Frank, Bastien, Norbert, Cedric, and Tristan - are very effective. Thank you guys. Also thanks to EPFL support staff. They are very professional indeed.
I should also thank my officemates Alex, Majid, Venki, Kate, Stefan, Radu, Remi, Chris, CC -for adding life to the office. Thanks to Indian friends in Martigny - Joel, Shakeela, Venki, Abhilasha, Anindya, Jagan, Hari, Gokul, Sriram, Harsha, Ramya, Murali, Lakshmi, Saheer, Francina; and Lausanne - Prakash, Viswa, Perumal, Arvind for adding life to life. It was fun to share apartment with Deepu and
Sriram. Azhagu and his family, Michelle, Muneer, and Patricia have been a great support for me and my wife.
Thanks also to Mathew, Alex, Laurent, Harsha, Hari for helping with the thesis. Mathew has been a source of knowledge and experience for the past 4 years. Fabio helped with the rehearsal of thesis defence. Thanks to ‘apple’ Gokul for much needed support in coding.
I take this opportunity to acknowledge some people who have shaped my life. My uncle Mr. Murthy who inspired me to think big. Mr. Arun Kumar, my maths teacher challenged me to think and gener-alize, rather than memorize. Professor P.V. Ramakrishna who inspired students to achieve. Dr. Mala John, Prof. Rajgopal, Dr. Ganesh Murthy, and Dr. Shanmukh were some of my well-wishers. Akash, Dina, Anusha, Sevvel, Jayanthi, Swarna, Rat, Oswin, Suresh, Mathi, Divya, Anand, Prakash, Megha, Gokul, Arun, Chandra are some of my good and supportive friends.
Doing PhD has its ups and downs. I express my sincere apologies if I had hurted someone’s feelings or expectations during the last four years. Hope my thesis is atleast a drop in the ocean of knowledge created by numerous research scholars over hundreds of years.
I also would like to acknowledge my funding sources - US Video Analysis and Content Extraction (VACE) project and the Swiss National Center of Competence in Research (NCCR) on Interactive Mul-timodal Information Management (IM2).
Contents
1 Introduction 1
1.1 Objective . . . 2
1.2 Motivation . . . 2
1.3 Related work . . . 4
1.3.1 Group interaction in social psychology . . . 4
1.3.2 Nonverbal cues in social psychology . . . 5
1.3.3 Automating nonverbal cue extraction . . . 5
1.3.4 Computational modeling of group interaction . . . 6
1.4 Contribution . . . 9
1.5 Organization . . . 10
2 Computational Modeling of Dominance 11 2.1 Related work . . . 13
2.1.1 Dominance in social psychology . . . 13
2.1.2 Dominance in social computing . . . 15
2.2 Our approach . . . 17
2.3 Meeting data and dominance tasks . . . 18
2.3.1 Meeting data . . . 18
2.3.2 Annotating the data . . . 19
2.3.3 Analysis of the annotations . . . 20
2.4 Audio and visual nonverbal cues for dominance modeling . . . 22
2.4.1 Audio cues . . . 22 vii
2.4.2 Visual activity cues . . . 24
2.4.3 Visual attention cues . . . 27
2.5 Models for dominance estimation . . . 31
2.5.1 Unsupervised model . . . 31
2.5.2 Supervised model . . . 32
2.5.3 Experimental protocol . . . 32
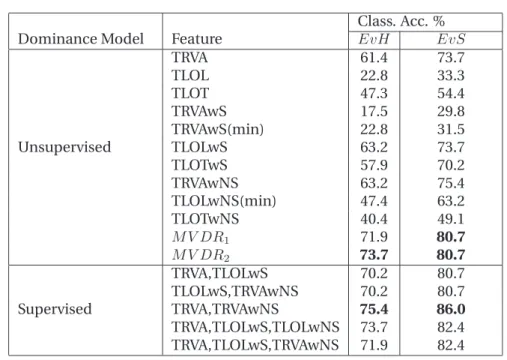
2.6 Classifying the Most-Dominant person . . . 33
2.6.1 Full-agreement data set . . . 33
2.6.2 Majority-agreement data set . . . 39
2.7 Classifying the Least-dominant person . . . 42
2.7.1 Full-Agreement data-set . . . 43
2.7.2 Majority-agreement data-set . . . 46
2.8 Discussion and Conclusion . . . 47
3 Beyond Dominance: estimating status 53 3.1 Related work . . . 55
3.1.1 Related work on role modeling . . . 55
3.1.2 Related work on status modeling . . . 56
3.2 Experimental setup: Meeting data and tasks . . . 58
3.2.1 Dominance Task: Estimate the most-dominant person . . . 58
3.2.2 Status Task: Estimate the project manager . . . 58
3.3 Nonverbal cues . . . 58
3.4 Estimation and evaluation method . . . 60
3.5 Results . . . 61
3.5.1 Audio cues . . . 62
3.5.2 Visual activity cues . . . 63
3.5.3 Visual attention cues . . . 64
3.5.4 Centrality measures . . . 66
CONTENTS ix
4 Classifying group conversational context 69
4.1 Related Work . . . 70
4.2 Our Approach . . . 72
4.2.1 Individual nonverbal cue extraction . . . 72
4.2.2 Group nonverbal cue extraction . . . 74
4.2.3 Group conversational context classification . . . 75
4.3 Classifying cooperative vs competitive interaction . . . 76
4.3.1 Meeting datasets . . . 76
4.3.2 Experiments and results . . . 77
4.4 Classifying brainstorming vs decision-making interaction . . . 81
4.4.1 Meeting dataset . . . 81
4.4.2 Experiments . . . 83
4.4.3 Results . . . 84
4.5 Discussion and Conclusion . . . 86
5 Mining group nonverbal conversational patterns 89 5.1 Related Work . . . 90
5.2 Our Approach . . . 91
5.3 Low level Cue extraction, Bag-of-NVPs, and the Topic model . . . 93
5.3.1 Low level nonverbal cue extraction . . . 93
5.3.2 Bag-of-NVPs generation: . . . 95
5.3.3 Latent Dirichlet Allocation (LDA) topic model . . . 98
5.3.4 From interaction slices to group characterization . . . 99
5.4 Meeting data . . . 100
5.5 Experiments and results . . . 100
5.5.1 Bag-of-NVPs over varying slice duration . . . 101
5.5.2 LDA based pattern discovery . . . 102
5.6 Discussion and Conclusion . . . 109
A Objective evaluation: Human annotation 117
List of Figures
1.1 Thesis overview: shows the problem of social inference in humans, social psychology, and computational modeling. Social psychology literature has studied human percep-tion using nonverbal behavior. Computapercep-tional methods broaden the scope of social inference modeling by automating cue extraction; and jointly studying multiple behav-ioral cues and social constructs using machine learning frameworks. . . 3 2.1 Flow diagram of our approach. . . 17 2.2 Plan view of the meeting room set up. . . 18 2.3 Examples of the seven camera views available in the AMI meeting room. The top row
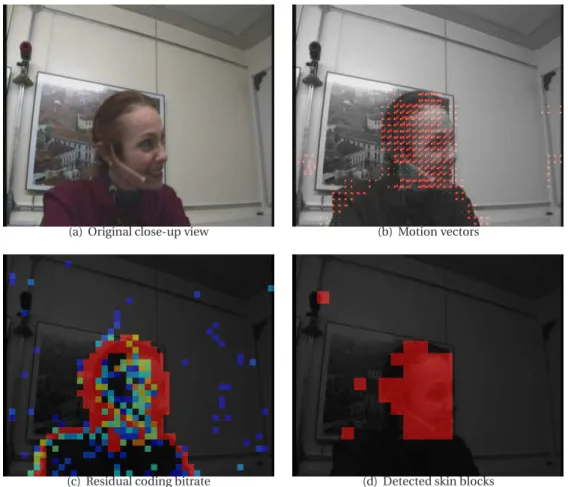
shows the right, centre and left cameras, while the bottom row shows the view from each of the close up cameras. . . 19 2.4 Illustration of compressed domain features. (a) Shows the original image. (b) Shows
the direction of motion vectors. (c) Shows the residual coding bitrate at different pixel locations (red means high magnitude). (d) Shows the locations where skin color was detected in red color. . . 25 2.5 (a). Shows the top view of the meeting room. (b). Shows the side camera views and the
estimated visual focus of participants using side-view camera views. Each of the partic-ipants is labeled and their focus of attention is displayed above their head (T stands for Table and S stands for Slide-screen). Colored rectangle around the head shows the head location and colored arrows shows the head pose of each of the participants. The white transparent box placed on participant A shows that her speaking status is ‘true’. . . 28 2.6 Flow diagram showing our experimental protocol. . . 33
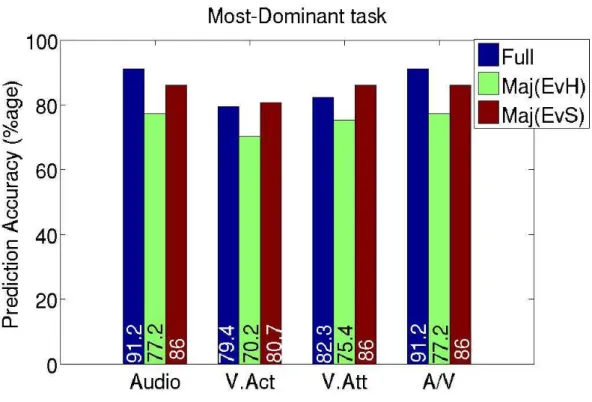
2.7 Scatter plots of the total speaking and visual activity length, where the red crosses show the data points belonging to the positive class and the black circles show the negative class in each case. . . 37 2.8 Comparison of the best performance values for the most-dominant estimation tasks.
A:Audio, V. Act: Visual Activity, V. Att: Visual Attention, A/V: Audio-Visual. . . 43 2.9 Comparison of the best performance values for the least-dominant estimation tasks.
A:Audio, V. Act: Visual Activity, V. Att: Visual Attention, A/V: Audio-Visual. . . 47 3.1 Venn diagram showing overlapping and non-overlapping subsets of most-dominant
and high-status person data. . . 62 3.2 Histogram plots of normalised Total Speaking Length for both the most-dominant (MD)
and project manager (PM) task. . . 64 3.3 Histogram plots of normalised Total Speaking First after another participant (TSF) for
both the most-dominant (MD) and project manager (PM) task. . . 65 4.1 Block Diagram of our work. . . 73 4.2 Nonverbal Cue Extraction. . . 73 4.3 Top: Snapshot from an AMI meeting, showing the participants from two side-view
cam-era view. Bottom: Snapshot of an Apprentice meeting - highlighting the high-status leader (Trump) -bottom leftand a long-shot of the board-room meeting -bottom right. 77
4.4 Normalized histograms of GIT and GTDM in the two meeting datasets. . . 79 4.5 Classification using SVM in the feature space of GIT and GTDM. . . 80 4.6 Top-left: Snapshot from the AMI meeting, showing the participants from the
center-view camera. Top-right: Distribution of speaking length, speaking turns, and success-ful interruptions among the participants. Bottom-left: The evolution of the Group-Interruption-to-Turns Ratio with time. Bottom-right: The evolution of the Group Turn Distribution Measure with time. . . 80 4.7 Sociometric badge developed by Human Dynamics group, MIT Media Lab (Olgu´ın and
Pentland, 2008). . . 82 4.8 Example of an interacting group wearing sociometric badges around the neck. . . 82
LIST OF FIGURES xiii 4.9 Performance of the group cues on classifying the brainstorming and decision-making
meetings during collocated setting (Task 1). . . 84 4.10 Performance of the group cues on classifying the brainstorming and decision-making
meetings during distributed setting (Task 2). . . 85 4.11 Performance of the group cues on classifying the brainstorming and decision-making
meetings (Task 3). . . 85 4.12 Performance of combination of group features on predicting the brainstorming and
decision-making meetings. . . 86
5.1 Overview of the group NVP discovery process using topic models. . . 93 5.2 Diagram showing the features to characterize individual and group behavior
(generic-based and leadership-(generic-based) extracted in our approach. See main text for details. . . 94 5.3 Example joint histograms for each of the Speaking Distribution NVPs other thanSilence. 96
5.4 Latent Dirichlet Allocation (LDA) model . . . 100 5.5 Empirical distribution of Speaking Distribution patterns at different time scales (from
30-seconds to 5-minute). x-axis of each of the sub-figure is the classes and y-axis is the probability of the particular class. . . 102 5.6 Empirical distribution of leadership patterns at two different time scales (2-minute and
5-minute). x-axis of each of the sub-figure is the classes and y-axis is the probability of the particular class. ‘0’ corresponds to the case when there is silence, ‘L’ (resp. ‘NL’) when leader (resp. someone else) has maximum feature value. . . 103 5.7 Leadership styles by Lewin et al. The blue envelope shows the emphasis (in terms of
power) that is placed on the various group members. . . 104 5.8 Speech segmentation of two sample 5-minute meeting slices for each of the three topics
-autocratic,participativeandfree-rein. The four participants are marked 1, 2, 3,and 4 along the y-axis. The position marked 1 corresponds to the leader (project manager) in all cases. . . 105 5.9 Topic distribution over groups at 5-minute scale (DL combination). . . 106
5.10 Topic evolution for selected groups at 5-minute scale (DL combination). The topics are color coded -autocraticin red,participativein light-blue,free-reinin yellow. The x-axis represents time. The y-axis represents meeting sessions. . . 107 5.11 Topic distribution over groups at 2-minute scale (DL combination). . . 109 5.12 Three snapshots of a group interaction - at 2-minute, 3-minute, 4-minute - with the
top left panel showing the center view camera, the top right showing the speech seg-mentation evolution w.r.t time in x-axis and the participants in the y-axis, the bottom left panel showing the low level cues for each of the participant, and the bottom right panel showing the topic distribution - red beingautocratic, blue beingparticipativeand green beingfree-reinfor the intervals 0-2 min, 1-3 min, and 2-4 min. This meeting slice corresponds to group 5, which isparticipativeat both 2-minute and 5-minute time scales.110 5.13 Speech segmentation of two sample 5-minute meeting slices for each of the three
top-ics -Leader-domination,Group Interaction,Monologue. The x-axis indicates time. The four participants are marked 1, 2, 3, and 4 along the y-axis. The position marked 1 cor-responds to the leader (project manager) in all cases. . . 111 5.14 Speech segmentation of two sample 5-minute meeting slices for each of the three topics
-Laid-back monologue,Monologue with brief exchanges,Interaction hot-spot. The x-axis indicates time. The four participants are marked 1, 2, 3, and 4 along the y-x-axis. The position marked 1 corresponds to the leader (project manager) in all cases. . . 112
List of Tables
2.1 Dominance tasks and corresponding data-sets. . . 21 2.2 Glossary of feature abbreviations . . . 31 2.3 Performance ofAudiocues forMost-dominant person withFull-agreement data. . . 34 2.4 Performance of Visual Activity cues for Most-dominant person task with Full
-agreement data. . . 37 2.5 Performance of Visual Attention cues for Most-dominant person task with Full
-agreement data. . . 38 2.6 Performance of Audio-Visual cues with Most-dominant person task with Full
-agreement data. . . 38 2.7 Performance ofAudiocues forMost-dominant person task withMajority-agreement
data. . . 40 2.8 Performance of Visual Activity cues for Most-dominant person task with Majority
-agreement data. . . 41 2.9 Performance ofVisual Attentioncues forMost-dominant person task withMajority
-agreement data. . . 42 2.10 Performance of Audio-Visual cues for Most-dominant person task with Majority
-agreement data. . . 42 2.11 Performance ofAudiocues forLeast-dominant person task withFull-agreement data . 44 2.12 Performance of Visual Activity cues for Least-dominant person task with Full
-agreement data. . . 45 xv
2.13 Performance of Visual Attention cues for Least-dominant person task with Full
-agreement data. . . 45
2.14 Performance ofAudio-Visualcues with supervised model forLeast-dominant person task withFull-agreement data. . . 46
2.15 Performance ofAudio, Visual, and Audio-Visualcues forLeast-dominant classification task withMajority-agreement data. . . 48
3.1 Glossary of feature abbreviations. . . 60
3.2 Performance ofAudiocues for estimating the most-dominant person and the project manager. . . 63
3.3 Performance ofVisual Activitycues for estimating the most-dominant person and the project manager. . . 64
3.4 Performance ofVisual Attentioncues for estimating the most-dominant person and the project manager. . . 66
3.5 Performance ofCentralitymeasures for estimating the most-dominant person and the Project Manager. . . 66
4.1 Glossary of abbreviations for the group cues. . . 75
4.2 Accuracy (%) of speaking activity based nonverbal cues for classification of group con-versational context. In the caption, GNB stands for Gaussian Naive Bayes classifier and SVM-lin is the short form of SVM using a linear kernel. . . 78
5.1 LDA based topic discovery at 5-minute scale (DL combination). . . 104
5.2 Evaluation: Confusion matrix between the ground-truth and the model output . . . 105
5.3 LDA based discovery at 2-minute scale (DL combination). . . 108
5.4 LDA based discovery at 5-minute scale (OL combination). . . 108
Chapter 1
Introduction
Computational modeling of face-to-face interaction using nonverbal behavioral cues is an emerg-ing and relevant problem in social computemerg-ing. Studyemerg-ing face-to-face interactions provide insights into the functioning of small groups. With teams becoming ubiquitous in business, government, and non-governmental organizations, the need to understand group dynamics and connecting them to group productivity and satisfaction has become more and more relevant. Though verbal communication plays a significant role, the nonverbal channel too conveys a wealth of information about group dy-namics (Knapp and Hall, 1978). Also, nonverbal analysis is privacy-sensitive as ‘what is spoken’ is never made use of. Recent technological trends in sensing, signal processing, and machine learning have enabled automatic sensing, cue extraction, and modeling of social interactions.
Social psychology literature has studied small groups and nonverbal behavior for more than half a century. Researchers have tried to understand various issues related to formation of small groups; structure in small groups- status, norms, roles, cohesion; and performance -role of leaderhip, pro-ductivity, and decision-making (Levine and Moreland, 1990; Pooleet al., 2004). Nonverbal cues have been known to be key in social inference of emotions, expectancies, relationships, and traits of human subjects (Hassinet al., 2005). Often expression and perception of nonverbal behavior are known to be automatic and unconscious (Hassinet al., 2005).
With the new framework of automatic modeling of social interactions, both individual and group behavior could be understood and modeled, by employing multimodal nonverbal cues that can be robustly extracted. Analyzing and modeling social interaction helps in understanding human
ior and retrieving meeting recordings using queries related to behavior. Computationally efficient method allow the possibility to support online group collaboration. A recent trend is to analyze so-cial interaction in the context of group conversations, using multiple sensors like cameras and mi-crophones and make inferences automatically without the need of a human expert. These problems can be formulated in a machine learning framework involving the relevant audio and video feature extraction and supervised or unsupervised learning models.
When attempting to bridge social psychology and machine learning, certain factors have to be con-sidered. Firstly, unlike typical machine learning problems where ground truth is well defined, group interaction modeling involves data annotation that needs to factor in inter-annotator variability. Sec-ondly, a set of audio and visual cues that are not only relevant but also robustly computable need to be chosen. Thirdly, principled methods to combine these features have to be investigated. Finally, var-ious group conversation patterns emerge at different time-scales. For example, turn-taking patterns evolve over shorter time scales (Gatica-Perez, 2006), whereas dominance or group-interest trends get established over larger time scales.
1.1
Objective
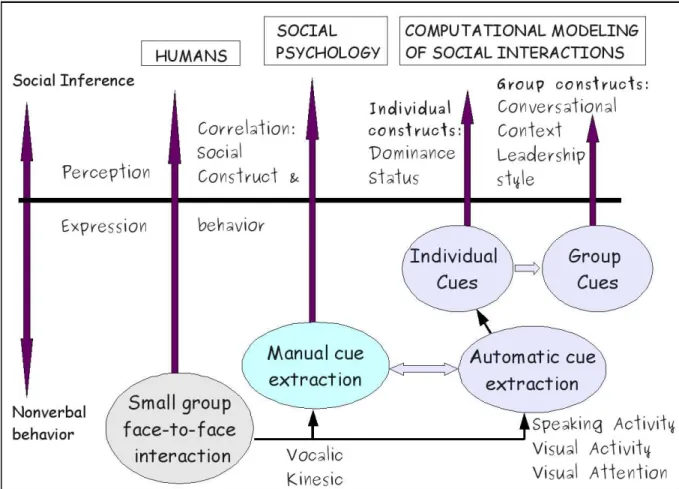
The primary objective of this thesis is to design and develop computational models for a few fun-damental social constructs in small group interaction including dominance, status, group conver-sational context, and leadership styles. The setting for these problems is face-to-face conversations using multimodal nonverbal cues. Our work places emphasis on automatic cue extraction, joint mod-eling of nonverbal cues, joint understanding of social constructs, and characterization of both indi-vidual and group behavior. Figure 1.1 illustrates our work in the thesis. There exists a solid body of knowledge about the multimodal nature of these phenomena in social psychology. However, the problem has only recently begun to be studied in the multimodal processing community.
1.2
Motivation
We foresee three types of applications that could be developed when the computational nonverbal modeling of face-to-face interaction matures as a research field:
1.2. MOTIVATION 3
Figure 1.1. Thesis overview: shows the problem of social inference in humans, social psychology, and computational modeling. Social psychology literature has studied human perception using nonverbal behavior. Computational meth-ods broaden the scope of social inference modeling by automating cue extraction; and jointly studying multiple be-havioral cues and social constructs using machine learning frameworks.
1. Behavior-based media retrieval: The potential applications of automatic nonverbal analysis of face-to-face group interactions in workplace include identifying leadership skills and monitor-ing team cohesiveness. From a human resource perspective, analyzmonitor-ing group behavior could signal the need for a team-building exercise or a leadership change. Tracking teams could also indicate what types of behavior teams are mostly engaged in - for example cooperative or com-petitive behavior.
2. Behavior-based support of individuals and groups: Social inference machines could be part of relevant applications including self-assessment, training, and educational tools (Pentland, 2005), and of systems to support group collaboration (DiMiccoet al., 2004). There is support from the social psychology literature about the fact that people who display cues like verbal
flu-ency, well modulated voice, etc are often seen as more competent and become more influen-tial, whereas displaying dominant behavior might be an ineffective strategy to gain influence as compared to (Ridgeway, 1987). Also, nonverbal self-accuracy (how aware are we about our own nonverbal behavior) is not uniform for all nonverbal cues, and cognitive activity can reduce this accuracy even further. This motivates the need for measuring human behavior automatically for self-assessment.
3. Tools for social psychology research: Barring few exceptions, the nonverbal cues studied in the social psychology literature have been manually coded. This process is highly labour-intensive and expensive. With the availability of ubiquitous and infrastructure-based sensors and auto-matic extraction of nonverbal cues, the cue extraction process can be easily automated. As more interaction data becomes available, computational models to extract behavior using multiple cues could become common in the future.
1.3
Related work
In this section, we first review the literature on small-group and nonverbal behavior research in social psychology. Then, we review the state-of-the-art on automatic nonverbal cue extraction and computational modeling of social interactions.
1.3.1
Group interaction in social psychology
Groups have been traditionally looked as vehicles for influencing members, performing tasks, and improving member self-understanding (Arrowet al., 2000), thanks to some of the pioneering works were done by Lewin, Bales, and Mc. Grath. Lewin’s work studied the need for groups, importance of the member-member relations and of member-group relations (Lewin and Lewin, 1948). Bales developed a systematic method of observing and describing groups emphasizing that the mental pro-cesses of individuals take place in systematic contexts which can be measured and hence allow for explanation and estimation of behavior (Bales, 1950). McGrath gave special emphasis to temporal processes in group interaction and task performance (McGrath, 1984). A large volume of work has followed investigating issues related to composition of groups; structural issues such as status, norms, roles, and cohesion; and performance issues such as group decision-making, productivity, and
lead-1.3. RELATED WORK 5 ership in small groups. Some of the more recent reviews on small group literature include (Levine and Moreland, 1990; Pooleet al., 2004). Overall the field is clearly active and of particular importance for our work are the connections between small groups and nonverbal communication in the work-place (Remland, 2006). More specifically, the vertical aspects relating to power, dominance, status, hierarchy, and related concepts and nonverbal behavior (Hallet al., 2005).
1.3.2
Nonverbal cues in social psychology
The history of the empirical study of nonverbal behavior begins with Charles Darwin ( (Darwin, 1965), work of 1872 reprinted), where he studied the expression of emotions in man and animals. The multifunctionality of nonverbal expression as asymptom(of the expresser‘s state), as asymbol (of a socially shared meaning category), and as anappeal(a social message toward others) is well known (Methodological issues in studying nonverbal behaviorin (Harriganet al., 2008)). Nonverbal cues have been documented extensively in the study of relationship of individuals in dyads, groups, and group as a whole (Knapp and Hall, 1978; Manusov and Patterson, 2006; McNeill, 2000; Hassinet al., 2005). Both expression and perception of many of these cues are often automatic and unconscious (Hassin
et al., 2005). Nonverbal cues include among othersvocalic- prosody, speaking turns, laughter - and
kinesic - gestures, moves, gaze - (Dunbar and Burgoon, 2005b). Various nonverbal cues correlated with social constructs like dominance, status, and power (Hallet al., 2005) and individual constructs like personality have been extensively studied (Rotter, 1966; John and Srivastava, 1999). Turn-taking patterns, gazing, smiling, touching, and various body positions can be used to infer social verticality in human relations (Hallet al., 2005). Our work takes inspiration from the nonverbal behavior literature to extract relevant cues, robustly and automatically.
1.3.3
Automating nonverbal cue extraction
Various nonverbal cues have been automatically extracted in the signal processing and computer vision literature. So far, extraction of turn-taking patterns has been the most robust, which involve recognizing ‘when someone speaks’ using close-talk or distant microphones (Basu, 2002). Prosodic cues describing ‘how someone speaks’, using cues such as energy, pitch frequency, rate of speech have been studied to infer ‘affect’ and group interest (Wrede and Shriberg, 2003), (Harriganet al., 2008).
Automatic facial expression analysis to infer emotional states has also been extensively studied (Tian
et al., 2005). Visual attention cues have been investigated for the meeting space using both head-pose (Otsukaet al., 2007; Murphy-Chutorian and Trivedi, 2009; Ba and Odobez, 2010); and eye-gaze (Gorga and Otsuka, 2010). Audio-visual laughter detection (Petridis and Pantic, 2008) and smiling has also been investigated (Kumanoet al., 2009). Head-gestures like nodding, shaking have been stud-ied (Kapoor and Picard, 2001; Morencyet al., 2005; Otsukaet al., 2007). Fidgeting was investigated in (Chippendale, 2006). Some of the nonverbal cues used to infer social constructs have been referred to as ‘honest signals’, due to their uncontrollable nature both from the expressor and the perceiver’s viewpoint (Pentland, 2008). For an overiew of the audio-visual technology for a conversation scene analysis system (both offline and real-time) developed in NTT laboratories, Japan, the reader is re-ferred to (Otsuka and Araki, 2010). In this thesis, we extract automatically three types of nonverbal cues relevant to the study of verticality 1. The turn-taking cues, based on speech activity 2. Visual activity cues, extracted in the compressed domain and 3. Visual attention cues, based on head pose and use them to model social verticality.
1.3.4
Computational modeling of group interaction
In this subsection, we summarize the existing literature on individual and group behavior mod-eling in group conversations using both supervised and unsupervised approaches. As our work and review mainly concerns small groups, we do not discuss works that relate to dyadic interactions as opposed to small group interaction, although some of the pioneering works by Pentland et al. need mention, as they showed the predictive power of robustly extractable nonverbal cues (‘honest signals’) in dyadic relations (Pentland, 2008). These speech and physical activity based cues, characterized in terms of emphasis, activity, influence, and mimicry have been shown to estimate job performance, negotiation outcomes, dating outcomes, etc. This research group also pioneered the use of wearable sensors, also called sociometers (Choudhury and Pentland, 2002) for recording interactions, as op-posed to infrastruture based recordings.
1.3. RELATED WORK 7
Supervised learning approaches for modeling individual and group behavior
Regarding individual behavior modeling, attempts have been made to estimatedominant behav-ior, certainpersonality traits, and certainroles that individuals are involved in. Dominance can be defined as a personality trait or behavior involving the motive to control others, the self-perception of oneself as controlling others, and/or as a behavioral outcome (success in controlling others or their resources) (Hall et al., 2005). In (Rienks and Heylen, 2005)dominant behavior was estimated by computing speaking turns based features (like speaking time, turns, successful interruptions) using manual annotations of speaking turns and Support Vector Machines (SVM) on meetings from the M4 (MultiModal Meeting Manager) meeting corpus (McCowanet al., 2005). Personality traits, specif-ically extraversion(sociable, assertive, playful) vsintraversion (aloof, reserved, shy) were estimated using support vector regression and applied to sequences of the MS (Mission Survival) Corpus (Pi-anesiet al., 2008a). Using an influence modelfunctional rolesin meetings related to tasks and socio-emotional roles were estimated (Donget al., 2007) on the MS Corpus (Pianesiet al., 2007). The work in (Lepriet al., 2009) estimatedindividual performancefrom interaction slices. The above three works employed speaking activity cues, prosodic cues, and visual fidgeting cues. In (Vinciarelli, 2007; Garg
et al., 2008)adhoc roles in broadcast video and the AMI (Augmented Multiparty Intercation) corpus (Carletta et al., 2006) were estimated using Dynamic Bayesian Networks (DBN) and turn-taking infor-mation. Recently,emergent leadershipwas modeled using turn-taking patterns and employing score-level fusion techniques (Sanchez-Corteset al., 2010).
Regarding group behavior modeling,group activitieshave been characterized employing layered sequential approaches [either Hidden Markov Models (HMM) or DBN], where the first layer modeled the individuals’ behavior, and the second layer the activity (monologue, presentations, or discussions) in (Zhanget al., 2006; Dielmann and Renals, 2007) or conversational regimes (convergence or mono-logue, dyad-link and divergence) in (Otsukaet al., 2007). While (Zhanget al., 2006; Dielmann and Re-nals, 2007) employed speaking-activity and motion-activity in terms of blobs (region of image pixels) as the features, (Otsukaet al., 2007) employed speaking-activity and visual gaze. The latter work was also extended to estimateinterpersonal influence (Otsukaet al., 2006).Group interestwas investigated by segmenting meetings temporally into high or neutral interest level segments in HMM based super-vised framework and fusing audio-visual activity cues in (Gatica-Perezet al., 2005). Recently, group discussion dynamics was studied further with two different corpora (in two different languages) and
thegroup performancewas estimated using turn-taking patterns and the ‘honest’ signals described in the beginning of this subsection. The work employed three types of supervised models - support vector machines, hidden Markov models and the influence model (Donget al., 2011).
Unsupervised learning approaches for modeling individual and group behavior
Unlike the previous methods, unsupervised approaches do not need labeled training data. Re-garding individual behavior modeling, thepair-wise influence between participants in a group was estimated using a dynamic Bayesian approach (Basuet al., 2001). The observations were speaking activity features and influence was estimated using a variation of the coupled HMM (Hidden Markov Model) called the influence model. On the Augmented Multi-Party Interaction with Distance Access (AMIDA) corpus, theremote participant in a remote meeting was estimated (Sanchez-Corteset al., 2009). In another study, on a corpus collected from a TV show, the task was to predict theparticipant who would be firedfrom the group and who had thehighest status (Raducanu and Gatica-Perez, 2010). Unlike most other works, the group was competitive in nature i.e. the participants had to ensure that someone else was fired out of the job. The above two works employed turn-taking cues. In all the cases excepting the influence model, the best single features for the estimation tasks were investigated.
Regarding group behavior modeling, various prosody related cues correlated with interest hot-spots, where the interest level of the meeting participants was perceived to be high was studied in (Wrede and Shriberg, 2003). Other works have also attempted to quantifyinteractivity andcentrality
in meetings (Otsukaet al., 2006). The ‘honest’ signals described in the beginning of this subsection were found to be correlated withteam performance (?) andexpertise (Waber and Pentland, 2009). Re-cent findings indicate the existence of a general collective intelligence factor in groups that explains a group‘s performance on a wide variety of tasks. The research shows that this factor is not strongly correlated with the average or maximum individual intelligence of group members, but instead cor-related with the average social sensitivity of group members, the equality in distribution of conversa-tional turn-taking, and the proportion of females in the group (Woolleyet al., 2010).
We defer the detailed review of related works on dominance, status, role, online support of groups, and discovering human activity to subsequent chapters. Few recent thesis that our work relate to include (Rienks, 2007; Lepri, 2009; Dong, 2010).
1.4. CONTRIBUTION 9
1.4
Contribution
The contributions of this thesis are
– We conduct an original and systematic study of vocalic and kinesic nonverbal cues for perceived dominance estimation in small group meetings, and present a detailed objective evaluation of the performance of single and multimodal cues, and of unsupervised and supervised learning approaches (Jayagopiet al., 2009b). Our vocalic cues are based on speaking activity; and kinesic cues are computationally efficient visual activity cues in the compressed domain and visual at-tention cues use head pose. Unlike all previous computational work, we analyze the annotation of perceived dominance by multiple human observers and are thus able to analyze the impli-cations that the variation of human perception has on the performance of the automatic ap-proaches. Our source of data for this work is the publicly available AMI meeting corpus.
– We propose a novel investigation of automatic estimation of both perceived dominance and role-based status in small-group conversations (Jayagopiet al., 2008b). While some social psychol-ogy literature has found common ground for the nonverbal display and interpretation of both constructs, and recent computational literature has started to investigate models for automatic estimation of dominance or roles in conversations, no computational attempt has previously been made to study these two dimensions of social verticality jointly. We use the same set of vocalic and kinesic cues as in the dominance study. Our source of data for this work is the AMI meeting corpus.
– We propose a novel framework for characterizing group nonverbal behavior as compared to in-dividual behavior and then automatically classify group conversational context in a supervised framework. We characterize group conversational behavior by measuring speaking patterns and the overlap-silence patterns of the group as a whole. Specifically, we address two tasks: classi-fying cooperative vs competitive interactions (Jayagopiet al., 2009a) and the task of classifying brainstorming vs decision-making interactions (Jayagopiet al., 2010). Our source of data for the first task is the AMI meeting corpus and conversational data from a TV show. For the second task, we used a dataset recorded at MIT Media Lab using privacy-sensitive sociometers .
– We address the largely unexplored problem of discovering group nonverbal patterns proposing an unsupervised framework based on probabilistic topic models (Jayagopi and Gatica-Perez,
2009, 2010). We define a new group behavioral descriptor on time slices of group conversational data that is robust to several factors occuring in realistic interactions. we show that the topics discovered by our model are meaningful using ground-truth produced from external observers of the interaction. We also propose new topic-based ways of characterizing groups by aggregat-ing group behavior over multiple interactions.
1.5
Organization
This thesis is organized as follows:
– In Chapter 2, we investigate the problem of modeling dominance in small group face-to-face interactions using multimodal nonverbal cues. We systematically study both single and multiple cues using single and multiple modalities.
– In Chapter 3, we investigate both dominance and role-based status estimation in small-groups using multimodal nonverbal cues.
– In Chapter 4, we study the problem of automatically classifying group converational contexts using nonverbal behavior. We address two tasks: discriminating cooperative vs competitive in-teractions and discriminating brainstorming vs decision-making inin-teractions.
– In Chapter 5, we explore the problem of discovering group nonverbal patterns in an unsuper-vised fashion using probabilistic topic models.
– Chapter 6 provides a final discusson about the achievements and limitations of the thesis and discusses future directions.
Chapter 2
Computational Modeling of
Dominance using Nonverbal Cues
Certain people are consistently successful at dominating conversations and their results. In fact, within a few minutes of interaction among unacquainted individuals, a dominance order or a partic-ipation hierarchy often emerges (Rosa and Mazur, 1979). A concept largely studied in social psychol-ogy, dominance is one of the basic mechanisms of social interaction and has fundamental implica-tions for communication both among individuals and within organizaimplica-tions (Burgoon and Dunbar, 2006). While dominant behavior could bring benefits to the person displaying it in certain contexts, in others it could negatively affect the social dynamics of a group, impacting its cohesiveness and ef-fectiveness, and eroding social relationships. Furthermore, displayingdominant cueslike loud speech or pointing, as opposed totask cueslike verbal fluency or well-modulated voice tone, is an ineffective strategy to gain influence (Ridgeway, 1987).
The automatic modeling of dominance patterns in groups is a key problem in social interaction analysis from sensor data (Pentland, 2005; Gatica-Perez, 2006), which spans research in audio and visual processing, information fusion, human-computer interaction, and ubiquitous computing. The analysis of face-to-face multiparty conversations to extract patterns of dominance (Basuet al., 2001; Rienks and Heylen, 2005) is challenging, given the complex nature of real communication, and the difficulty to model, accurately and efficiently, the behavior of multiple interacting individuals.
matic dominance estimators from audio-visual media could be part of relevant human-centered ap-plications including self-assessment and training (Pentland, 2005; Pianesiet al., 2008b), and systems to support group collaboration (DiMiccoet al., 2006; Nijholtet al., 2006; Kulyket al., 2006; DiMicco and Bender, 2007; Kimet al., 2008).
A solid body of work in psychology has documented the multimodal nature of dominance (Dun-bar and Burgoon, 2005a), and in particular the role that nonverbal communicative cues (not involving the spoken words) play in the expression and perception of dominant behavior. Although speech is the main modality in conversations (Tusing and Dillard, 2000; Schmid Mast, 2002), substantial infor-mation is conveyed in the visual modality through body movement, postures, gaze, and gestures. It is known that, in terms ofvocalicandkinesiccues, dominant individuals behave more actively (i.e., talk and move more, more often and with larger ranges, and receive more attention) than non-dominant people (Dunbar and Burgoon, 2005a; Burgoon and Dunbar, 2006). Some of these activity cues can be automatically extracted from data, and initial work (Basuet al., 2001; Rienkset al., 2006; Rienks and Heylen, 2005) mainly investigated perceptual modalities in isolation (where cues were often extracted manually), or proposed dominance recognition approaches that were applied to relatively constrained interaction scenarios or that were limited in their validation.
This chapter presents a systematic study on fully automated modeling of perceived dominance in small group meetings from nonverbal cues. Focusing on the AMI corpus, a data set of face-to-face interactions recorded with multiple cameras and microphones, our work contains several contribu-tions. First, we investigate a number of robustly extracted and efficient activity cues in both audio and visual domain for the characterization of dominant behavior. Our cues include a novel set of visual cues extracted in compressed-domain video. The visual attention cues are extracted by tracking the head and pose jointly. We consider only, visual activity-only, visual attention-only and audio-visual cases to understand the relative power of each of the modalities and the benefits of using them jointly. Second, we study unsupervised and supervised approaches for dominance modeling, which differ in complexity and needs for training data. Third, through the analysis of the variability of human judgment of perceived dominance in our corpus, we define and study a set of dominance estimation tasks (most-dominant person, least-dominant person) that allow us to objectively quantify the dif-ficulty of each of them, as well as the variation in performance as human performance itself varies. Our results highlight a number of relevant issues, including the robustness of basic audio features, the
2.1. RELATED WORK 13 power of some visual cues, and the overall advantages of relatively simple approaches. To our knowl-edge, this work constitutes the most detailed study on automatic modeling of dominance in small group meetings from audio and visual cues to date. The work in this chapter is an expanded version of this publication (Jayagopiet al., 2009b).
The chapter is organized as follows. Section 2.1 reviews the literature on dominance in social psychology and on computational approaches related to our work. Section 2.2 presents the compo-nents of our work. Section 2.3 describes the data, its annotation process, and the definition of the dominance classification tasks. Section 2.4 presents the audio and visual cues. Section 2.5 presents our models for estimating dominance and describes the experimental protocol. Sections 2.6 and 2.7 present and discuss the results for the studied dominance classification tasks. Section 2.8 summarizes the chapter and provides some concluding remarks.
2.1
Related work
In the next subsections, we summarize the most relevant work in social psychology and social computing related to our own.
2.1.1
Dominance in social psychology
Dominance is a fundamental construct in social interaction (Burgoon and Dunbar, 2006). In social psychology, dominance is often seen in two ways, “as a personality characteristic (trait) and to indi-cate a person’s hierarchical position within a group (state)” (Schmid Mast, 2002) (pp. 421). Although dominance and closely related terms like power, status, and influence have multiple definitions and are often used as equivalent, many social psychologists advocate for a clearer distinction, power being ”the capacity to produce intended effects, and in particular, the ability to influence the behavior of another person” (Dunbar and Burgoon, 2005b) (pp. 208), and dominance being a set of “expressive, relationally based communicative acts by which power is exerted and influence achieved”, “one be-havioral manifestation of the relational construct of power”, and “necessarily manifest” (Dunbar and Burgoon, 2005b) (pp. 208-209).
The study of dominance has spanned several decades of work in psychology and is too large to summarize here [for recent accounts, see (Burgoon and Dunbar, 2006; Dunbar and Burgoon, 2005b)].
However, two main threads of work are key to the development of automated dominance modeling approaches, as both justification and inspiration: the existence of specific social cues used by people to express dominance in conversations, and the ability to correctly infer or perceive dominance by observers of an interaction using such cues.
The first thread of work is rich, and has been widely studied. Both verbal and nonverbal cues are in-dicators of dominance. Being the primary interest of our work, we focus on nonverbal cues, which are known to be effective in predicting behavioral outcomes. Directly related to our work, nonverbal cue categories of interest include vocalic and kinesic (Dunbar and Burgoon, 2005b). Vocalic cues involve amount of speaking time (or length) (Schmid Mast, 2002), speech loudness (or energy), speech tempo, pitch, vocal control, (Dunbar and Burgoon, 2005b), and interruptions (Brody and Smith-Lovin, 1989). Among these,speaking activityas measured by speaking length has been shown to be a particularly robust cue to predict dominance (Schmid Mast, 2002). Kinesic cues include body movement, posture, and elevation, and gestures, facial expressions, and eye gaze (Dunbar and Burgoon, 2005b). In par-ticular, it has been found that, regarding body movement, dominant people are normally more active than non-dominant people (the former move more and with a wider range of motion, the latter tend to be more limited in their amount and range of body activity), and that gestures that accompany speech are positively correlated with dominance (Burgoon and Dunbar, 2006; Dunbar and Burgoon, 2005a). This suggests thatvisual activity(and in particular, activity that correlates with speaking activity) are strong cues for predicting dominance. Also, gaze patterns have been observed to be reliable indicators of visual dominance (Hallet al., 2005). Early research by Efran showed that high-status persons receive more visual attention than low-status people (Efran, 1968). Cook et al. showed that people who very rarely look at others in conversations are perceived as weak (Cook and Smith, 1975). The percentage of eye contact, gaze frequency, gaze duration, ‘looking-while-speaking’, and ‘looking-while-listening’ have been shown to be correlated with social verticality (Hallet al., 2005), emphasizing the impor-tance ofvisual attentioncues. Exline et al. showed that high-power people exhibit a relatively high ratio of looking-while-speaking to looking-while-listening periods (Exlineet al., 1975; Dovidio and Ellyson, 1982).
The second thread of work is also crucial: the fact that people can correctly decode dominance (both as participants of an interaction and as external observers) provides support for the expectation of obtaining reliable human annotations and the promise of designing methods for automatic
analy-2.1. RELATED WORK 15 sis. The literature here is also rich. Almost three decades ago, Dovidio et al. showed that people can systematically decode patterns of visual dominance displayed by others (Dovidio and Ellyson, 1982). It has been also found that participants and external observers present differences in their perception of dominance (Dunbar and Burgoon, 2005b). For automatic approaches, this is important for manual data annotation (first-party vs. third-party) in order to generate ground-truth for training purposes. As Dunbar and Burgoon state: “Perhaps coders’ perception of dominance correspond more closely with objective measures of verbal and nonverbal dominance than those of participants themselves... However, the coders’ observations are limited to the behaviors in a particular interaction, whereas par-ticipants are privy to the ongoing interaction that is part of a continuing relationship. Thus, as with many other findings, whose perception you trust depends on what question is being asked.” (Dunbar and Burgoon, 2005b) (pp. 228). We believe the third-party option to be an adequate approach for the questions addressed in this chapter.
2.1.2
Dominance in social computing
Previous research on automatic dominance modeling can be categorized based on the specific group interaction setting, the addressed task, and the technical implementation, including both cues and dominance models. All of the works discussed below studied small groups recorded with multiple cameras and microphones.
For a debating game setting, Basu et al. (Basuet al., 2001) used the influence model (IM) - an unsupervised DBN that models a group as a set of Markov chains, each of which influences the others’ state transitions - to determine the degree of influence a person has on the others on a pair-wise basis. Both vocalic cues (manually labeled speaker turns and automatically extracted speaker energy and voicing information) and kinesic cues (region-based motion energy derived from pre-defined regions and skin-color blobs) were used. While promising results were presented, this work neither studied the impact of individual features nor evaluated the performance of the resulting system in a systematic way.
On a small set of meetings from the M4 (MultiModal Meeting Manager) and AMI (Augmented Multi-party Interaction) corpora, Rienks et al. (Rienks and Heylen, 2005) studied a supervised ap-proach based on Support Vector Machines (SVMs). The addressed task was three-way classification of the participants’ dominance level (high, normal, low). Audio-only features derived from manually
annotated data were used, and included a combination of nonverbal (e.g. speaker turns, speaking length, floor grabs) and verbal cues (e.g. number of spoken words). In this work, no study of the annotation quality was conducted, and so a clear understanding of the sources of complexity of the data was missing. Furthermore, labeling the data with a predefined number of dominance levels is, to some extent, arbitrary, and a study of the effect of these choices was not conducted. Rienks et al. (Rienkset al., 2006) later extended this approach to a subset of the AMI corpus where the dominance judgments came from the participants themselves.
In a third research line, Otsuka et al. proposed, following the ideas of (Basuet al., 2001), to quantify pair-wise influence from automatically estimated vocalic and kinesic mid-level cues (speaking-turn and gaze patterns, respectively), computed in turn with a complex DBN that integrates low-level fea-tures (Otsukaet al., 2006). While the proposed influence model is simple, and the proposed features are conceptually appealing, neither an objective evaluation nor a comparison to previous approaches were conducted in this work.
Our work substantially extends previous research in several ways. First, unlike (Basuet al., 2001; Otsukaet al., 2006) , we conduct a systematic study of both vocalic and kinesic features and domi-nance models on a common data set, and present a detailed objective evaluation of the performance of single- and multi-modal cues, and of unsupervised and supervised learning approaches. Second, the specific research tasks we study are distinct, and so complementary, to the ones studied in all pre-vious work. Third, unlike (Rienkset al., 2006; Rienks and Heylen, 2005) we introduce a set of novel visual activity cues, distinct from those in (Basuet al., 2001; Otsukaet al., 2006) and computed in the compressed domain with low computational cost. Fourth, unlike (Otsukaet al., 2006), we systemati-cally evaluate several visual attention cues for estimating dominance. Fifth, unlike (Basuet al., 2001; Rienkset al., 2006; Rienks and Heylen, 2005) , we rely on fully automatically extracted features, and in this sense the presented work is closer to ‘what is truly achievable using machines’. Finally, unlike all previous work, we analyze the annotation of perceived dominance by multiple human judges and are thus able to analyze the implications that the variation of human perception has on the performance of our automatic approaches.
2.2. OUR APPROACH 17
2.2
Our approach
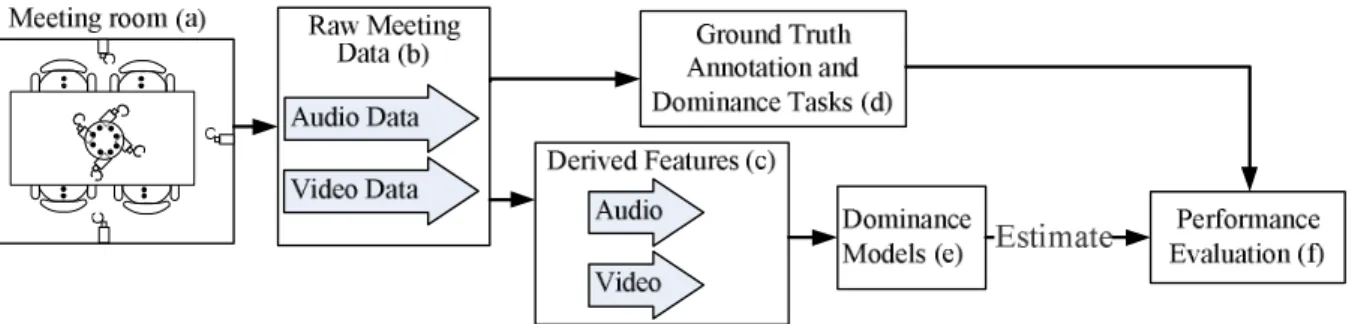
Figure 2.1 shows a block diagram of the structure of our work:
– (a,b): Section 2.3.1. We use meeting data from the publicly available AMI corpus (Carletta et al., 2006), where multiple microphones and video cameras have been used to capture audio and video.
– (d): Sections 2.3.2, 2.3.3. We generated a detailed ground truth annotation of the perceived dominance for each individual in the meetings using multiple human judgments. Through a study of the annotator levels of agreement, we define two sub-tasks to observe the effect on the performance of the dominance models when increased variability in the perception of domi-nance was present.
– (c): Section 2.4.From the raw audio and video data, we derive features which are used to charac-terize certain nonverbal behaviors. Both the audio and video features have been treated similarly for comparison of the two modalities.
– (e-f ): Section 2.5. Two models were considered for estimating dominance; one unsupervised and one supervised. The supervised approach was used for single as well as multi-modal fusion, which allowed us to study the contributions of the audio and video cues to the dominance es-timation performance. We evaluated the performance of the models using both hard and soft evaluation criteria, where the latter accounted for the amount of variability in the annotations.
Figure 2.1.Flow diagram of our approach.
In summary, our work studies both the underlying variability inperceived dominance by external observers, and systematically analyzes the objective performance of single and multi-modal domi-nance estimation models for a number of classification tasks.
2.3
Meeting data and dominance tasks
Various corpora have been collected with the explicit goal of studying group interaction (Gatica-Perez, 2009). We chose meetings from the AMI corpus (Carletta et al., 2006) for our study. The AMI corpus is publicly available with group interactions that were task-oriented and not scripted. They were recorded in ‘smart-rooms’ equipped with audio-visual sensors. These meeting recordings suited our dominance study with external observers. We describe the AMI dataset in detail and the annota-tions thereafter.
2.3.1
Meeting data
The AMI meetings were carried out in the meeting room shown in Figure 2.2. The room contains a table, a slide screen, and a white board. A circular microphone array containing eight evenly dis-tributed microphones is set in the middle of the table, and one with four microphones is set at the ceiling. Participants were also asked to wear both headset and lapel omni-directional microphones, which were attached via long cables to enable freedom of movement around the room. Three cameras were mounted on the sides and back of the room to capture mid-range and global views, respectively, while 4 additional cameras mounted on the table captured individual visual activity only, as shown in Figure 2.3.
2.3. MEETING DATA AND DOMINANCE TASKS 19
Figure 2.3.Examples of the seven camera views available in the AMI meeting room. The top row shows the right, centre and left cameras, while the bottom row shows the view from each of the close up cameras.
From the AMI data, a subset of five teams of participants were selected for our meeting data. Each team consisted of 4 participants, who were given the task of designing a remote control over a series of meeting sessions. The level of previous acquaintance among team members varied from being completely unacquainted to knowing each other well. Each participant was assigned distinct roles: ‘Project Manager’, ‘User Interface specialist’, ‘Marketing Expert’, and ‘Industrial Designer’. During each session, the team was required to carry out certain tasks, such as a presentation on particular subjects related to the task, or a discussion about a particular aspect of the task. To encourage natural behavior, the meetings were not scripted and the teams met over several sessions so that they achieved the common goal.
2.3.2
Annotating the data
From the AMI data, 11 meetingsessions varying from 15 to 35 minutes were divided into five-minute segments for ground truth annotation so that a total of 59 meeting segments were used. The segments were chosen to be 5 minutes long, rather than the original full meetings, since this provided more data points for training and testing. There is also evidence that people often need a relatively small amount of time to make accurate judgments about the behavior of others (Ambadyet al., 2000). Our choice is therefore supported by this empirical evidence.
A total of 21 annotators were used and were split into groups of 3 so that each group always an-notated the same segments. The annotators were not professional coders or experts in psychology.
They were shown a video with views from the side and rear cameras, which are shown in the top row of Figure 2.3 and listened to the audio also. As the annotators understood the spoken language which is English in the AMI scenario, they had access to the verbal channel as well. For a given meeting, each annotator viewed only one five-minute segment (in other words, an annotator never judged more than one segment of the same session). The annotators were requested to judge a person’s dominance based only on the evidence within each meeting. Importantly, annotators were given neither a prior definition of dominance, nor were told what specific verbal or nonverbal cues to look for in order to make their judgments. The annotators were compensated monetarily for their effort. As hiring anno-tators was hard and costly, we chose to annotate every meeting using 3 annoanno-tators and not more.
For each 5 minute meeting segment (simply calledmeeting from here on for convenience), an-notators were asked to rank the participants, from 1 (highest) to 4 (lowest), according to their level of perceived dominance. As well as an absolute ranking, annotators were also asked to rank people proportionately by distributing a total of 10 units among the participants, where more units signified higher dominance. To identify segments where the rankings were difficult to allocate, annotators were asked about their confidence in their absolute and proportionate rankings on a seven-point scale. Annotators were also requested to ascertain specific characteristics of each participant such as their degree of activity, timidness, and talkativeness, also on a seven-point scale (Dunbar and Burgoon, 2005b). Finally, they were requested, on completion of the annotations, to provide a free form written description of the personal criteria they used to decode dominance.
2.3.3
Analysis of the annotations
From the human annotations, we wished to discover whether there was significant inter-annotator agreement across all meetings. Initial analysis of the meeting data indicated that 12 out of 59 meetings showed full agreement for all 4 absolute rankings of each meeting. This was clearly not enough for an analysis of dominant behavior for our experiments. Therefore we decided to relax the agreement con-dition by considering only the task of estimating themostdominant or theleastdominant person. A significant number of the meeting segments (34) showed full agreement of the most dominant person, i.e. all three annotators agreed on the most dominant participant. Furthermore, the corresponding self-reported average confidence for the annotation for these meetings was 1.7 (where 1 represents the highest confidence and 7 represents the lowest). This subset represents almost 3 hours of meeting