Louisiana State University
LSU Digital Commons
LSU Doctoral Dissertations Graduate School
6-27-2019
Exploring the Link Between Students’ Usage of
ALEKS and Their Performance on State
Benchmark Assessments in Mathematics
Verna Marie RichardLouisiana State University and Agricultural and Mechanical College, [email protected]
Follow this and additional works at:https://digitalcommons.lsu.edu/gradschool_dissertations Part of theCurriculum and Instruction Commons,Educational Assessment, Evaluation, and Research Commons,Educational Methods Commons,Educational Technology Commons,Junior High, Intermediate, Middle School Education and Teaching Commons, and theScience and Mathematics Education Commons
This Dissertation is brought to you for free and open access by the Graduate School at LSU Digital Commons. It has been accepted for inclusion in LSU Doctoral Dissertations by an authorized graduate school editor of LSU Digital Commons. For more information, please [email protected]. Recommended Citation
Richard, Verna Marie, "Exploring the Link Between Students’ Usage of ALEKS and Their Performance on State Benchmark Assessments in Mathematics" (2019).LSU Doctoral Dissertations. 4999.
EXPLORING THE LINK BETWEEN STUDENTS’ USAGE OF ALEKS AND THEIR PERFORMANCE ON STATE BENCHMARK ASSESSMENTS IN MATHEMATICS
A Dissertation
Submitted to the Graduate Faculty of the Louisiana State University and Agricultural and Mechanical College
in partial fulfillment of the requirements for the degree of
Doctor of Philosophy in
The School of Education
by
Verna Marie Richard
B.S., Louisiana State University, 2007 M.N.S., Louisiana State University, 2010
ii
© Copyright 2019 Verna Marie Richard
iii
ACKNOWLEDGEMENTS
I am eternally grateful and indebted to God, for without Him, none of this would have been possible.
It seems not too long, and yet I know, it was quite some time ago, that I first embarked upon this challenging, adventurous, scholastic journey, which has brought me to the pinnacle of my academic attainment. I am enthusiastic and excited for this achievement, not only for myself, but for those who will share in the skills, benefits, and opportunities of my sharing as I go forth. I am also very humbled by this accomplishment and will always be utmost grateful of everyone who has supported me along the way.
I would like to express my deepest heartfelt gratitude to my professor, academic advisor, and mentor, Dr. David Kirshner, who has given me invaluable guidance and resources that motivated me to press forward toward reaching this milestone. Dr. Kirshner, thank you for always being available and for the long hours you have spent in assisting me with my research project. I cannot thank you enough for your support in securing the data I needed for this study.
I would also like to extend my deepest appreciation to Dr. Eugene Kennedy for his counsel, resources, support in data gathering, and statistical expertise. Your counsel, resources, and statistical expertise was a tremendous help as I navigated through very challenging situations. As frustrating as these challenges were, I realize in hindsight that they were purposed as stepping stones to broadened and solidified my statistical knowledge and their practical applications.
Special thanks to Dr. Jennifer Qian for providing me a listening ear, resources, encouragement, feedback, and support. To my committee members, professors Sofranko Thomas and Min-Joung Kim, thank you so much for your time, encouragement and feedback during the initial phases of my study. Your presence and support is greatly appreciated.
iv
I would also like to extend my deepest gratitude to my parents, Rev. Joseph and Barbara Richard, and my brother, Jason Richard, for being my cheering squad. Thank you for your continuous, uplifting encouragement, which motivated me to be relentless in pressing toward the mark.
To my fellow colleagues, David Eller, Emily Flanders, Laurie Richard, and Ashley Segalla, thank you so much for your friendship, feedback, and encouragement. Indeed, sharing our struggles have made this journey a little easier. I am rooting for you. Keep up the good work.
v
TABLE OF CONTENTS
ACKNOWLEDGEMENTS………iii LIST OF TABLES.……….……….………..….…...vii LIST OF FIGURES………..…….………...xii ABSTRACT.……….……...xivCHAPTER ONE. STATEMENT OF THE PROBLEM……….…….……1
Introduction………...1
Purpose of the Study………..……...4
Rationale for the Study……….………6
Research Questions ………..7
Theoretical Foundations……….………...7
Summary……….……...9
Definition of Terms……….………...…...9
CHAPTER TWO. REVIEW OF THE LITERATURE………..………12
Introduction………..………...12
Middle School Mathematics Performance in the U.S. since the 1990s………….………..13
Instructional Quality in U.S. Middle Schools………...…..18
The Link between Curriculum Implementation and Students’ Mathematics Achievement………..20
Mathematics Best Practices for Instruction and Technology Implementation………24
The Motivational Premise behind ITS Integration in Education……….25
Historical Review of ITS Progression as a Learning Tool………...27
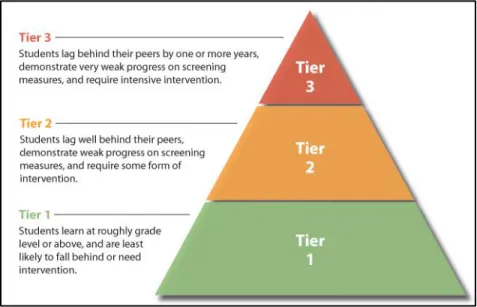
Present-day Benefits and Challenges of ITS in K – 12 Education………..35
The ALEKS Program….………....38
How ALEKS Nurtures Learning………39
ALEKS Curricula Alignment with CCSS………..49
Intended Use of the ALEKS Program…...………..51
The Effects of ALEKS on Student Learning………..55
CHAPTER THREE. METHODOLOGY……….……….……….58
Introduction………...….58 Research Design……….…..……….……….………...….58 Sample Population…………..…….…..……….……….…...………...…60 Research Ethics……….…..……….……….………...…..65 Procedures………..…….…..……….……….………...…66 Instruments……….……….………...………66
Data Analysis Methods……….…...……….………...…..68
Data and Data Analysis……….……….……...………...…..70
CHAPTER FOUR. RESULTS AND FINDINGS……….79
vi
Research Study Participants……….……..79
ALEKS Curriculum Used within DISTRICT………81
District-Level Analysis of ALEKS Usage……….81
Measures of Association Between ALEKS Usage Variables and 2018 LEAP Performance……….. 88
Research Question One………...………...……..…..99
Research Question Two………....107
Research Question Three……….….114
The Effect of FSSP and EOYSP on 2018 LEAP Performance………119
Research Question Four……….…....……...……….……..132
Research Question Five……….………..……….143
Comparing ALEKS Usage between HSA Teachers and LSA Teachers………..155
CHAPTER FIVE. DISCUSSION AND CONCLUSIONS………..160
Introduction……….………...160
Quantitative Results and Conclusions………..161
Qualitative Results and Conclusions………...………….170
The Nature of the Learning that takes Place on ALEKS……….185
Implications for ALEKS Usage within DISTRICT……….………….186
Recommendations for Future Research………..…….……….189
Limitations of the Study…….………..………190
Conclusion………...…191
REFERENCES……….………...…193
APPENDIX A. IRB APPROVALS AND MODIFICATIONS………..……..…………197
APPENDIX B. PARTICIPANT INFORMED CONSENT………..………..………….200
APPENDIX C. DISTRICT-LEVEL OF ALEKS USAGE BY DEMOGRAPHICS..…………..202
APPENDIX D. ASSUMPTIONS TESTED FOR HMR MODELS………..……..208
APPENDIX E. ASSUMPTIONS TESTED FOR INDEPENDENT SAMPLES T-TEST……...210
APPENDIX F. ASSUMPTIONS TESTED FOR PAIRED SAMPLES T-TEST………211
APPENDIX G. ASSUMPTIONS TESTED FOR ANCOVA ANALYSIS……….212
APPENDIX H. ALEKS SURVEY………...214
APPENDIX I. ASSOCIATION BETWEEN THE VARIABLE FSSP AND LEAP PERFORMANCE ………...218
APPENDIX J. ASSOCIATION BETWEEN THE VARIABLE EOYSP AND LEAP PERFORMANCE……….………...220
vii
LIST OF TABLES
Table 3.1. Letter Grade Distribution of DISTRICT’s Public Middle Schools………..61
Table 4.1. 2017 – 2018 ALEKS Course Enrolment within DISTRICT………81
Table 4.2. 2017 – 2018 ALEKS Course Enrolment within DISTRICT………82
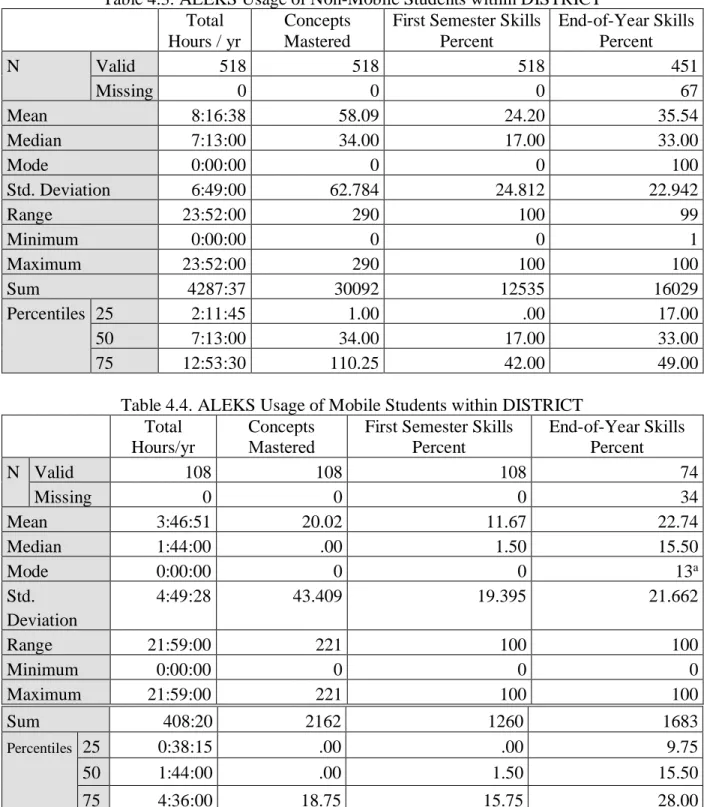
Table 4.3. ALEKS Usage of Non-Mobile Students within DISTRICT………87
Table 4.4. ALEKS Usage of Mobile Students within DISTRICT………87
Table 4.5. Descriptive Statistics for Model A………..…90
Table 4.6. HLM for Model A……….…..…91
Table 4.7. Model B Descriptive Statistics………..……..…92
Table 4.8. HLM for Model B………..………..…92
Table 4.9. Model C Descriptive Statistics for Non-Mobile Students……….……….……...…..93
Table 4.10. Model C Descriptive Statistics for Mobile Students………….………93
Table 4.11. Mean Difference of 2018 LEAP Performance between Mobile and Non-Mobile….94 Table 4.12. HLM for Non-Mobile Students……..……….……….……..94
Table 4.13. HLM for Mobile Students….…...……….……….………95
Table 4.14. Descriptive Statistics for Model D……….96
Table 4.15. HLM for Model D………..………96
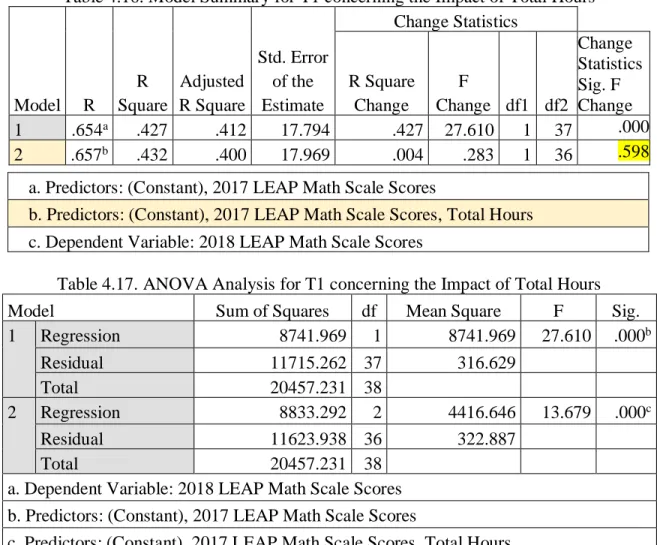
Table 4.16. Model Summary for T1 concerning the Impact of Total Hours………...100
Table 4.17. ANOVA Analysis for T1 concerning the Impact of Total Hours……….100
Table 4.18. Total Hours Spent on ALEK for T1………..…...101
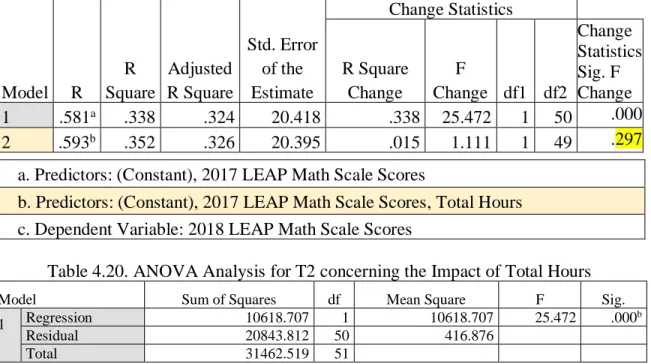
Table 4.19. Model Summary for T2 concerning the Impact of Total Hours………...101
Table 4.20. ANOVA Analysis for T2 concerning the Impact of Total Hours………101
viii
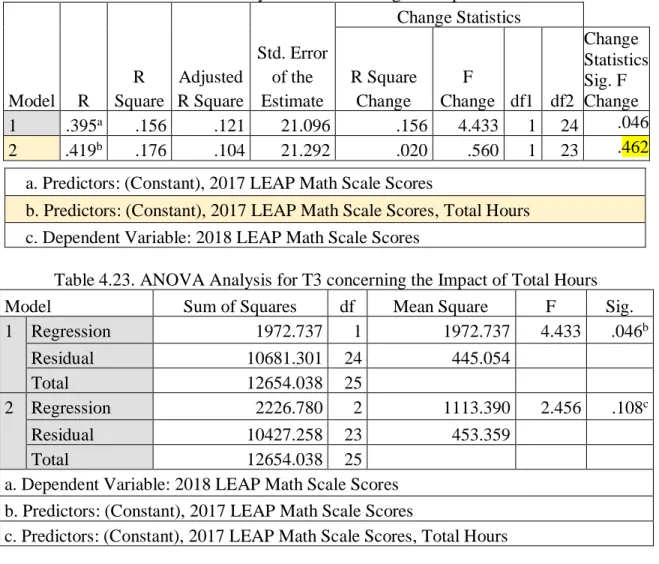
Table 4.22. Model Summary for T3 concerning the Impact of Total Hours………...103
Table 4.23. ANOVA Analysis for T3 concerning the Impact of Total Hours……….103
Table 4.24. Total Hours Spent on ALEK for T3……….………...…………...……....…..103
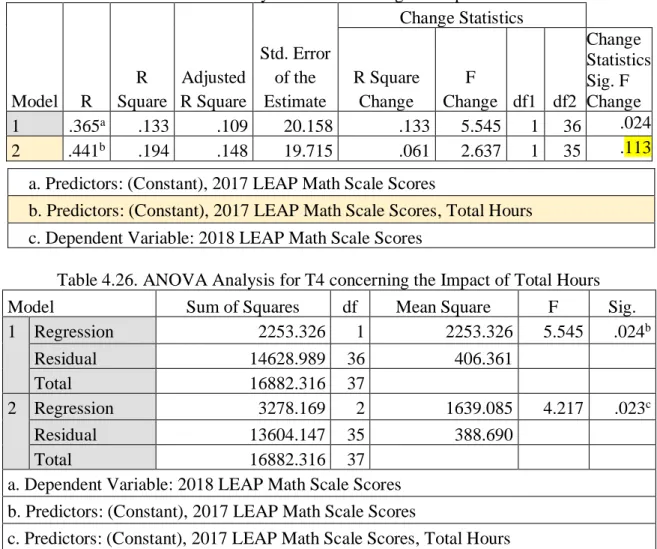
Table 4.25. Model Summary for T4 concerning the Impact of Total Hours………...…....104
Table 4.26. ANOVA Analysis for T4 concerning the Impact of Total Hours………...…..104
Table 4.27. Total Hours Spent on ALEK for T4……….…...……...……...………...……105
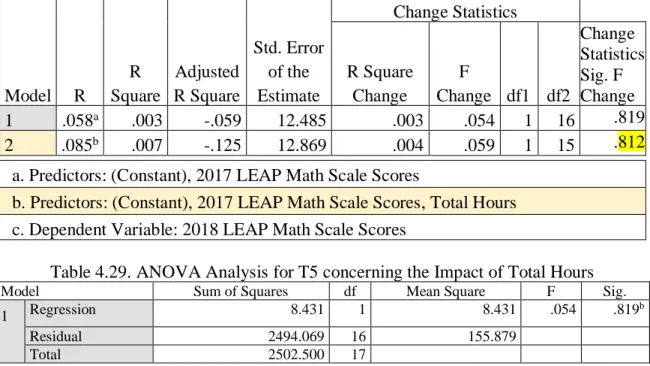
Table 4.28. Model Summary for T5 concerning the Impact of Total Hours………...……105
Table 4.29. ANOVA Analysis for T5 concerning the Impact of Total Hours…...……....……..105
Table 4.30. Total Hours Spent on ALEK for T5…...……....……..…...……....……….106
Table 4.31. Model Summary for T1 concerning the Impact of Concepts Mastered………...…108
Table 4.32. ANOVA Analysis for T1 concerning the Impact of Concepts Mastered….………108
Table 4.33. Concepts Mastered on ALEK for T1………108
Table 4.34. Model Summary for T2 concerning the Impact of Concepts Mastered……….…..109
Table 4.35. ANOVA Analysis for T2 concerning the Impact of Concepts Mastered………...109
Table 4.36. Concepts Mastered on ALEK for T2………110
Table 4.37. Model Summary for T3 concerning the Impact of Concepts Mastered…………...110
Table 4.38. ANOVA Analysis for T3 concerning the Impact of Concepts Mastered………….111
Table 4.39. Concepts Mastered on ALEK for T3………111
Table 4.40. Model Summary for T4 concerning the Impact of Concepts Mastered…………...112
Table 4.41. ANOVA Analysis for T4 concerning the Impact of Concepts Mastered………….112
Table 4.42. Concepts Mastered on ALEK for T4………....112
Table 4.43. Model Summary for T5 concerning the Impact of Concepts Mastered………..….113
ix
Table 4.45. Concepts Mastered on ALEK for T5………....114
Table 4.46. Model Summary: The Impact of Total Hours and Concepts Mastered for T1……115
Table 4.47. ANOVA Model: The Impact of Total Hours and Concepts Mastered for T1……..115
Table 4.48. Model Summary: The Impact of Total Hours and Concepts Mastered for T2……116
Table 4.49. ANOVA Model: The Impact of Total Hours and Concepts Mastered for T2……..116
Table 4.50. Model Summary: The Impact of Total Hours and Concepts Mastered for T3…….117
Table 4.51. ANOVA Analysis: The Impact of Total Hours and Concepts Mastered for T3…..117
Table 4.52. Model Summary: The Impact of Total Hours and Concepts Mastered for T4…….118
Table 4.53. ANOVA Analysis: The Impact of Total Hours and Concepts Mastered for T4…..118
Table 4.54. Model Summary: The Impact of Total Hours and Concepts Mastered for T5…….118
Table 4.55. ANOVA Analysis: The Impact of Total Hours and Concepts Mastered for T5…..119
Table 4.56. The Association between 2017 LEAP Performance and 2018 LEAP Performance………...…..120
Table 4.57. EMMs of 2018 LEAP Math Scale Scores for T1, T2, T3, T4, and, T5………...………..121
Table 4.58. Pairwise Comparisons between T1 and the Remaining Teachers……….……..121
Table 4.59. Model Summary for T1 concerning First Semester Skills Percent………..122
Table 4.60. ANOVA Analysis for T1 concerning First Semester Skills Percent………122
Table 4.61. Model Summary for T3 concerning First Semester Skills Percent………..123
Table 4.62. ANOVA Analysis for T3 concerning First Semester Skills Percent………123
Table 4.63. Model Summary for T1 concerning End-of-Year Skills Percent……….124
Table 4.64. End-of-Year Percentage of Skills Mastered for T1………..124
Table 4.65. Model Summary for T3 concerning End-of-Year Skills Percent……….…125
x
Table 4.67. Model Summary for T2 concerning First Semester Skills Percent………..…126
Table 4.68. ANOVA Analysis for T2 concerning First Semester Skills Percent………126
Table 4.69. Model Summary for T4 concerning First Semester Skills Percent………..127
Table 4.70. ANOVA Analysis for T4 concerning First Semester Skills Percent………127
Table 4.71. Model Summary for T4 concerning First Semester Skills Percent……….……….128
Table 4.72. Model Summary for T2 concerning End-of-Year Skills Percent………….………128
Table 4.73. ANOVA Results for T2 concerning End-of-Year Skills Percent………….………128
Table 4.74. End-of-Year Percentage of Skills Mastered for T2……….……….129
Table 4.75. Model Summary for T4 concerning End-of-Year Skills Percent………….………129
Table 4.76. ANOVA Results for T4 concerning End-of-Year Skills Percent………….………130
Table 4.77. End-of-Year Percentage of Skills Mastered for T4……….……….130
Table 4.78. Model Summary for T5 concerning End-of-Year Skills Percent……….…131
Table 4.79. End-of-Year Percentage of Skills Mastered for T5……….…….131
Table 4.80. 2017 LEAP Mathematics Scale Score Ranges per Achievement Level…….……..145
Table 4.81. 2017 LEAP Performance Averages with Corresponding ALEKS Tier Levels……146
Table 4.82. Paired Samples T-Test Results for T1………..147
Table 4.83. Paired Samples T-Test Results for T2………..147
Table 4.84. Paired Samples T-Test Results for T3………..147
Table 4.85. Paired Samples T-Test Results for T4………..147
Table 4.86. Paired Samples T-Test Results for T5………..148
Table 4.87. 2017 and 2018 LEAP Performance per Achievement Level………149
Table C.1. District-Level ALEKS Usage of African American Students….………..202
xi
Table C.3. District-Level ALEKS Usage of Hispanic Students………...203
Table C.4. District-Level ALEKS Usage of White Students………..203
Table C.5. 2017 – 2018 District-Level of ALEKS Usage by Male Students………..204
Table C.6. 2017 – 2018 District-Level of ALEKS Usage by Female Students….……….204
Table C.7. 2017 – 2018 District-Level of ALEKS Usage by Non-LEP Students………...205
Table C.8. 2017 – 2018 District-Level of ALEKS Usage by LEP Students….………..205
Table C.9. 2017 – 2018 District-Level of ALEKS Usage by Non-SPED Students…………....206
Table C.10. 2017 – 2018 District-Level of ALEKS Usage by SPED Students………..206
Table C.11. 2017 – 2018 District-Level of ALEKS Usage by Non-Repeaters………...207
Table C.12. 2017 – 2018 District-Level of ALEKS Usage by Repeaters….………..207
Table D.1. Test for Multicollinearity……….…..208
Table D.2. Testing Standardized Residuals for Outliers………..………….…..208
Table G.1. Testing for Homogeneity of Regression Slopes……….….…..213
Table I.1. Association Between the Variable FSSP and LEAP Performance for T1…….…….218
Table I.2. Association Between the Variable FSSP and LEAP Performance for T2 ……...….218
Table I.3. Association Between the Variable FSSP and LEAP Performance for T3…….…….218
Table I.4. Association Between the Variable FSSP and LEAP Performance for T4….……….219
Table I.5. Association Between the Variable FSSP and LEAP Performance for T5….……….219
Table J.1. Association Between the Variable EOYSP and LEAP Performance for T1………..220
Table J.2. Association Between the Variable EOYSP and LEAP Performance for T2………..220
Table J.3. Association Between the Variable EOYSP and LEAP Performance for T3………..220
Table J.4. Association Between the Variable EOYSP and LEAP Performance for T4……..…221
xii
LIST OF FIGURES
Figure 2.1. Snapshot of ALEKS’ Problem Guidance Interface……….41
Figure 2.2. Snapshot of ALEKS’ Pie Chart……….………..44
Figure 2.3. Snapshot of ALEKS’ Timeline……….………..45
Figure 2.4. Snapshot of ALEKS’ Time and Topic Report……….……...45
Figure 2.5. Snapshot of ALEKS’ Progress History……….……...….……..45
Figure 2.6. Snapshot of ALEKS’ Personalized Learning Paths……….…...46
Figure 2.7. Snapshot of ALEKS’ Student Mastery Pie Chart……….……...47
Figure 2.8. Snapshot of a ALEKS Problem-type……….……..….………...48
Figure 2.9. Characteristics of Tier 1, Tier 2, and Tier 3 Students….……..….……..….…….…50
Figure 4.1. Race Distribution of Eighth-Grade Students Who Used ALEKS….……..….……..79
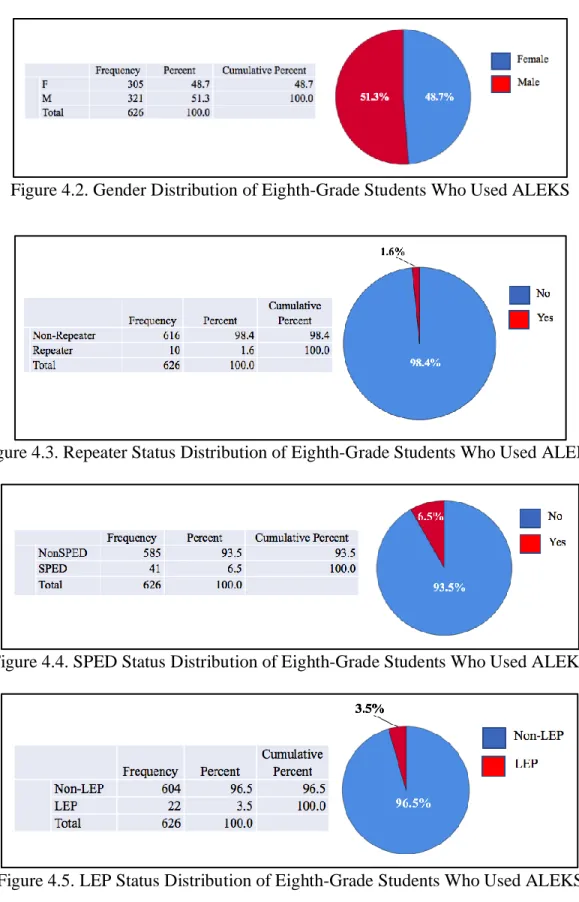
Figure 4.2. Gender Distribution of Eighth-Grade Students Who Used ALEKS…………..……80
Figure 4.3. Repeater Status Distribution of Eighth-Grade Students Who Used ALEKS…….…80
Figure 4.4. SPED Status Distribution of Eighth-Grade Students Who Used ALEKS…………..80
Figure 4.5. LEP Status Distribution of Eighth-Grade Students Who Used ALEKS……….80
Figure 4.6. 2017 – 2018 Demographic Distribution of T1 Students Who Used ALEKS………144
Figure 4.7. 2017 – 2018 Demographic Distribution of T2 Students Who Used ALEKS………144
Figure 4.8. 2017 – 2018 Demographic Distribution of T3 Students Who Used ALEKS………145
Figure 4.9. 2017 – 2018 Demographic Distribution of T4 Students Who Used ALEKS………145
Figure 4.10. 2017 – 2018 Demographic Distribution of T5 Students Who Used ALEKS……..145
Figure D.1. Tests for Linearity………208
Figure D.2. Homoscedasticity of Residuals………..……..209
xiii
Figure E.1. Testing for Outliers………...210
Figure E.2. Testing Standardized Residual Distribution for Normality………..210
Figure F.1. Testing for Outliers…….………..………211
Figure F.2. Testing for Normality…….………..……….……211
Figure G.1. Linear Associations between 2017 LEAP Scores and 2018 LEAP Scores for Teachers T1 – T5………..……….………..…....212
Figure G.2. Linear Associations between Days Absent and 2018 LEAP Scores for Teachers T1 – T5……….……….………….………..…....212
Figure G.3. Testing for Homogeneity of Variances………….………...212
xiv
ABSTRACT
The purpose of this mixed methods study was to investigate relationships between students’ ALEKS usage, teachers’ implementation of ALEKS, and student performance on the 2017 – 2018 LEAP 2025 mathematics assessment. The quantitative portion of the study involved district-level analyses and teacher-level analyses that explored relationships between students’ ALEKS usage and LEAP performance. The qualitative portion of the study took into consideration previous research findings that have reported associations between program implementation and student achievement. This portion of the study included thematic analyses that examined the following relationships: ALEKS implementation in relation to teacher groups (i.e., RtI 8, Math 8, Both, and Magnet), ALEKS implementation of each teacher and LEAP performance, and ALEKS implementation in relation to teacher rankings (i.e., high student achievement or HSA / low student achievement or LSA) and LEAP performance.
Key findings from the quantitative analyses indicated that ALEKS usage in terms of time spent and concept mastery did not make a statistically significant impact on students’ LEAP performance for any of the teachers except one teacher. In contrast, ALEKS usage in terms of skill mastery made a statistically significant impact on students’ LEAP performance for HSA teachers and for one LSA teacher. However, low usage of ALEKS in terms of time spent limited my ability to fully assess the potential impact of ALEKS usage on students’ LEAP performance. Key findings from the qualitative analyses indicated that there were differences in ALEKS implementation amongst teacher groups. To control for group differences, this study focused on Math 8 teachers who used the ALEKS Middle School Math Course 3 curriculum; these teachers were ranked into student achievement groups HSA and LSA. In essence, ALEKS implementation of HSA teachers were more closely aligned with ALEKS (2017) Best Practices for program
xv
implementation compared to LSA teachers. ALEKS implementation of LSA teachers typically deviated from ALEKS (2017) Best Practices. Overall, these findings suggest that despite low usage of ALEKS in terms of time spent, teachers who more closely followed the recommendations of ALEKS (2017) Best Practices had positive statistically significant associations between students’ skill mastery on ALEKS and LEAP performance.
1
CHAPTER ONE. STATEMENT OF THE PROBLEM
IntroductionThroughout the recent history of American education, methods used to promote student learning have often reflected the theoretical ideals and interests of educational psychologists, who sometimes have provided technological tools to enhance those efforts. During the 1950s and 1960s, behaviorist ideals dominated the field of education, promoting pedagogical practices such as traditional whole group instruction together with exercises that promoted skill development through rote memorization. Skinner’s (1958) learning machines are an early instance of such technological development. More recently, technology development reflecting behaviorist perspectives have been promoted through computer-assisted instruction (CAI) programs (Nwana, 1990). Although CAI programs contained content knowledge, they were instructionally inflexible. They were incapable of adapting instruction to the knowledge state of the learner. Reflecting behaviorist theory, CAI programs were primarily geared toward eliciting set performances from students, without direct reference to underlying concepts (Shute & Psotka, 1996).
During the early 1970s, limitations of the behaviorist approach to teaching and learning gave rise to a paradigmatic shift in educational reform: Cognitive science. Cognitive science is the study of how humans process information (Cruickshank, Jenkins, & Metcalf, 2012). In application, understanding people’s thinking process is key to developing more effective lessons that tailor to the needs of individual learners. This approach to teaching and learning is referred to as personalized instruction. Promotion of this principle has been reflected in the field of computer science such as the development of intelligent tutoring systems (ITSs). ITSs are computer programs designed to facilitate personalized instruction through artificial intelligence (AI) techniques (Shute & Psotka, 1996). Cognitive psychologists have been advocating the use of
2
ITSs because they believe the use of ITSs are the most promising approach for facilitating effective personalized instruction (Sleeman & Brown, 1982). Pitler, Hubbell, Kuhn, and Malenoski (2007) claimed that when “applied effectively, technology implementation not only increases student learning, understanding, and achievement but also augments motivation to learn, encourages collaborative learning, and supports development of critical thinking and problem-solving skills” (para. 3).
Currently, considering the growing trend of American classrooms becoming more diverse compared to previous decades, there has been a greater demand for teacher competency in addressing the needs of all learners in the most effective way possible. ITSs claim to provide teachers the extra hands to more effectively accommodate the needs of each and every learner, making it all the more possible for teachers to simultaneously teach each and every student at his/her own learning pace or cognitive abilities. However, one major ITS challenge is determining
best practices for program implementation (Keles, 2011; Rodrigues, Novais, & Santos, 2005). Bestpractices for ITS implementation have been unclear since its creation. As Rodrigues, Novais, and Santos (2005) stated:
The proliferation of ITS, has spawned many debates about their use and effectiveness: The Degree of Learner Control: How much learner control should be allowed by the systems? Individual vs. Collaborative Learning: Should learners interact with ITS individually or collaboratively? Situated Learning: Is learning situated, unique, and ongoing, or is it more symbolic, following from an information processing model? Virtual Reality and Learning: Does virtual reality uniquely contribute to learning beyond computer aided instruction or multimedia? (p. 1).
Despite favorable results reported in many studies spanning a wide variety of implementation practices, there is a need to better understand the efficacy of particular practices with respect to student achievement. In fact, there is very little research that investigated the impact of ITS implementation and students’ mathematics achievement, particularly on state benchmark
3
exams. One study that examined the impact of curriculum implementation on student achievement confirmed prior research findings that have reported positive associations between the implementation of learner-centered curricula and student achievement. However, findings from this study also indicated that there is a negative association between poor curriculum implementation and student achievement (Ikemoto, Steele, & Pane, 2016). Another study conducted by Hill, McGinn, and Gilbert (2015) evaluated the quality of mathematics instruction in the U.S., particularly the quality of mathematics lessons in the middle grades. Even though associations between lesson quality and student achievement were not examined, results indicated much needed improvement in the quality of mathematics instruction in middle schools, including the need for professional development that support teachers in effectively facilitating standards-based practices (Hill, McGinn, & Gilbert, 2015).
As a middle school mathematics teacher, I have facilitated several ITSs that claim to improve student performance in mathematics. One ITS I used was the Assessment and Learning in Knowledge Spaces program (ALEKS). I chose to study relationships between students’ ALEKS usage, program implementation, and their performance on the 2017 – 2018 LEAP 2025 mathematics assessment because this will contribute to the existing body of research related to the effects of ALEKS on student performance. Additionally, considering there is very little research concerning the impact of program implementation on student performance, it seems worthwhile to carefully monitor program effectiveness within a particular Louisiana school district in relation to program implementation. From here on, this particular school district will be referred to as DISTRICT.
In this chapter, I will elaborate on the following: 1) Problem statement; 2) Purpose of the study; 3) Rationale; 4) Research questions; 5) Theoretical framework of the study.
4
Purpose of the Study
Previous studies indicate that although the ALEKS program has been implemented in schools and school districts across the U.S., research results concerning the impact of the ALEKS program on students’ mathematics achievement are mixed. Some schools and school districts reported highly favorable results, indicating that the ALEKS program did improve student performance (ALEKS, 2018; Craig, Hu, Graesser, et al., 2013). However, one study conducted by Craig, Hu, Graesser, et al. (2013) reported that the performance of students in ALEKS-led classrooms did not significantly differ from students taught by expert teachers in the Tennessee Comprehensive Assessment Program (TCAP). Craig, Hu, Graesser, et al. (2013) also reported that during school hours, levels of student engagement were the same in ALEKS-led classrooms as there were in classrooms taught by expert teachers. These findings suggest that solely incorporating instructional technology does not guarantee improved academic performance (Craig, Hu, Graesser, et al., 2013). However, students who participated in ALEKS after-school remediation required significantly less assistance from their teachers compared to students who did not participate in ALEKS after-school remediation (Craig, Hu, Graesser, et al., 2013).
Huang, Craig, Xie, Graesser, and Hu (2016) also investigated the effects of ALEKS on student learning when implemented after school and reported that ALEKS was more effective when implemented after school than during school hours. This claim was supported by other educational researchers (Finn, Yan, Martin, et al., 2017; Young, Ortiz, & Young, 2017; Stacy, Cartwright, Arwood, Canfield & Kloos, 2017).
Other factors believed to affect student performance on ITSs are as follows: 1) Student behavior. Baker, Xie, Mojarad, Shubeck, Essa, and Hu (2017) argued that student behavior and learning strategies play a key role in improving student achievement on ITS programs such as
5
ALEKS; 2) Student attendance rate. Vandell, Reisner, Brown, et al. (2005) indicated that the effectiveness of after-school programs is often uncertain due to sporadic attendance in the programs. Moreover, many students view after-school programs as additional school time and are, therefore, less likely to attend on a consistent basis. 3) Program implementation. John Marzion, the Math Learning Coach at East Middle School, stated that the "most effective use of the [ALEKS] program involved longer class periods during which ALEKS was combined with small group instruction" (ALEKS, 2018, p. 2). On the contrary, the ALEKS corporation (2019) strongly encourages independent work on ALEKS to maximize program benefits.
Considering mixed results, this study will investigate the following issues:
1. The relationship between ALEKS implementation and student achievement on the 2017 – 2018 LEAP 2025 mathematics state benchmark assessment.
2. The relationship between students’ ALEKS usage (i.e., the number of hours spent and the percentage of concepts covered) and student achievement on the 2017 – 2018 LEAP 2025 mathematics state benchmark assessment.
Concerning the first issue, the purpose of exploring associations between ALEKS implementation and students’ LEAP performance is to contribute to the existing body of research related to the effects of ALEKS implementation on student achievement. In this study, this relationship will be thematically examined in relation to statistically significant findings.
For the second issue, results from this study will reveal whether or not there is an advantage to using ALEKS, including whether or not the program is more beneficial to certain student demographics than others. Considering that learning experiences are unique to each individual, it is worthwhile to explore the impact of the ALEKS program on students’ mathematics achievement within DISTRICT.
6
Rationale for the Study
This study was motivated by mixed results concerning ALEKS program benefits on student learning. Considering DISTRICT’s district-wide mandate of the ALEKS program during the 2017 – 2018 academic school year, I conducted this study to determine whether or not ALEKS improved students’ mathematics achievement within DISTRICT, including which implementation practices made a positive impact on student performance.
According to the Louisiana Department of Education (LDE) Louisiana Believes webpage, DISTRICT’s performance data for 2015 – 2018 indicates that twenty-nine percent of DISTRICT’s eighth-grade population in 2018 performed at or above the Proficient level (or Mastery level), which is a two-percentage point increase compared to 2017, four-percentage points shy of the national average (33%). Given these results, I am interested in discovering which ALEKS usage variables contributed to the increase as well as the extent to which they impacted student performance. Therefore, this study will explore the following concerning 2017 – 2018 district data:
1. The portion of students’ mathematics achievement that can be explained by their ALEKS usage. Examining this will reveal which ALEKS usage variables actually made a positive impact on student performance.
2. The portion of students’ mathematics achievement that can be explained by program implementation. Results will inform DISTRICT how ALEKS was bestimplemented. This study is significant for the following reasons: First, it will contribute to the existing body of research concerning the relationship between students’ ALEKS usage, program implementation, and performance on mathematics benchmark assessments. Second, statistical analysis of DISTRICT’s district data will confirm whether or not there is an advantage to using the ALEKS program. If there is an advantage, we will be able to determine the extent to which the ALEKS program impacted student performance according to demographics. Third, results
7
from this study will inform DISTRICT’s educators, including myself, of bestpractices for program implementation. If results from this study indicate that certain implementation practices had a positive impact on students’ mathematics achievement, district educators may use this information to make necessary adjustments to instructional design to optimize program benefits. Fourth, presenting evidence that supports program benefits on student learning may increase teacher and student buy-in to using the program. In essence, results from this study will provide information that may help DISTRICT establish policies for future ALEKS use.
Research Questions
This study addressed five questions, as follows:
1. Is there a relationship between the amount of time students spent on ALEKS and their performance on the 2017 – 2018 LEAP 2025 mathematics assessment when we control for prior LEAP performance?
2. Is there a relationship between the percentage of concepts students mastered on ALEKS and their performance on the 2017 – 2018 LEAP 2025 mathematics assessment when we control for prior LEAP performance?
3. Is there a relationship between concepts mastered on ALEKS, time spent on ALEKS, and 2017 – 2018 LEAP 2025 exam scores when we control for prior LEAP performance? 4. Did ALEKS implementation differ across teacher groups?
5. Was there a difference in the implementation of ALEKS between teachers with higher student achievement and those with lower student achievement on the 2017 – 2018 LEAP 2025 mathematics assessment?
Theoretical Foundations
This study is guided by two theoretical foundations: Knowledge Space Theory (KST) and Cognitive Learning Theory (CLT). This section addresses why both frameworks were selected, including what each theory entails.
Knowledge Space Theory
8
on the theoretical premise that every knowledge domain or subject area can be represented by a set of problems within that domain (Craig, Hu, Graesser, et al., 2013). Two major principles of KST are as follows: 1) The construction of student knowledge models (also referred to as learner models); 2) The construction of knowledge structures from student knowledge models. In application, students’ knowledge of subject matter is represented through a set of problems he/she is able to solve, which is referred to as one’s knowledge state. From student’s knowledge state, a knowledge structure or ALEKS learning path (ALEKS, 2019) is generated to precisely adapt instruction and activities to meet learner’s needs.
Cognitive Learning Theory
CLT was adopted to guide my analysis of ALEKS survey results concerning program implementation practices. CLT centers around the fact that students process information in unique ways. CLT not only focuses on students’ individual thought processes but also bestpractices for technology implementation. From ALEKS survey results, this theory will be tested to determine whether or not there is an actual advantage to implementing the ALEKS program according to CLT goals for cognitive learning.
CLT, developed by Pitler, Hubbell, Kuhn, et al. (2007), primarily focuses on cognition (understood as information processing). Application of CLT stresses the importance of activity scaffolding together with technology integration. Instructional practices that target CLT goals for cognitive learning are as follows: 1) Scaffold instruction to enhance students’ ability to recall and organize information in order to make organized information more meaningful; 2) Provide feedback to students concerning their progress; 3) Provide opportunity for cooperative learning (the primary mechanism used to store information into long-term memory); 4) Provide positive
9
reinforcement to increase student motivation (e.g., praise); 5) Provide homework assignments to aid students’ memory retention of content taught or discussed (Bowen, 2010)
Note that the ALEKS program integrates goals 1, 2, 4 into its program framework. Goals 3 and 5 can be obtained by providing students opportunities to collaborate during ALEKS
sessions as well as encouraging them to work on ALEKS at home.
Summary
This chapter provided the background information and focus for this study. Background information included an historic overview of events that influenced ITS development, mixed reports concerning the effectiveness of ALEKS on student learning, and eighth-grade performance on the 2017 – 2018 LEAP 2025 mathematics assessment within DISTRICT. The focus of this study is the relationship between ALEKS usage, program implementation, and student learning. Extensive analysis of topics related to background information and focus of this investigation was presented in Chapter Two.
Definition of Terms
The following are definitions and abbreviations for key terms used in this study:
Assessment and LEarning in Knowledge Spaces program (ALEKS). A web-based ITS
that utilizes artificial intelligence techniques (i.e., KST) to personalize instruction for each individual learner (ALEKS, 2018). It is the only commercial ITS program that is based on the application of KST (Maciuszek, 2018).
Artificial intelligence (AI). Originating from the field of cognitive psychology, it is the study of cognition through computational models (Charniak & McDermott, 1985). The incorporation of AI techniques makes it possible for computers to provide means of studying human cognition, which is critical to the advancement of educational practices.
10
Computer-assisted instruction (CAI). Computer programs designed to deliver
individualized instruction and are primarily geared towards eliciting set performances from students, without direct reference to underlying concepts (Shute & Psotka, 1996).
Education data mining (EDM). A relatively recent field in the advancement of adaptive learning (Vandewaetere and Clarebout, 2014). EDM involves the exploration of “unique types” of student data with specific ties to educational settings (Vandewaetere and Clarebout, 2014). The purpose is to better understand each and every learner within the context of their social environment.
Intelligent tutoring systems (ITS). Computer systems that are based on merged theoretical principles of cognitive psychology and artificial intelligence (Shute and Psotka, 1996). ITSs incorporate AI to produce behaviors that we deem intelligent such as knowing content knowledge, retrieving knowledge about the learner, and devising approaches that help the learner master instructional objectives (Shute & Psotka, 1996).
Knowledge space theory (KST). Developed by Doignon and Falmagne (1999), it is the
cognitive science behind ALEKS. KST is based on the premise that every knowledge domain can be represented by a set of problems within that domain (Craig, Hu, Graesser, et al., 2013). Application of KST enables the ALEKS program to precisely adapt instruction and activities to meet learner’s needs based upon learner’s responses (ALEKS, 2018).
LEAP 2025 mathematics benchmark assessment (LEAP 2025). According to LDE
Louisiana Believes LEAP 2025 ELA, Math, and Social Studies 2018 Interpretive Guide (2018), LEAP 2025 are summative assessments that reveal students’ strengths and weaknesses concerning the following subcategories: Major Content with grade-specific subcategories, Additional & Supporting Content, Expressing Mathematical Reasoning, and Modeling & Application. Students’
11
overall level of mathematical competency is indicated by a scaled score, which ranges from 650 – 850 (LDE, 2018).
National Assessment of Educational Progress (NAEP). The largest national assessment
program that periodically administers benchmark assessments for grade levels four, eight, and twelve in the following subject areas: “Reading, mathematics, science, writing, U.S. history, civics, geography, and other subjects” (National Assessment Governing Board [NAGB], 2015, para. 13). NAEP reports national results on The Nation’s Report Card webpage. Reports include student demographics, state performance rankings, and historic trends of student performance in mathematics and English Language Arts (ELA).
12
CHAPTER TWO. REVIEW OF THE LITERATURE
IntroductionIn this chapter, I present a review of scholarly literature related to the development of ITSs, reasons supporting ITS integration in mathematics education, ITS impact on students’ mathematics achievement, and best practices for ITS implementation. This chapter begins with Middle School Mathematics Performance in the U.S. since the 1990s, which establishes the major premise for which many ITSs continue to evolve in order to support national learning goals for mathematics education. In recent decades, U.S. students’ mathematics achievement scores on state benchmark exams and national assessments have been the major driving force for educational reform, specifically concerning mathematics standards, mathematics curricula, and pedagogical practices. Concurrent to these ongoing changes, ITS infrastructure and frameworks have constantly evolved to meet learners’ needs with the ultimate goal of improving student learning and achievement.
In the subsequent sections, the following issues (indicated by subheadings) are addressed in relation to the purpose of this study: Instructional Quality in U.S. Middle Schools (to examine teacher effectiveness in the implementation of lessons and student activities according to implementation guidelines for Common Core State Standards, also referred to as CCSS); The Link between Curriculum Implementation and Students’ Mathematics Achievement (to determine whether or not there has generally been a significant correlation between ITS implementation and students’ mathematics achievement on benchmark exams); NCTM’s Mathematics Best Practices for Instruction and Technology Implementation (to serve as a benchmark for analyzing ALEKS survey results concerning program implementation); The Motivational Premise behind Intelligent Tutoring System Integration in Education (to explore the role and significance of ITSs in
13
mathematics education such as improving student engagement, student learning and student performance); Historical Review of ITS Progression as a Learning Tool (to investigate the ongoing development of ITSs since the beginning of ITS creation); The ALEKS program (a very popular, multi-purpose ITS for K - 12 mathematics), its intended use and impact on student learning.
Middle School Mathematics Performance in the U.S. since the 1990s
In the U.S., mathematics has been one of the most challenging subjects to master, particularly in the middle grades. NAEP’s The Nation's Report Card reported that only thirteen percent of the U.S. fourth-grade mathematics achievement scores were at or above the Proficient level in 1990. By 2017, although the percentage of fourth-grade mathematics achievement scores at or above the Proficientlevel approximately tripled (i.e., to forty percent), these results indicated that fewer than half of the U.S. fourth-grade population are Proficient in mathematics (NAEP, 2017, para. 1). In fact, the average fourth-grade mathematics achievement score in 2017 increased by only twenty-seven points since 1990 (U.S. Department of Education [ED], 2018).
U.S. eighth-grade mathematics achievement scores were more troubling. In 1990, fifteen percent of eighth-grade mathematics achievement scores were at or above the Proficient level, which was two percentage points higher than fourth-grade mathematics achievement scores at the time. In 2003, however, eighth-grade mathematics achievement lost the lead and continued to lag behind fourth-grade mathematics achievement. By 2017, only thirty-three percent of eighth-grade students performed at or above the Proficient level compared to forty percent in fourth-grade. These results also indicated that sixty-six percent of U.S. eighth-grade students were below
14
Analyzing the Decline in U.S. Mathematics Achievement: A Closer Look
NAEP, “a congressionally authorized project of the National Center for Education Statistics within the Institute of Education Sciences of the U.S. Department of Education,” has periodically administered assessments since 1969 for grade levels four, eight, and twelve in the following subject areas: “Reading, mathematics, science, writing, U.S. history, civics, geography, and other subjects” (NAGB, 2015, para. 13). NAEP’s mathematics assessments address five mathematical domains: “number properties and operations; measurement; geometry; data analysis, statistics and probability; and algebra” (NAGB, 2015, para. 5). According to NAGB (2015), fourth-grade students who scored at or above the Proficientlevel were likely to exhibit competency in dividing a “three-digit whole number by a one-digit whole number” (para. 5). Eighth-grade students who scored at or above the Proficient level were likely to “translate a verbal statement
into an equation” (NAGB, 2015, para. 5).
Although there has been a significant increase in the performance of fourth-grade students since 1992, the average mathematics achievement score in 2015 was significantly lower compared to 2013, while the average mathematics achievement score in 2017 did not significantly differ from 2015 (NAEP, 2017, para. 1). Fourth-grade mathematics achievement was also analyzed according to the following percentiles: 10th percentile, 25th percentile, 50th percentile, 75th
percentile, and the 90th percentile (NAEP, 2017, para. 3). There was an upward trend in
fourth-grade mathematics performance in all five percentiles between 1990 – 2013. In 2017, however, the average mathematics performance was lower at the 10th and 25th percentiles compared to
respective categories in 2015 (NAEP, 2017, para. 3).
Concerning eighth-grade mathematics, results are as follows: There has been an upward trend in the mathematics performance of eighth-grade students since 1992. However, in 2015,
15
there was a significant drop in the average mathematics score compared to 2013. Whitehurst (2015) translated the five-point decline in NAEP mathematics assessments to “mean that eighth graders in 2015 were roughly six months of school behind eighth graders in 2013” (para. 3). Additionally, 2017 results did not significantly differ from 2015 (NAEP, 2017, para. 1).
Concerning percentile scores, results for eighth-grade mathematics achievement were as follows: The average mathematics score of eighth-grade students who ranked in the twenty-fifth percentile in 2017 was two points lower than the average performance score in 2015 (NAEP, 2017, para. 3). Additionally, the average mathematics score of eighth-grade students who ranked at or above the seventy-fifth percentile in 2017 were a bit higher compared to respective categories in 2015 (NAEP, 2017, para. 3).
Parallels between U.S. Fourth-grade and Eighth-grade Mathematics Achievement
Considering the results for grade levels four and eight, there appears to be remarkable similarity in students’ mathematics achievement according to NAEP reports: 1) There was an upward trend in students’ mathematics achievement between 1990 and 2013; 2) The 2013 school year marked a pivotal point from the upward trend of students’ mathematics achievement in both grade levels; 3) The average performance in fourth-grade and eighth-grade mathematics in 2015 was significantly lower compared to 2013; 4) The average performance in mathematics for 2017 did not significantly differ from 2015 (NAEP, 2017).
Louisiana’s Eighth-grade Mathematics Achievement according to Demographics
NAEP (2017) reported that trends in eighth-grade NAEP mathematics average scores within the state of Louisiana were similar to national trends: 1) The 2013 school year marked a pivotal point concerning eighth-grade mathematics achievement; 2) In 2015, there was a significant decline in student performance compared to 2013; 3) The average performance in
16
eighth-grade mathematics for 2017 did not significantly differ from 2015 results. In fact, the significant decline in students’ mathematics achievement for grade eight, which occurred between 2013 and 2015, was evident across the following student demographics: 1) Race; 2) Gender; 3) School location (NAEP, 2017). However, it is worthy to note that while there was not a significant drop in students’ mathematics achievement for eighth-grade students who were identified with disabilities, the mathematics performance of eighth-grade students who were not identified as students with disabilities reflected the national trend, particularly between 2013 and 2017 (NAEP, 2017).
Reasons Speculated for the 2015 National Decline
The post-2013 decline in U.S. students’ NAEP mathematics achievement scores have gained national attention: Kane (2015) from Brookings Institution stated, “[This] was the first time that math achievement had fallen in either fourth grade or eighth grade . . . since 1990” (para. 1). The New York Times (2016) reported: “[T]he average performance of the nation’s high school seniors dropped in math from 2013 to 2015. [Also, the] lower-grade results . . . released last fall . . . showed a similar decline in math” (para. 1).
Several factors have been speculated to explain the post-2013 decline in U.S. students’
NAEP mathematics achievement scores across the grade levels. Heitin (2015), assistant editor for
Education Week, stated: “With U.S. students' math and reading scores showing statistically significant declines on a national test for the first time in more than two decades, advocates on all sides have begun pointing fingers” (para. 1). Transitioning to CCSS, frequent testing, changes to demographics, and the availability of advance math courses were all considered to explain causation.
17
According to The New York Times, “Students who scored at the average [or at the Basic level] were likely to be able to use proportions to calculate height, but [were] unable to use an algebraic model to predict cost using a calculator” (para. 10). The New York Times (2016) added, “[T]hose who scored better were the students who took advanced math courses like calculus and read more pages in and out of school. Higher-scoring students also read for fun almost every day” (para. 12).
Whitehurst (2015) from Brookings Institution shared a different perspective: What accounts for the decline? It is never just one thing. Further, NAEP is to schooling as a thermometer is to a medical patient. It tells something important about the health of its subject, but virtually nothing about why things are as they are. That hasn’t stopped the usual pouring forth of opinions and punditry about what this year’s NAEP results mean. (para. 4)
According to Whitehurst (2015), forty-three states including the District of Columbia (D.C.) adopted CCSS in 2010 (para. 8). However, by 2015, only twenty-eight states including D.C. adopted CCSS and administered either PARCC or SBAC exams. The remaining twenty-two states did not fully participate in the CCSS initiative.
In 2015, Whitehurst conducted a study to compare the average mathematics scores in 2013 and 2015 for grade levels four and eight. Results indicated that fourth-grade and eighth-grade students in PARCC or SBAC states performed on average one scale point lower than the remaining states. Results also revealed that the decline in student performance since 2013 was evident in most states, regardless of their participation in PARCC or SBAC (Kane, 2015, para. 13). Therefore, the implementation of CCSS coupled with administration of PARCC or SBAC assessments were no longer considered as casual factors to the post-2013 decline in students’ mathematics achievement. Researchers such as Heitin (2015) cautioned gullibility to unsubstantiated speculations. Minnich (2015), executive director of the Council of Chief State
18
School Officers, shared similar sentiments: “We need to make sure we don’t overreact to one data point. We were sure not to do that two years ago when we saw the data uptick.”
Summary
The post-2013 decline of students’ NAEP mathematics achievement scores in the U.S. invoked nation-wide concern, prompting educational researchers to investigate the cause. According to the literature in this section, the following factors (or variables) were speculated: Transitioning to CCSS, frequent testing, changes to demographics, and the availability of advance math courses. Considering these variables, studies were conducted to determine possible causation. However, statistical analysis disproved these variables to be contributing factors to the post-2013 decline in U.S. mathematics achievement scores.
Instructional Quality in U.S. Middle Schools
Instructional quality has also been considered a contributing factor to the post-2013 decline in mathematics achievement. Attention was given to constant changes in instructional practices and tools between 2013 and 2015. Kane (2015) elaborated:
[A] forthcoming report from the Center on Education Policy Research at Harvard on implementation of the Common Core in five PARCC and SBAC states, we learned that more than half of elementary teachers and two-fifths of middle school teachers reported having changed more than three-quarters of their classroom instruction. Two-thirds of elementary math teachers report changing three-quarters or more of their instructional materials. Nearly half of elementary math teachers and more than one-third of middle school math teachers reported adopting a new textbook in 2013-14 or 2014-15. (para. 13)
In efforts to evaluate the quality of mathematics instruction in the U.S., Hill, McGinn, and Gilbert (2015) from the Center of Education Policy Research at Harvard University conducted a study to examine the quality of mathematics lessons in the U.S., particularly in the middle grades. In this study, one hundred, fifty-eight U.S. middle school mathematics teachers from forty-three
19
states were randomly selected to participate. In this study, teachers were asked to use a Samsung Galaxy 4 tablet to video-tape no more than four lessons (Hill, McGinn, & Gilbert, 2015).
Hill, McGinn, and Gilbert (2015) analyzed the video-taped lessons using the Mathematical Quality of Instruction (MQI) instrument, which provided three domains for instructional evaluation: 1) Domain 1 - Richness of the Mathematics, which involves “[h]ow mathematical
explanations, representations, language, and generalizations are developed in a lesson [as well as] the extent to which teacher and students engage in mathematical sense-making”; 2) Domain 2 - Working with Students and Mathematics, which concerns how teachers respond to students’ mathematical reasoning; 3) Domain 3 - Common Core-Aligned Student Practice. This domain involves the extent to which students participate in mathematical reasoning and communication, including how they engage in cognitively challenging tasks.
Results were as follows: 3,250 lessons were analyzed according to all three domains. Concerning Domain 1 (richness), only sixty-one percent of lessons had between minimal to strong presence of content richness. However, the percentage of lessons containing minimal richnessin mathematics content (i.e., 41%) approximately doubled the percentage of lessons ranked moderate or strong (i.e., 20%) (Hill, McGinn, & Gilbert, 2016).
Concerning Domain 2, seventy-nine percent of all lessons involved working with students. Of the seventy-nine percent, forty-five percent of the lessons (the majority) revealed that this form of instructional practice was minimally present, while only three percent of the lessons revealed that this form of instructional practice was highly present. The remaining thirty percent of lessons revealed that this instructional approach was moderately present (Hill, McGinn, & Gilbert, 2016). Concerning Domain 3, fifty-three percent of lessons had student activities aligned with CCSS. However, in the majority of the lessons (i.e., 36%), activity alignment to CCSS was
20
minimally present, while in only two percent of the lessons was activity alignment to CCSS highly present (Hill, McGinn, & Gilbert, 2016).
Results from this study suggested that although most U.S. middle school teachers did implement instructional practices promoted by CCSS, there was much room for improving instructional quality in all three domains (Hill, McGinn, & Gilbert, 2016).
Summary
The study conducted by Hill, McGinn, and Gilbert (2015) revealed that mathematics instruction in U.S. middle school classrooms demonstrated the presence of all three MQI domains. Excluding lessons that demonstrated no presence of MQI domains, lesson quality was typically rated from low to moderate in each category. The majority of these lessons contained minimal richness in content (Domain 1). Likewise, teachers working with students during class time (Domain 2) and activity alignment to CCSS (Domain 3) was minimally present. Results indicated much needed improvement in mathematics instruction for U.S. middle schools. Moreover, instructional quality was a potential contributor to student achievement, and therefore, is a critical area to target for further examination, specifically concerning its impact on student learning.
The Link between Curriculum Implementation and Students’ Mathematics Achievement According to the Institute of Education Sciences (IES, 2013), more evidence-based research needs to be conducted to improve professional development for teachers concerningbest practices: “Prior studies have examined the relationships between various instructional practices and student achievement, but uncertainty remains about which practices teachers should use” (p.
1).
While some studies have suggested that there was a positive correlation between the frequency of teacher-directed, whole-class instruction and higher student achievement (Baker,
21
Gersten, & Lee, 2002; Darch, Carnine, & Gersten, 1984; Hopkins, McGillicuddy-De Lisi, & De Lisi, 1997; Rittle-Johnson, 2006), other studies have suggested that using mathematical
representations, differentiating instruction, facilitating mathematical discourse amongst students, and encouraging students to lead instructional routine were positively associated with higher student achievement (Bransford, Brown, & Cocking, 2000; Fuchs, Fuchs, Phillips, Hamlett, & Karns, 1995; Hickey, Moore, & Pellegrino, 2001; Muthukrishna & Borkowski, 1995; Slavin & Karweit, 1985). On the contrary, researchers such as Fuchs, Fuchs, Courey, Hamlett, Sones, and Hope (2006) have reported a negative association between student-centered practices and lower
student achievement.
A study conducted by Ikemoto, Steele, and Pane (2016) over the course of three consecutive school years (i.e., 2005 – 2006, 2006 – 2007, and 2007 – 2008) examined the impact of Carnegie Mellon University’s Cognitive Tutor Geometry curriculum on students’ mathematics achievement in Baltimore County Public Schools, referred to as BCPS. In this study, eight out of twenty-five high schools in BCPS participated (Ikemoto, Steele, & Pane, 2016). Student demographics consisted of an urban population that was well diverse racially and socioeconomically, whereby the average enrollment rate of minority students was forty-six percent and the percentage of students who qualified for free or reduced-price meals was twenty-six percent (Ikemoto, Steele, & Pane, 2016).
At each of the eight schools, two teachers were assigned to teach two courses of geometry: One course was guided by the Cognitive Tutor Geometry curriculum (treatment group), whereas the other geometry course was guided by the BCPS curriculum (control group) (Ikemoto, Steele, & Pane, 2016). Curricula implementation and instructional practices were monitored three times a year, and teacher interviews were conducted after each visit. BCPS’ geometry final exam was
22
used to measure student achievement in geometry. Statistical analysis controlled for students’ prior performance in mathematics to increase the precision of results. Finally, implementation practices were analyzed (Ikemoto, Steele, & Pane, 2016).
Results from this study were as follows: The Cognitive Tutor Geometry curriculum had a negative impact on students’ mathematics achievement (Ikemoto, Steele, & Pane, 2016). The negative impact on student achievement was attributed to the ineffective implementation of learner-centered practices: Even though “[f]idelity to Cognitive Tutor materials” received a high
rating and computer lab usage met Carnegie Learning’s guidelines, implementation frequency of learner-centered practices such as assigning students presentations fell well below what was prescribed for best results. According to Carnegie Learning, “ . . . students are expected to share ideas, strategies, and knowledge—in at least four out of every 10 class periods” (Ikemoto, Steele, & Pane, 2016, p. 2).
The largest difference between the treatment and control classrooms was the extent to which students were encouraged to collaborate during class time: In treatment classrooms, the median teacher typically assigned, monitored, and supported collaborative learning approximately thirty percent to eighty percent of the time (Ikemoto, Steele, & Pane, 2016). In control classrooms, the median teacher encouraged collaborative learning less than thirty percent of the time (Ikemoto, Steele, & Pane, 2016). Both treatment and control classrooms failed to meet Carnegie Learning’s expectation of facilitating collaborative learning eighty percent of the time.
Concerning the relationship between curriculum implementation and students’ mathematics achievement, insufficient sample size provided very limited statistical power for precise correlations to be detected. Grounded theory analysis (Creswell, 1998; Glaser & Strauss,
23
1967) of observation notes was conducted to further explore “whether and how implementation influenced student achievement” (Ikemoto, Steele, & Pane, 2016, p. 6).
Results from grounded theory analysis were as follows: Notes from repeated observations over the course of three consecutive school years provided a general sense that during group tasks, students had a greater tendency to engage in off-task behavior in treatment classrooms than in control classrooms (i.e., classrooms with primarily teacher-directed instruction) (Ikemoto, Steele, & Pane, 2016). Teachers’ ineffective implementation of the treatment curriculum appeared to have limited productive mathematical discourse amongst students, thereby inhibiting students’ ability to fully acquire curriculum learning goals (Ikemoto, Steele, & Pane, 2016). Therefore, students in treatment classrooms tended to wait for teacher assistance more so than students in control classrooms (Ikemoto, Steele, & Pane, 2016).
Additionally, the following factors (themes) were examined: “teacher buy‐in, administrative support, type and intensity of professional development, technological resources and support, principal and department chair turnover, computer lab type (separate lab vs. in‐ classroom laptops), and the role of teachers’ and students’ prior experience with learner‐centered instruction” (Ikemoto, Steele, & Pane, 2016, p. 7). These themes were numerically coded for explanatory correlational analysis between themes and levels of curriculum implementation. Ikemoto, Steele, and Pane (2016) dismissed many of the themes due to the presence of insufficient evidence or contradictory evidence.
Concerning instructional tools, teachers received adequate resources to fully implement the Cognitive Tutor curriculum. However, they lacked knowledge in learner-centered teaching practices, curriculum experience and did not receive intensive training that would support optimal benefits from Cognitive Tutor(Ikemoto, Steele, & Pane, 2016).
24
Summary
Results from this study supported previous research studies that revealed a significant correlation between learner-centered instructional practices and students’ mathematics achievement. Specifically, effective implementation of a learner-centered curriculum correlate with higher student performance, whereas ineffective implementation of a learner-centered curriculum correlate with lower student performance (Ikemoto, Steele, & Pane, 2016). This suggests that curriculum activities alone cannot benefit student achievement without effective implementation. Therefore, professional training programs are crucial to teacher and student success in the classroom.
Mathematics Best Practices for Instruction and Technology Implementation
National Council of Teachers of Mathematics (NCTM, 2014) Principles to Actions: Ensuring Mathematical Success for All established eight mathematical teaching practices that have proven effectiveness in promoting deep learning of mathematics based on previous research.
These practices align with CCSS and prepare students for post-secondary education and beyond (NCTM, 2014). NCTM (2014) referred to these practices as high leverage teaching practices, which are as follows:
1. Establish mathematics goals to focus learning.
2. Implement tasks that promote reasoning and problem solving. 3. Use and connect mathematical representations.
4. Facilitate meaningful mathematical discourse. 5. Pose purposeful questions.
6. Build procedural fluency from conceptual understanding. 7. Support productive struggle in learning mathematics.