Social Inclusion (ISSN: 2183–2803) 2019, Volume 7, Issue 1, Pages 80–89 DOI: 10.17645/si.v7i1.1631 Article
Reliability of Longitudinal Social Surveys of Access to Higher Education:
The Case of Next Steps in England
Nadia Siddiqui *, Vikki Boliver and Stephen Gorard
Durham University Evidence Centre for Education, Durham University, Durham, DH1 3LE, UK;
E-Mails: [email protected] (N.S.), [email protected] (V.B.), [email protected] (S.G.) * Corresponding author
Submitted: 15 June 2018 | Accepted: 19 September 2018 | Published: 10 January 2019 Abstract
Longitudinal social surveys are widely used to understand which factors enable or constrain access to higher education. One such data resource is the Next Steps survey comprising an initial sample of 16,122 pupils aged 13–14 attending English state and private schools in 2004, with follow up annually to age 19–20 and a further survey at age 25. The Next Steps data is a potentially rich resource for studying inequalities of access to higher education. It contains a wealth of information about pupils’ social background characteristics—including household income, parental education, parental social class, housing tenure and family composition—as well as longitudinal data on aspirations, choices and outcomes in relation to education. However, as with many longitudinal social surveys, Next Steps suffers from a substantial amount of missing data due to item non-response and sample attrition which may seriously compromise the reliability of research findings. Helpfully, Next Steps data has been linked with more robust administrative data from the National Pupil Database (NPD), which contains a more limited range of social background variables, but has comparatively little in the way of missing data due to item non-response or attrition. We analyse these linked datasets to assess the implications of missing data for the reliability of Next Steps. We show that item non-response in Next Steps biases the apparent socioeconomic composi-tion of the Next Steps sample upwards, and that this bias is exacerbated by sample attricomposi-tion since Next Steps participants from less advantaged social backgrounds are more likely to drop out of the study. Moreover, by the time it is possible to measure access to higher education, the socioeconomic background variables in Next Steps are shown to have very little explanatory power after controlling for the social background and educational attainment variables contained in the NPD. Given these findings, we argue that longitudinal social surveys with much missing data are only reliable sources of data on access to higher education if they can be linked effectively with more robust administrative data sources. This then raises the question—why not just use the more robust datasets?
Keywords
higher education; household income; longitudinal study; missing data; sampling bias; Next Steps Issue
This article is part of the issue “Inequalities in Access to Higher Education: Methodological and Theoretical Issues”, edited by Gaële Goastellec (University of Lausanne, Switzerland) and Jussi Välimaa (University of Jyväskylä, Finland).
© 2019 by the authors; licensee Cogitatio (Lisbon, Portugal). This article is licensed under a Creative Commons Attribu-tion 4.0 InternaAttribu-tional License (CC BY).
1. Introduction
Secondary datasets are useful resources for educational research. This article presents findings on the compari-son of two existing datasets, Next Steps and the National Pupil Database (NPD), which have been linked and made available for the purpose of research. We assessed the
research feasibility of the two linked datasets in pre-dicting young peoples’ entry to higher education. The analysis presents the strengths and limitations of the Next Steps and the NPD and the potential in linking the two for assessing educational outcomes. However, the results show that the participant dropout and miss-ing data in Next Steps introduces bias in the findmiss-ings
while the NPD provides more complete and reliable in-formation that explained most of the variation in the outcomes. The findings have research implications, em-phasising the need for completeness and follow-up of the dropout cases. The implications for widening access policies in higher education are to select the indicators with high reliability for use in contextualised admissions and similar.
2. Background
The expansion of higher education is a worldwide phe-nomenon which has enabled increasing numbers of students to enter a range of forms of higher educa-tion within increasingly internally differentiated naeduca-tional higher education sectors (Arum, Gamoran, & Shavit, 2007; Marginson, 2017; Jerrim & Vignoles, 2015). In the UK, around fifty percent of young people now progress to higher education at some stage compared to just five percent prior to the first wave of higher education expansion in the 1960s (Boliver, 2011; Department for Education [DFE], 2017). However, some inequalities in access have persisted, with those from lower socioe-conomic groups significantly under-represented in UK higher education, especially in the UK’s most prestigious higher education institutions (Boliver, 2015; Broecke, 2015; Gorard, Siddiqui, & Boliver, 2017; Harrison, 2011; Triventi, 2011) and in some subjects leading to the pro-fessions (BIS, 2013; Connor et al., 2001; Smith & White, 2011). These patterns of unequal participation have im-proved since the 1960s (Crawford, Gregg, Macmillan, Vignoles, & Wyness, 2016; Gorard, 2013), but they still exist despite expansion in the 1960s and 1990s (Adnett, McCaig, Slack, & Bowers-Brown, 2011).
The existing evidence for the UK shows that access to higher education is substantially predicated on prior at-tainment at secondary school level (Gorard et al., 2007), which is itself stratified in terms of socioeconomic back-ground (Chowdry et al., 2010). Students from less advan-taged backgrounds are under-represented in higher edu-cation, and especially in more academically selective in-stitutions and courses, at least partly because their prior qualifications are lower on average (Gorard et al., 2017; Younger, Gascoine, Menzies, & Torgerson, 2017). Even in the ‘Russell Group’ universities, which include many of those considered the most prestigious in the UK, rates of participation have been found to be similar for different socioeconomic groups with ostensibly the same levels of prior attainment, at least in some studies (Marcenaro-Gutierrez, Galindo-Rueda, & Vignoles, 2007; Chowdry, Crawford, Dearden, Goodman, & Vignoles, 2013), but less so in others (Zimdars et al., 2009). There is some evi-dence that a substantial proportion of high attaining dis-advantaged students are not accessing the most presti-gious forms of higher education, despite being qualified to do so, and despite nearly £842 million being spent on widening access initiatives in England in 2016 alone (HEFCE, 2017).
The emerging evidence on the enablers of and bar-riers to access to higher education is informed by anal-ysis of two main types of data: administrative data, and data obtained by means of social surveys. Admin-istrative data is collected by government agencies and can be linked year on year to enable individuals to be tracked longitudinally throughout their educational ca-reers. A major benefit of administrative data is its census-like nature which results in near-total population cov-erage, comparatively minimal missing data, and thus a highly representative analytical sample. A common dis-advantage of administrative data in the UK context, how-ever, is that it contains limited information about the broader context of young people’s lives. For example, one key administrative dataset, the NPD, contains infor-mation about whether school pupils are eligible for free school meals (FSM, an income-contingent welfare enti-tlement) but does not contain information about other aspects of socioeconomic background such as parental social class, parental education or household income. Moreover, while the NPD contains information about young people’s educational attainments and transitions, it contains nothing on attitudes, aspirations and decision-making in relation to education.
A second type of data resource is the prospective longitudinal social survey which collects much richer data on young people’s circumstances and life outcomes. A key prospective longitudinal study is the Next Steps sur-vey of young people in England which sampled 16,122 young people aged 13–14 in England in 2004 and tracked them annually until age 19–20 with a further survey at age 25–26. This cohort study was conducted by the DFE, England as an investigation of the underlying fac-tors that determine young people’s outcomes in life af-ter post-compulsory stage in education. The Next Steps study measured the educational aspirations, achieve-ments and choices of young people during their final years of secondary schooling and documented various life-course outcomes including access to higher educa-tion and transieduca-tions into the labour market. This study is an important data resource that collected detailed in-formation on young people’s lives at home and at school. There are rich details on young people’s socioeconomic circumstances including information on parents’ educa-tion levels, job statuses, incomes, and aspiraeduca-tions in re-lation to their children’s education. On the face of it, the richness of prospective longitudinal studies like Next Steps make them an especially valuable resource for studying the determinants of access to higher education. The true value of this data source, however, depends heavily on the representativeness of the analytic sam-ple, which is of course likely to be compromised by trivial amounts of missing data resulting from item non-response and sample attrition over time.
In this article we examine empirically the relative merits and demerits of administrative data from the NPD and longitudinal survey data from Next Steps, and we consider whether the demerits of each can be
counter-balanced by the merits of the other. Helpfully, the two datasets are linked by the UK Data Service (n.d.) and made available in the secure access environment for the purpose of research.
It is possible to link data from the NPD to data from the Next Steps survey at an individual level, and so we are able to compare these two datasets directly. More specifically, this article sets out to answer the follow-ing questions:
• To what extent does Next Steps suffer from miss-ing data due to item non-response and sample attrition?
• In what respects does missing data in Next Steps result in a biased sample?
• How well does the available socioeconomic back-ground data contained in Next Steps predict access to higher education, over and above the predictive power of the more limited information contained within the NPD?
• Can sample bias be ameliorated by linking Next Steps with census-style administrative data from the NPD?
3. Item Non-Response in Next Steps
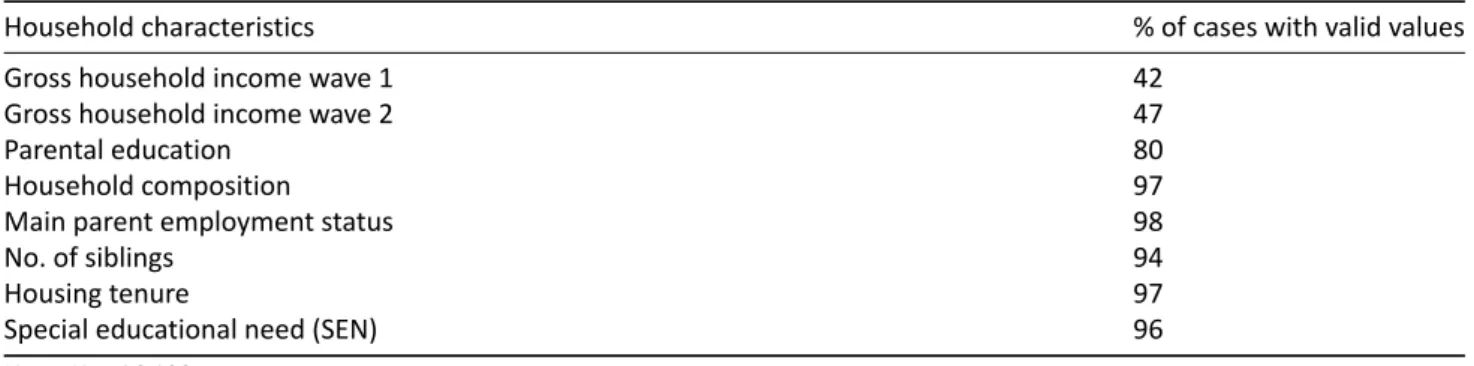
As outlined above, the Next Steps survey includes ques-tions relating to a range of measures of pupil social back-ground characteristic. However, some of these measures suffer from a high degree of item non-response (Table 1). Gross household income is actual income reported by the parents in two consecutive waves of the study, but is available for less than half of the total sample. This under-reporting of household income is one of the main chal-lenges for using this indicator for any subsequent anal-ysis or for comparison with other available measures of disadvantage. The following waves (3 and 4) collected in-formation on household income by using a household grid approach where income bands were presented to the households to identify the income band in which their gross annual income falls. However, this categorical indicator is less precise and complete than the actual in-come reported in the first two waves. It is not considered further in this article, but will be pursued in the next.
All misreporting and missing data creates a poten-tial for bias. Such data can never be assumed to be random in nature, and there is clear long-standing evi-dence that data is missing from a survey for a reason (Behaghel, Crepon, Gurgand, & Le Barbanchon, 2009; Hansen & Hurwitz, 1946; Sheikh & Mattingly, 1981). Any bias in the substantive results caused by missing data generally cannot be corrected by any technical means (Cuddeback, Wilson, Orme, & Combs-Orme, 2004). For example, weights can only be used post hoc to correct for variables for which all true population values are known, making weighting pointless, and weighting a sample in this way clearly cannot correct the values of other vari-ables for which the true population value is not known (Peress, 2010). If data from other variables in Next Steps were used to model the likely income for the missing 58% of cases, then any subsequent analyses would then be blighted. A correlation between any of those other vari-ables and income would be bogus, and at least partly based on the income values having been mostly created by that correlation in the first place. Generally, using ex-isting data to make up for data that does not exist exac-erbates the potential for bias.
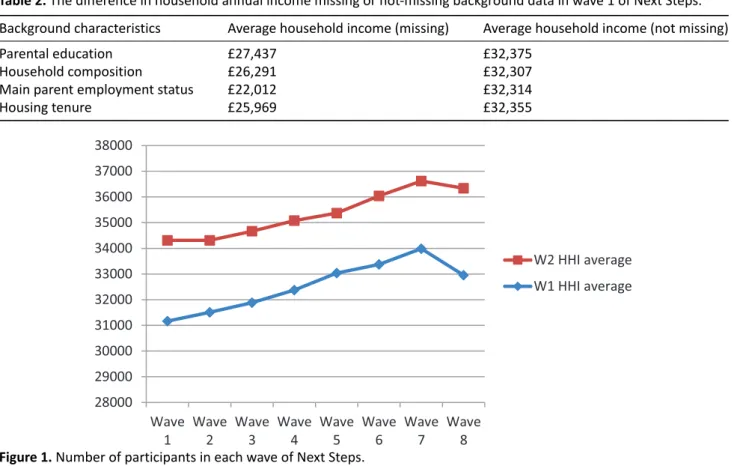
Therefore, we must assume that the 42% of values that Next Steps does contain are biased (and evidence in support of this appears below). The other SES and pupil background variables in Table 1 all have less missing data at the outset, but even for these there is evidence that this creates bias (Table 2). Where family income is known but parental education is not, cases missing parental edu-cation have a clearly lower average income. Missing data can never be assumed to be random. Here, removing the 20% of the cases which are missing parental education information would mean over-representing the advan-taged group. Simply ignoring or deleting the cases with missing data accepts that level of bias, and anyway leads to many fewer cases.
4. Sample Attrition in Next Steps
Unfortunately, this is not the end of the problem of missing data in NS. Each year after wave 1, more cases dropped out and/or were missing data (Figure 1). By the time of application and entry to university, 46% of the
ini-Table 1.Completeness of records in wave 1 of Next Steps.
Household characteristics % of cases with valid values
Gross household income wave 1 42
Gross household income wave 2 47
Parental education 80
Household composition 97
Main parent employment status 98
No. of siblings 94
Housing tenure 97
Special educational need (SEN) 96
Table 2.The difference in household annual income missing or not-missing background data in wave 1 of Next Steps. Background characteristics Average household income (missing) Average household income (not missing)
Parental education £27,437 £32,375
Household composition £26,291 £32,307
Main parent employment status £22,012 £32,314
Housing tenure £25,969 £32,355
Figure 1.Number of participants in each wave of Next Steps.
tial participants had dropped out, and the situation con-tinued to deteriorate with each wave.
On average, these dropouts were more likely to be from low-income households, and attained lower aver-age scores at secondary school. Again, there is never a reason to assume that dropout is random. All missing
data will tend to bias ensuing results. Figure 2 shows the average incomes reported in waves 1 and 2 but averaged again for successive years for only those still participating in the study. It looks as though the average income has in-creased every year simply because the high-income par-ticipants in waves 1 and 2 were more likely to remain in
Wave 1 Age 13–14 Wave 2 Age 14–15 Wave 3 Age 15–16 Wave 4 Age 16–17 Wave 5 Age 17–18 Wave 6 Age 18–19 Wave 7 Age 19–20 Wave 8 Age 25–26 Figure 2.How average of initially-reported income changes with dropout.
the study. Some earlier participants who had dropped out were re-recruited in wave 8 via financial incentives.
Another consequence of participants dropping out over time, is that Next Steps only has valid data on the higher education status at age 19 of 54% of the cases. This is likely to greatly over-estimate the proportion and income of higher education students.
5. The NPD Data
The NPD is national administrative data in England, offi-cially required information from all state-funded schools by the Department for Education (DFE). It contains de-tails of pupils’ attainment at school, as well as key indica-tors of background characteristics and possible disadvan-tage. But these key indicators are more complete, veri-fied and reliable than those in a survey like the Next Steps. One such indicator is eligibility for FSM. The identification of FSM-eligible pupils is based on clear legal criteria de-fined by the DFE—such as coming from families in receipt of state support in the form of benefits, allowances and tax credits due to annual gross income below a threshold of £16,190 in 2017–2018 (for the latest details on chil-dren’s FSM eligibility criteria see DFE, 2018a).The equiv-alent figure for 2004, when Next Steps wave 1 was sur-veyed, was £13,480 (Hobbs & Vignoles, 2010).
Some studies have criticised this measure because it misses out some families who ought to be eligible but do not apply or are missing appropriate documentation (Iniesta-Martinez & Evans, 2012; Storey & Chamberlin, 2001), and does not fully capture poverty in a variety of dimensions such as fluctuation in the economic cycles and period of recessions, and long-term poverty (Gorard & Siddiqui, 2018). Despite these limitations FSM is the key indicator and a context within which the academic
performance of state-maintained schools and pupils is judged (DFE, 2018b), intervention targets are set, and evaluation outcomes of programmes and policies are demonstrated (The Education Endowment Foundation, 2017). FSM is imperfect but currently the best available indicator in comparison to the alternatives which have additional problems other than missing data such as based on sample, aggregated socioeconomic measures and dependent on multiple definitions (Taylor, 2018).
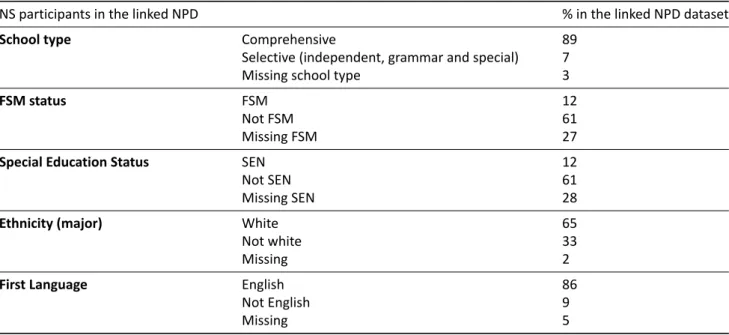
In the NPD, around 4% of cases in state maintained schools are missing data on FSM-eligibility and a further 6% to 7% are in private schools not completing this sec-tion of NPD (Gorard, 2012a). However, when the 2004 NPD dataset is individually linked to wave 1 of Next Steps, around 27% of cases are missing FSM-eligibility data (and 28% missing SEN data, and the same occurs with other variables). This is largely because a pupil’s status on FSM and SEN is classed as highly sensitive information, there-fore the data linking policy seeks participants’ consent. This exacerbates the situation of data already missing in one or other the linked datasets. Missing FSM and SEN as available in the linked dataset does not necessarily mean that this information is missing in the main NPD as well, just that it cannot be linked.
The NPD has been linked with Next Steps for the sam-ple achieved in the first wave of the study. This means NPD information was linked for only those participants who consented to be included in the study in wave 1. The linked NPD data is for the year 2004 which is when the first Next Steps data sweep was conducted. A sam-ple boost of 600 young peosam-ple was introduced at wave 4 in the year 2007 and the NPD information is missing for these cases, and so is ignored for the rest of this paper. Table 3 shows that data is missing particularly for FSM and SEN.
Table 3.Percentage of cases with complete and missing data for key variables in the linked dataset.
NS participants in the linked NPD % in the linked NPD dataset
School type Comprehensive 89
Selective (independent, grammar and special) 7
Missing school type 3
FSM status FSM 12
Not FSM 61
Missing FSM 27
Special Education Status SEN 12
Not SEN 61
Missing SEN 28
Ethnicity (major) White 65
Not white 33
Missing 2
First Language English 86
Not English 9
6. Comparing Household Income and FSM in the Linked Next Steps–NPD Dataset
In order to reduce missing data and cases, we have com-bined the data on income from waves 1 and 2. If the income data is missing for wave 1 we have used the re-ported income in wave 2. While this maintains as many cases as possible, this may further compromise the reli-ability of household income indicator because there are differences in the reported income for two consecutive years of data sweeps, where available. After combining the income data from waves 1 and 2, the remaining num-ber of cases missing gross household incomes was com-pared across FSM categories (Table 4). Around 60% of the cases missing gross household income data have the FSM status available, while 40% have neither household income nor FSM status for the year 2004.
Pupils with a family income below £13,480 ought to be eligible for FSM. Now using only those cases with val-ues for both, Table 5 compares FSM status and income. Around 73% of pupils below the income threshold of £13,480 are labelled as in receipt of FSM in the NPD. And around 79% are identified as not FSM with an income in excess of £13,480. These are all sensible figures in accord with the idea that FSM is for families with low incomes. Some participants could have misreported their incomes somewhat and this can explain some of the 21% with higher incomes considered FSM-eligible and vice versa. Or these differences could be due to genuine changes be-tween the time at which FSM was recorded for the NPD and income surveyed for NS.
The differences mentioned explain the way socioeco-nomic poverty is indicated in the form of different indica-tors and the linking the two indicindica-tors might not perfectly match and show exactly the same patterns of
disadvan-taged characteristics. This also raises the issues of select-ing indicators that accurately target the disadvantaged for widening access initiatives.
7. Entry into Higher Education at Age 19
Wave 7 of Next Steps provides information on whether young people have entered university or alternate higher education or not at age 18–20. The response rate by this phase is below 53% of the initial sample. Table 6 shows that on average 52% of the young people enter higher education by age 20, which is more than happened in that age cohort nationally, suggesting that the missing cases have biased the sample towards the more qualified. Table 6 shows the average household income differences in the three categories for those who stayed in the study until age 20. It also shows how much more the family in-come was in the homes of young people proceeding to HE. This is more in line with national figures (Gorard et al., 2017).
Of the 6,284 cases from the original wave 1 stayed in the study at age 19, 4,306 have unknown FSM status, and 1,978 have unknown higher education status. This illustrates how poor quality Next Steps and even linked Next Steps–NPD data is for analysis of higher education entry patterns using background and traditional data.
The one main advantage of the smaller, weaker Next Steps than the NPD is that it contains additional informa-tion such as the variables on aspirainforma-tion for higher edu-cation. These could be important predictors (Croll, 2010; see also, Gorard, 2012b). Whether students aspired to admission in university was collected in the initial waves when the drop-out was less of a problem than for higher education entry itself. However, by wave 7, only 46% of those remained to report if they achieved admission in
Table 4.Cases missing income and FSM data in linked dataset.
Missing gross household income % indicated in the NPD status
FSM 24
Not FSM 35
Missing FSM 40
Note: N missing=6,422.
Table 5.Comparison of FSM status and household income in linked dataset.
FSM Not FSM Total N
Household income≥£13,480 73% 27% 411
Household income≥£13,480 21% 79% 7571
Table 6.Average household income and higher education admission status.
At age 19 in higher education and not Average household income Number of young people
Missing information £35,089 5,963
In higher education £40,294 3,100
higher education or not. Leaving these cautions aside, there is a relatively weak link between aspirations at age 13 and actual higher education entry by age 19 (Table 7). The vast majority of young people said that they were likely to enter higher education and 62% of these did so. Of the minority who said that university was not likely, 80% did not enter by age 19.
The research implications of the findings so far are that the Next Steps longitudinal survey-based study is promising for understanding life trajectories and out-comes, but that dropout and missing data weakens the reliability of results perhaps to such an extent that the data are effectively useless.
8. How Good Is the Linked Dataset at Predicting University Entrance?
In order to assess the usefulness of the linked dataset with additional variables to the NPD, such as aspirations, a binary logistic regression model is presented in which getting admitted to university or not is the outcome. The selected explanatory variables from the linked NPD-NS dataset are introduced in two separate steps. This analy-sis tries to include the full sample of young people for whom the information was collected in wave 1. As ex-plained so far, simply deleting all cases with any miss-ing values leads to almost no cases. Where categorical variables have missing data, this is retained as a sepa-rate ‘missing’ category. Missing data for all key variables is linked to negative outcomes (not entering university here). Missing data is important and must be respected. Of course, where the outcome variable is not known the cases cannot be included.
Of the cases retained, 52% attended higher educa-tion and so this is the base figure for the model in Table 8. Adding data from the NPD raises the predictabil-ity of HE entry to 73%, and adding the extra Next Steps variables raises it a further 3%. FSM and SEN status, coupled with prior attainment are the key predictors. These are the ones that policy and practice should fo-cus on. The weaker data on family income, parental
ed-ucation, household structure and aspirations add little more (as also found for national linked NPD and Higher Education Statistical Agency [HESA] datasets by Gorard et al., 2017).
This is a relatively poor model, and a stronger pre-dictive model for entry in higher education can be made with the full NPD data alone, with the best single pre-dictor being prior attainment. Gorard (2018) presents a simple regression model with near 80% success in pre-dicting entry in higher education using prior attainment and a few key indicators from NPD, and using the full age cohorts of 600,000 young people in England with very little missing data. Therefore, the linked dataset model is probably not worth investigating further for research purposes, despite the additional or alternative variables.
Despite having the potential for linking pupils be-tween Next Steps and the NPD the limitations of each dataset cannot compensate for the other. Next Steps captures a more detailed set of information on young people’s life but it is far from complete in terms of in-formation in each category. The NPD does not capture so many details about pupils but it is more complete than Next Steps and highly reliable as the information recorded has been validated against well-defined mea-sures. The NPD does not have in-depth information on pupils which seems highly correlated with life-long out-comes of young people. However, just relying on the in-formation available from the linked NPD we can success-fully identify the most disadvantaged groups for whom overcoming the barriers in learning and achievement is the main challenge.
The indicators such as household income, parental education, household composition and house tenure are relevant to educational outcomes. However, the main challenges of using these indicators are lack of defini-tions, missing data, and high level of reliance on respon-dents’ self-reporting. It is better to use NPD data and map pupil trajectories from the moment they enter school and, if desired, link these data to HESA and University and College Admissions Services [UCAS] records. Sample surveys such as Next Steps offer very little in comparison.
Table 7.Link between higher education aspirations at age 13 and higher education admission outcome at age 19. Aspirations for higher In higher education Not in higher education Number of young
education at age 13 at age 19 % at age 19 % people
Likely to get admission 62 38 6,064
Not likely to get admission 20 80 883
Note: N=6,947.
Table 8.Summary of correctness of prediction of higher education entry using Next Steps–NPD data.
Main outcome At age 19 in higher education or not
Base 52%
Step 1 (linked NPD indicators) 73%
Step 2 (Next Steps indicators) 76%
9. Conclusions
Household income is highly sensitive information, and for many households it is not a clear composite figure. Self-reporting of gross household income has a large mar-gin of error and misreporting for reasons such as respon-dents’ unawareness of gross household income or sim-ply not being willing to share this sensitive information. Gross household income could be an important indica-tor of relative advantage in education, and be highly rep-resentative of respondents’ socioeconomic status. But according to our findings, it is not a strong predictor of pupils’ academic achievement given its lack of data qual-ity, especially once we know FSM status for only one year of students’ life in school.
Assessing the reliability of FSM as indicated in the NPD using self-reported gross household income from Next Steps is problematic. In Next Steps there is a high level of item-nonresponse for gross household income and our findings have clearly shown that item non-response is not random in Next Steps. Income in Next Steps therefore cannot be considered a reliable indica-tor of FSM assessment in the NPD. In the linked NPD and Next Steps there is some missing FSM status informa-tion, but our findings have shown that this missing data does not particularly affect the predictions of a regres-sion model. FSM is more complete and accurate than the self-reported gross household income, and so should be a preferred in practice.
Parental income is not easily available to researchers from any source, and the information is highly de-pendent on respondents’ self-reports. This information could be important and highly correlated with young peo-ple’s higher education outcomes therefore it has poten-tial to be captured administratively. However, other than permitting researchers routine access to the UK Govern-ment departGovern-ment responsible for the collection of taxes, the payment of some forms of state support and the ad-ministration of other regulatory regimes including the na-tional minimum wage records. There does not seem to be source that will not repeat the challenges of misre-porting or non-response in Next Steps. There could be even more challenges in accessing parental qualifications or education because there is no clear definition of this characteristic, unlike with FSM eligibility.
The findings show that household composition is rel-evant to the secondary school academic outcomes and it has less missing data than gross household income. Schools are more easily aware of pupils’ family compo-sition than parental education or income because family composition is related to issues concerning pupils’ safety, wellbeing, attendance, and learning. There are clear def-initions of family characteristics, and schools could accu-rately register and update this information in the annual census to obtain a more complete picture.
Administrative records from the NPD are generally robust, complete and longitudinal in tracing the spe-cific characteristics of young people (Gorard, 2018). The
somewhat limited indicators of disadvantage available in the administrative records can predict young people’s academic outcomes to a great extent. However, finer grained details could enrich research findings and be rele-vant in understanding the characteristics of poverty and developing targeted interventions. Therefore, although sample-based longitudinal studies such as Next Steps may be of little help on their own (except insofar as they allow us to link aspirations and academic outcomes, for example), a promising way forward in increasing our un-derstanding of the characteristics of disadvantage could be a better policy of data linking between longitudinal studies and available administrative datasets including the NPD, HESA or UCAS data. Whatever route is followed, much more attention needs to be given to missing data at all stages than is happening at present. All missing data is a source of potential bias and can therefore produce mis-leading results. Replacing missing data using data that is not missing is likely to increase the bias.
Acknowledgements
This work was funded by the Economic and Social Research Council, grant numbers ES/N012046/1 and ES/N01166X/1.
References
Adnett, N., McCaig, C., Slack, K., & Bowers-Brown, T. (2011). Achieving ‘transparency, consistency and fairness’ in English higher education admissions: Progress since Schwartz?Higher Education Quarterly, 65(1), 12–33.
Arum, R., Gamoran, A., & Shavit, Y. (2007). More inclu-sion than diverinclu-sion: Expaninclu-sion, differentiation and market structures in higher education. In Y. Shavit, R. Arum, & A. Gamoran (Eds.),Stratification in higher education: A contemporary study (pp. 1–35). Stan-ford, CA: Stanford University Press.
Behaghel, L., Crepon, B., Gurgand, M., & Le Barban-chon, T. (2009). Sample attrition bias in random-ized surveys: A tale of two surveys (IZA Discussion Paper 4162). Bonn: IZA. Retrieve from ftp.iza.org/ dp4162.pdf
BIS. (2013). Widening participation in higher educa-tion. London: Department for Business Innovation and Skills. Retrieved from www.gov.uk/government/ uploads/system/uploads/attachment_data/file/2263 57/13-P155-widening-part-HE-2013.pdf
Boliver, V. (2011). Expansion, differentiation, and the per-sistence of social class inequalities in British higher education.Higher Education,6(3), 229–242. Boliver, V. (2015). Are there distinctive clusters of higher
and lower status universities in the UK? Oxford Re-view of Education,41(5), 608–627.
Broecke, S. (2015). University rankings: Do they matter in the UK?Education Economics,23(2), 137–161. Chowdry, H., Crawford, C., Dearden, L., Joyce, R.,
Sibi-eta, L., Sylva, K., & Washbrook, E. (2010). Poorer children’s educational attainment: How important are attitudes and behaviour?York: Joseph Rowntree Foundation.
Chowdry, H., Crawford, C., Dearden, L., Goodman, A., & Vignoles, A. (2013). Widening participation in higher education: Analysis using linked data.Journal of the Royal Statistical Society,176, 431–457.
Connor, H., Dewson, S., Tyers, C., Eccles, J., Regan, J., & Aston, J. (2001).Social class and higher education: Is-sues affecting decisions on participation by lower so-cial class groups(Report 267). Brighton: Institute for Employment Studies.
Crawford, C., Gregg, P., Macmillan, L., Vignoles, A., & Wyness, G. (2016). Higher education, career oppor-tunities, and intergenerational inequality.Oxford Re-view of Economic Policy,32(4), 553–575.
Croll, P. (2010). Educational participation post-16: A lon-gitudinal analysis of intentions and outcomes.British Journal of Educational Studies,57(4), 400–416. Cuddeback, G., Wilson, E., Orme, J., & Combs-Orme,
T. (2004). Detecting and statistically correcting sam-ple selection bias.Journal of Social Service Research, 30(3), 19–30.
Department for Education. (2017). Participation rates in higher education: Academic years 2006–2007 and 2015–2016. London: Department for Education. Retrieved from assets.publishing.service.gov.uk/ government/uploads/system/uploads/attachment_ data/file/648165/HEIPR_PUBLICATION_2015-16.pdf Department for Education. (2018a). Apply for free school meal. Gov.Uk. Retreived from www.gov.uk/apply-free-school-meals
Department for Education (2018b). Outcomes for pupils eligible for free school meals and identified with special educational needs. Ad-hoc statistics. London: Department for Education. Retrieved from assets. publishing.service.gov.uk/government/uploads/sys tem/uploads/attachment_data/file/730977/FSM_and _SEND_outcomes-statistics.pdf
Gorard, S. (2012a). Who is eligible for free school meals? Characterising free school meals as a measure of dis-advantage in England.British Educational Research Journal,38(6), 1003–1017.
Gorard, S. (2012b). Querying the causal role of attitudes in educational attainment.International Scholarly Re-search Notices, 2012. Advanced online publication. http://dx.doi.org/10.5402/2012/501589
Gorard, S. (2013). An argument concerning overcom-ing inequalities in Higher Education. In N. Murray & C. Klinger (Eds.),Aspirations, access and attainment in widening participation: International perspectives and an agenda for change (pp. 150–157). London: Routledge.
Gorard, S. (2018).Education policy: Evidence of equity and effectiveness. Bristol: Policy Press.
Gorard, S., Adnett, N., May, H., Slack, K., Smith, E., & Thomas, L. (2007).Overcoming barriers to HE.
Stoke-on-Trent: Trentham Books.
Gorard, S., & Siddiqui, N. (2018). Grammar schools in Eng-land: A new analysis of social segregation and aca-demic outcomes.British Journal of Sociology of Edu-cation. Advanced online publiEdu-cation. https://doi.org/ 10.1080/01425692.2018.1443432
Gorard, S., Siddiqui, N., & Boliver, V. (2017). An analy-sis of school-based contextual indicators for possible use in widening participation.Higher Education Stud-ies,7(2), 101–118.
Hansen, M., & Hurwitz, W. (1946). The problem of non-response in sample surveys.Journal of the American Statistical Association,41, 517–529.
Harrison, N. (2011). Have the changes introduced by the 2004 Higher Education Act made higher education admissions in England wider and fairer?Journal of Ed-ucation Policy,26(3), 449–468.
HEFCE. (2017). Guide to funding 2017–18 (April Re-port 2017/04).Higher Education Funding Council. Re-trieved from www.hefce.ac.uk
Hobbs, G., & Vignoles, A. (2010). Is children’s free school meal ‘eligibility’ a good proxy for family income? British Educational Research Journal,36(4), 673–690. Iniesta-Martinez, S., & Evans, H. (2012).Pupils not claim-ing free school meals(Research Report DFE-RR235). London: Department of Education. Retrieved from dera.ioe.ac.uk/16039/1/DFE-RR235.pdf
Jerrim, J., & Vignoles, A. (2015). University access for dis-advantaged children: A comparison across countries. Higher Education,70(6), 903–921.
Marcenaro-Gutierrez, O., Galindo-Rueda, F., & Vignoles, A. (2007). Who actually goes to university?Empirical Economics,32, 333.
Marginson, S. (2017). Higher education, economic in-equality and social mobility: Implications for emerg-ing East Asia. International Journal of Educational Development. Advanced online publication. http:// dx.doi.org/10.1016/j.ijedudev.2017.03.002
Peress, M. (2010). Correcting for survey nonresponse using variable response propensity. Journal of the American Statistical Association, 105(492), 1418–1430.
Sheikh, K., & Mattingly, S. (1981). Investigating nonre-sponse bias in mail surveys.Journal of Epidemiology and Community Health,35, 293–296.
Smith, E., & White, P. (2011). Who is studying sci-ence? The impact of widening participation policies on the social composition of UK undergraduate sci-ence programmes.Journal of Education Policy,26(5), 677–699.
Storey, P., & Chamberlin, R. (2001).Improving the take up of free school meals (Research Report RR270). London: Department for Education. Retrieved from dera.ioe.ac.uk/4657/1/RR270.pdf
Taylor, C. (2018). The reliability of free school meal eligi-bility as a measure of socio-economic disadvantage: Evidence from the millennium cohort study in Wales. British Journal of Educational Studies,66(1), 29–51.
http://dx.doi.org/10.1080/00071005.2017.1330464 The Education Endowment Foundation. (2017). The attainment gap. London: The Education Endowment Foundation. Retrieved from educationendowment foundation.org.uk/public/files/Annual_Reports/EEF_ Attainment_Gap_Report_2018.pdf
Triventi, M. (2011). Stratification in higher education and its relationship with social inequality: A comparative study of 11 European countries.European Sociologi-cal Review,29(3), 489–502.
UK Data Service. (n.d.). Next Steps (also known as the lon-gitudinal study of young people in England (LSYPE1).
UK Data Service. Retrieved from discover.ukdata service.ac.uk/series/?sn=2000030
Younger, K., Gascoine, L., Menzies, V., & Torgerson, C. (2017). A systematic review of evidence on the effec-tiveness of interventions and strategies for widening participation in higher education.Journal of Further and Higher Education. Advanced online publication. https://doi.org/10.1080/0309877X.2017.1404558 Zimdars, A., Sullivan, A., & Heath, A. (2009). Elite higher
education admissions in the arts and sciences: Is cul-tural capital the key?Sociology,43(4), 648–666.
About the Authors
Nadia Siddiquiis Assistant Professor at the School of Education from Durham University. Her research is concerned with improving the quality of social science research, and passionate about the role of ed-ucation in shaping a fairer society. Her research explores poverty and inequalities through population data sets and large scale surveys. She has conducted educational evaluations of programmes deter-mining the impact of innovative approaches which can narrow the attainment gap for disadvantaged pupils. Her social media presence is on Twitter @nadiasiddiqui22
Vikki Boliveris Professor of Sociology, Durham University. She has expertise in researching access to and achievement in higher education and the graduate labour market. She is an experienced analyst of complex statistical datasets. Professor Boliver’s research focuses on understanding and addressing socioeconomic and ethnic inequalities in patterns of application and admission to UK universities, es-pecially the UK’s most prestigious and academically selective institutions. Her academic work can be followed on Twitter @VikkiBoliver
Stephen Gorardis Professor of Education and Public Policy and Director of the Evidence Centre for Education, Durham University. His work concerns the robust evaluation of education as a lifelong pro-cess, focused on issues of equity, especially in relation to indicators of potential disadvantage. He is author of around 30 books and over 1,000 other publications, and has been a grant-holder for external funding of over £2m. His academic work can be followed on Twitter @SGorard