http://eprints.whiterose.ac.uk/100375/ Version: Accepted Version
Article:
Chatterjee, A, Lagisz, M, Rodger, EJ et al. (8 more authors) (2016) Sex differences in DNA methylation and expression in zebrafish brain: a test of an extended ‘male sex drive’ hypothesis. Gene, 590 (2). pp. 307-316. ISSN 0378-1119
https://doi.org/10.1016/j.gene.2016.05.042
© 2016, Elsevier. Licensed under the Creative Commons Attribution-NonCommercial-NoDerivatives 4.0 International http://creativecommons.org/licenses/by-nc-nd/4.0/
[email protected] Reuse
Unless indicated otherwise, fulltext items are protected by copyright with all rights reserved. The copyright exception in section 29 of the Copyright, Designs and Patents Act 1988 allows the making of a single copy solely for the purpose of non-commercial research or private study within the limits of fair dealing. The publisher or other rights-holder may allow further reproduction and re-use of this version - refer to the White Rose Research Online record for this item. Where records identify the publisher as the copyright holder, users can verify any specific terms of use on the publisher’s website.
Takedown
If you consider content in White Rose Research Online to be in breach of UK law, please notify us by
Aniruddha Chatterjee, Malgorzata Lagisz, Euan J. Rodger, Li Zhen, Pe-ter A. Stockwell, Elizabeth J. Duncan, Julia A. Horsfield, Justin Jeyakani, Sinnakaruppan Mathavan, Yuichi Ozaki, Shinichi Nakagawa
PII: S0378-1119(16)30437-1 DOI: doi:10.1016/j.gene.2016.05.042 Reference: GENE 41367
To appear in: Gene
Received date: 17 March 2016 Revised date: 20 May 2016 Accepted date: 29 May 2016
Please cite this article as: Chatterjee, Aniruddha, Lagisz, Malgorzata, Rodger, Euan J., Zhen, Li, Stockwell, Peter A., Duncan, Elizabeth J., Horsfield, Julia A., Jeyakani, Justin, Mathavan, Sinnakaruppan, Ozaki, Yuichi, Nakagawa, Shinichi, Sex differences in DNA methylation and expression in zebrafish brain: a test of an extended ‘male sex drive’ hypothesis,Gene(2016), doi: 10.1016/j.gene.2016.05.042
ACCEPTED MANUSCRIPT
Sex differences in DNA methylation and expression in
zebrafish brain: a test of
an extended ‘
male sex drive
’
hypothesis
Aniruddha Chatterjee1,2*, Malgorzata Lagisz3,4, Euan J Rodger1, Li Zhen5, Peter
A Stockwell6, Elizabeth J Duncan6, Julia A Horsfield1,2, Justin Jeyakani5,
Sinnakaruppan Mathavan5, Yuichi Ozaki7, Shinichi Nakagawa3,4,8*
1
Department of Pathology, Dunedin School of Medicine, University of Otago, 270
Great King Street, Dunedin 9054, New Zealand. 2 Maurice Wilkins Centre for
Molecular Biodiscovery, Level 2, 3A Symonds Street, Auckland, New Zealand.
3
Department of Zoology, University of Otago, 340 Great King Street, Dunedin 9054,
New Zealand. 4 Evolution & Ecology Research Centre and School of Biological,
Earth and Environmental Sciences, University of New South Wales, Kensington
2052, Sydney, NSW, Australia. 5LKC School of Medicine, Nanyang Technological
University and Human Genetics division, Genome Institute of Singapore, Singapore. 6
Department of Biochemistry, University of Otago, 710 Cumberland Street, Dunedin
9054, New Zealand. 7 Department of Biology, Keio University, 4-1-1 Hiyoshi,
Kohoku-ku, Yokohama, Kanagawa 223-8521, Japan, 8 Diabetes and Metabolism
Division, Garvan Institute of Medical Research, Darlinghurst NSW 2010, Australia.
* To whom correspondence should be addressed: Aniruddha Chatterjee: 270 Great
King Street, P O Box 56, Dunedin 9054, New Zealand, Tel: +64-0210701558, Email:
[email protected]. Or Shinichi Nakagawa: Evolution & Ecology
ACCEPTED MANUSCRIPT
University of New South Wales, Kensington 2052, Sydney, NSW, Australia. Tel:
61-2-9385-9138, Email: [email protected]
Aniruddha Chatterjee: [email protected]
Malgorzata Lagisz: [email protected]
Euan J. Rodger: [email protected]
Li Zhen: [email protected]
Peter A. Stockwell: [email protected]
Elizabeth J. Duncan: [email protected]
Julia A Horsfield: [email protected]
Justin Jeyakani: [email protected]
Sinnakaruppan Mathavan: [email protected]
Yuichi Ozaki: [email protected]
ACCEPTED MANUSCRIPT
ABSTRACT
The sex drive hypothesis predicts that stronger selection on male traits has resulted in
masculinization of the genome. Here we test whether such masculinizing effects can
be detected at the level of the transcriptome and methylome in the adult zebrafish
brain.
Although methylation is globally similar, we identified 914 specific differentially
methylated CpGs (DMCs) between males and females (435 were hypermethylated
and 479 were hypomethylated in males compared to females). These DMCs were
prevalent in gene body, intergenic regions and CpG island shores. We also discovered
15 distinct CpG clusters with striking sex-specific DNA methylation differences. In
contrast, at transcriptome level, more female-biased genes than male-biased genes
were expressed, giving little support for the male sex drive hypothesis.
Our study provides genome-wide methylome and transcriptome assessment and sheds
light on sex-specific epigenetic patterns and in zebrafish for the first time.
Keywords: zebrafish; sexual dimorphism, male sex drive, masculinization, brain,
ACCEPTED MANUSCRIPT
Background
Phenotypic differences between the two sexes of a species are referred to as sexual
dimorphism. Striking morphological differences between large unsightly females and
minute parasitic males in anglerfish are one of many spectacular examples of such
sexual dimorphism [1]. Sexual dimorphism manifests not only in morphological
traits, but also in physiological and behavioural traits. In the organisms that do not
have sex chromosomes, males and females are derived from an identical or nearly
identical genome. Sex-specific gene expression (i.e., expression exclusively in one
sex) or, more commonly, sex-biased gene expression (i.e., expression predominantly
in one sex), is one of the main proximate causes of phenotypic differences between
the sexes in these organisms. [2, 3].
The most obvious phenotypic difference between the sexes is the development of the
female or male gonads. Not surprisingly, female and male gonads usually differ
remarkably in the sets of highly expressed genes [4-7]. Sex-biased gene expression,
although less pronounced than in the gonads, has been also found in many somatic
tissues, such as liver, spleen, muscles and brain [4, 8, 9]. Brain is the second most
sexually dimorphic organ after gonads. The sexually dimorphic expression in the
brain is of particular interest, because it is likely to underpin behavioural differences
between the sexes [10].
Males of many species exhibit a broad spectrum of sex-specific behaviours (e.g.
courtship, male contest) and other phenotypic traits (e.g. ornaments, weaponry)
contributing to their reproductive success. These traits can affect outcomes of
male-male competition and mate choice, and thus are usually under strong sexual selection
ACCEPTED MANUSCRIPT
genomes that progressively accumulate genetic innovations that affect male traits at a
rate faster than for female-specific traits or sex-neutral traits. This effect was termed
“male sex drive” [12]. Male sex drive can lead to genome masculinization, which can
be manifested in two main ways: 1) the existence of larger number of genes in the
genome that have male-specific effects than genes that have female-specific effects,
and 2) faster rates of evolution of male-biased genes than female-biased and
sex-unbiased genes, leading to larger divergence of male-biased genes at the levels of
DNA, RNA and protein [3, 13]. A masuculinized transcriptome can be, therefore,
characterized by a higher proportion of male-biased genes than that of female-biased
genes.
Since tissue-specific transcription of genes is regulated, at least in part, by DNA
methylation [14, 15], one might also expect sexually dimorphic DNA methylation to
be observable in body tissues. Indeed, sex-biased DNA methylation was reported for
saliva, blood and brain samples of humans [16-19]. Sex-specific methylation patterns
have been also observed in the brains of mice [20] and chicken [21]. A recent study
on mice revealed that DNA methylation plays a key role in suppressing
masculinization in the developing brain and allows the brain to preserve its original
feminized form in female animals [22]. These studies suggest that the methylation
process contributes to the development of sexual dimorphism. However, there is still
limited knowledge of the interplay between biased DNA methylation and
sex-biased gene expression [23]. In general, at least in vertebrates, high levels of DNA
methylation in the promoter regions, are linked with lower levels of gene transcription
[24]. Accordingly, the male sex drive hypothesis can be extended to include the
methylome, generating two predictions: 1) male-biased gene expression is associated
ACCEPTED MANUSCRIPT
expressed in the males will have lower methylation levels in males than in females
(i.e., are hypomethylated in males).
In this study, we use zebrafish brains to address the male sex drive hypothesis at both
methylome and transcriptome levels. First, to determine global DNA methylation
patterns of male and female brains we performed reduced representation bisulfite
sequencing (RRBS). The characteristics of genome-wide methylation of the zebrafish
brains, without differentiating between male and female samples, are presented in [25,
26]. In summary, the zebrafish RRBS genome contains higher levels of CpG
methylation than mammalian RRBS genome and that high level of global CpG
methylation is not exclusive to the zebrafish brain but is also found in other tissues
(such as liver). Furthermore, consistent with recent base-resolution studies in
zebrafish we found low levels (< 3.0%) of non-CpG methylation in zebrafish brain
[25]. Further, the pooled samples (Male1 vs. Male2 and Female1 vs. Female2)
showed high positive correlation on common CpG sites (covered by 10 or more
sequenced reads) suggesting negligible variation between the pooled samples.
Globally, Male1, Male2, Female1 and Female2 showed CpG methylation of 75.0%,
71.6%, 69.4% and 70.0% respectively (as indicated by Bismark alignment [27]).
Further, the male and female methylomes also showed high positive correlation
(Pearson’s correlation coefficient r = 0.98) with each other [25]. Taken together, these
results indicate that, overall, the DNA methylation patterns between female and male
adult wild type zebrafish brains are very similar. However, some site-specific
ACCEPTED MANUSCRIPT
Next, we generated whole genome-expression profile and integrated this information
with the whole-genome scale methylome data to investigate the relationship between
differentially methylated sites and corresponding gene expression levels. Further, we
integrate data from previous studies to place our findings in broad context. We tested
whether male-enriched expression and male hypomethylation supports the male sex
drive hypothesis in zebrafish brains.
Results and discussion
Male and female brains show site-specific differential methylation
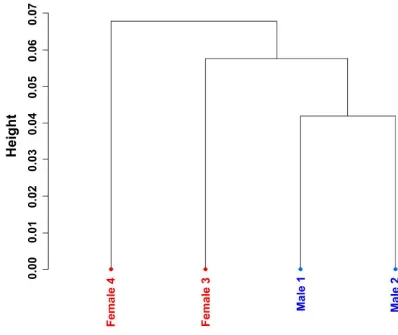
Although the global DNA methylation patterns of male and females were similar, the
hierarchical clustering of the male and female methylomes (on common CpGs with
high coverage) indicated the existence of some site-specific differences in
methylation (Figure 1). Therefore, we aimed to identify these differences. Differential
methylation analyses between male and female samples were performed on the
232581 common CpG sites (covered by 10 or more reads in all four RRBS libraries).
We identified 914 CpG sites that were significantly differentially methylated between
the male and female brains (with a cut-off q-value of < 0.01 after multiple test
correction and with stringent cut-off percent methylation difference of ≥ 25% for a
CpG site). These sites were termed differentially methylated CpG sites (DMCs)
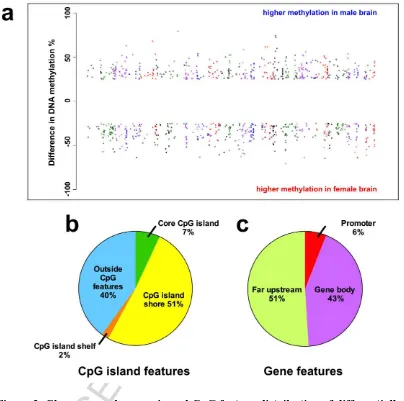
(Additional file 2). The DMCs did not show significant sex bias in terms of the
distribution of hypo and hypermethylated bases between sexes (Figure 2a): out of the
914 DMCs, 435 were hypermethylated and 479 were hypomethylated in males
compared to females. The similar numbers of hypo and hypermethylated sites in
ACCEPTED MANUSCRIPT
pattern was shaped by male sex drive, males should have many more hypomethylated
sites than females. However, there is a tendency in the expected direction; i.e., more
hypomethylated sites in males than females. The extent of the observed bias may be
influenced by the magnitude of sexual selection operating on males in this species.
Zebrafish males do not differ dramatically in their appearance from females and it has
been suggested that the opportunity for sexual selection could be weak in this species
[28, 29].
This is the first study addressing the differences in methylation patterns between the
sexes in zebrafish. Zebrafish do not have sex chromosomes (at least, in the laboratory
populations), and the allelic combinations of several loci dispersed throughout the
genome determine individual’s sex [30, 31]. Sex-biased DMCs have been reported in
other vertebrate species, such as mice and humans. However, in these species over
90% of differentially methylated sites reside on X chromosomes and are likely
associated with X chromosome dosage compensation mechanisms in females [32].
Even in birds, which have ZW sex determination system, sex-biased methylation of
gene promoter regions was also found on sex chromosomes, with male
hypermethylation prevalent on Z chromosome (birds do not have complete dosage
compensation, but have a male hypermethylated region on Z chromosome) [21].
Given this pattern, it may be more appropriate to compare sex-biased methylation on
zebrafish chromosomes to that observed on autosomal chromosomes in species with
dimorphic sex chromosomes.
The results of our study are concordant with those obtained for human saliva and
blood samples, where small differences in the same direction were reported. Namely,
ACCEPTED MANUSCRIPT
were hypermethylated in males, whereas in female saliva samples these numbers were
21 and 15 respectively [16]. However, other results in human methylation studies are
not consistent with these findings. For example, using blood samples, El-Maarri et al.
found higher average levels of methylation in males than in females [17], although the
difference was slight. Eckhardt et al., using 2,524 autosomal loci, could not detect any
statistical differences between male and female samples from 12 different tissues
[33]. Among the studies investigating human brain tissue, two showed more
hypermethylated autosomal sites in females than in males [18, 34], and two studies
reported equal proportion of the male hypo and hypermethylated autosomal DMCs
between sexes [35, 36].
The distribution of the DMCs in our study varied across chromosomes; for example,
chromosomes 18, 19 and 20 contained more hypermethylated DMCs (in males),
whereas chromosomes 2 and 4 had higher proportion of hypomethylated DMCs in
males (Supplementary Figures S1-S2 in Additional file 1). Heterogeneous distribution
on the chromosomes was also noted in a study on mice brain [22]. Higher prevalence
of sex-biased methylation sites on different chromosomes could be potentially linked
to sex-specific functions of the genes on these chromosomes. Alternatively, these
differences might be also due to the distribution of chromosome lengths, number of
genes per chromosome, or CpG content of chromosomes.
In our study, only 0.39% of CpG sites were identified as differentially methylated
(DMCs). Although this proportion is small, it is comparable to the results of some
other vertebrate studies, when only autosomal loci are taken into account. For
example, in a study on the fetal human brain methylome 1.3% of autosomal sites were
ACCEPTED MANUSCRIPT
cortex reported 0.15% of sites on autosomes to be differentially methylated [19]. In
contrast, Numata et al. found 5% of autosomal loci had significantly sex-biased
methylation levels in the human prefrontal cortex [18].
Majority of the DMCs reside in gene body, intergenic regions and CpG island
shores
We examined the relationship of the DMCs with CpG features to assess if they are
particularly enriched for a given feature. Only a small proportion (7%) of the DMCs
overlapped a core CpG island. Interestingly, 51% of the DMCs resided within CpG
island shore (defined as 2 Kb from either side of a CpG island core) and 40% were
outside any CpG feature (Figure 2a). Next, the relationship of DMCs with gene
elements was investigated. 51% of the DMCs were located in the intergenic regions
(> 5 Kb from start of a protein coding gene) and 43% were located in the gene bodies
(Figure 2c). Consistent with their low overlap with core CpG islands, only 6% of the
DMCs were in the promoter (defined as up to 5 Kb upstream from the start of the
gene) of protein-coding genes. The proportions of DMCs in the promoter and
intergenic regions is similar to the CpG distribution in zebrafish RRBS genome [25],
suggesting sex-specific DMCs are not preferentially enriched in these regions.
However, amongst the gene body DMCs, 69% mapped to intronic regions, but only
59% of CpGs in zebrafish are located in introns [25], indicating enrichment of
sex-specific DMCs in introns.
Our findings are generally concordant with the recently reported sex-specific DNA
methylation differences in mammalian brain [22]. Specifically, the majority of DMCs
were found in intergenic regions and gene introns and very few were located in CpG
ACCEPTED MANUSCRIPT
intriguing. Profiling CpG island methylation differences has been a major focus of
epigenetic studies for many years. CpG island shores were shown to be an important
element in regulating gene function. For example, in human colon cancer patients,
methylation at CpG island shores was highly variable, and more importantly,
differential methylation of CpG island shores was reported to be mainly
tissue-specific [37-39]. Therefore, it is plausible that CpG island shore methylation could
contribute to tissue-specific methylation patterns in zebrafish males and females.
Although DNA methylation is generally considered to suppress transcription [40], this
effect can vary depending on the genomic context, such as position in relation to
genes. High DNA methylation in the promoter region is known to generally block
transcription initiation or mark already silenced genes [41]. However, high level of
gene body methylation is thought to allow efficient transcriptional elongation and
repressive nonspecific intragenic transcription [42]. Methylation within the gene body
may influence multiple processes, such as silencing of transposable elements
embedded in gene body, transcript elongation, use of alternative intragenic promoters,
and alternative splicing. A study on multiple human neural tissues showed that
sex-biased splicing is more common than sex-sex-biased expression on the autosomes [43].
Therefore, qualitative difference in gene products, rather than sex-biased expression
levels, might be the key to sexual dimorphism in adult brains. Additionally,
differential methylation of intergenic regions could potentially play a role in the
control of gene expression, e.g. via cis-regulatory regions and enhancer regions [14,
24]. Taken together, the results of our study indicate that sex-biased methylation
could potentially affect brain function, and subsequently behaviour, by influencing
ACCEPTED MANUSCRIPT
There are many sex-biased differentially methylated genes
Next, we aimed to identify the key genes that were differentially methylated between
male and females. The 914 DMCs were found to be associated with 708 protein
coding genes (in Additional file 2); 346 genes were associated with hypermethylated
DMCs in male brains, whereas 400 genes were associated with hypomethylated
DMCs in male brains. Furthermore, 37 genes were associated with both hypo- and
hypermethylated DMCs (Supplementary Figure S3 in Additional file 1). We
generated separate lists of the DMCs that were far upstream from the gene (> 5 Kb
from transcription start site) and of the DMCs that were harboured within a gene
promoter (within 0 to 5Kb from the transcription start site) or within a gene body. We
found 467 DMCs (associated with 348 genes) that were upstream from the start of a
gene (78% of them showed > 20 Kb distance from the gene start). On the other hand,
we found 371 genes that contained DMCs in the promoter or gene body (in
Additional file 2). We identified 3 and 11 genes that contained multiple DMCs (≥ 3)
in the promoter and gene body, respectively and 20 genes that showed association
with multiple far upstream DMCs (≥ 3). Interestingly, the overlap of the promoter,
body and upstream DMCs-associated genes was negligible (Supplementary Figures
S4 – S5 in Additional file 1), suggesting that methylation change in male and female
zebrafish brains occurs at different elements for different classes of genes. Functional
gene enrichment analysis suggested that the male hypermethylated genes were
involved in neuron morphogenesis. On the other hand, the male hypomethylated
genes are associated with appendage morphogenesis and functions in extracellular
ACCEPTED MANUSCRIPT
Distinct CpG clusters contain consistent sex-specific DNA methylation
differences in zebrafish brain
We identified 15 small clusters of DMCs (spanning 8-370 bp, median length= 44 bp)
that showed sex-specific methylation differences (Table 1). These clusters contained
at least three independently identified DMCs and exhibited methylation change in the
same direction (i.e., consistently high or low methylation in males compared to
females). Although some of the CpGs within these DMCs clusters were not identified
as DMCs due to the stringent criteria used for differential methylation analysis, the
majority of these non-significant CpGs showed differences in DNA methylation
consistent with adjacent DMCs. Eight of these clusters reside far upstream from the
start of the gene, whereas six of them were either in an exon or intron of a
protein-coding gene (Table 1). Junb and mtdhb genes harboured DMCs clusters in their first
exon and were within 1 Kb from the start of the gene and fam150ba contained a DMC
cluster in its promoter. These results suggest that the consequences of these
methylation clusters could be genomic context dependent. When we examined the
CpG methylation patterns outside these clusters, we did not find significant
differences between male and female samples, demonstrating the discrete nature of
the clusters. Methylation pattern of the males and females in five clusters (that
contained 5 or more DMCs) are shown in Figure 3.
As described, the global distribution of DMCs did not show notable preference for
either male or female being hypo- or hypermethylated. However, in 10 out of the 15
identified DMC clusters where consistent methylation changes were observed, male
brain samples showed hypermethylation. This finding raises the possibility that
ACCEPTED MANUSCRIPT
prevalence of particular DMCs in male and female brains (Table 1 and Figure 3). In
the DMC cluster we see multiple adjacent CpG sites exhibits large methylation
changes in the same direction. This result suggests that these site-specific differences
are biologically determined rather than just stochastic variation.
Female brain shows higher expression in differentially expressed genes
compared to male brain
We performed whole genome transcriptome analysis (using RNA Sequencing) of the
adult male and female brains to compare their levels of gene expression. We obtained
190 million sequenced reads for both male and female brain transcriptome libraries
(each library contained pool of three fish). A consistent observation (at various
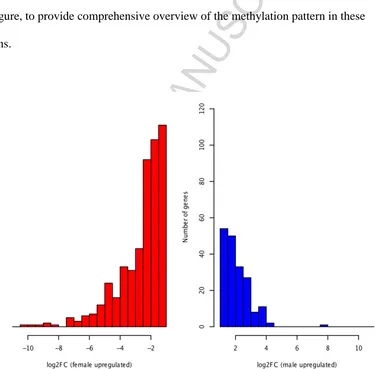
expression fold-change thresholds) was that the number of genes that were more
highly expressed in females was significantly greater than for males. With a cut-off
for fold-change of expression of log2 1.2, we found 492 genes that were significantly
regulated in female compared to male zebrafish brain and 186 genes that were
up-regulated in male (q ≤ 0.05) (Supplementary Table S1 in in Additional file 1). This
result indicates female bias in gene expression and is opposite to the prediction based
on male sex drive hypothesis. This result is consistent with some of the studies on
vertebrates. For example, Nätt et al. [21] reports more genes with female-biased
expression than with male-biased expression in brain samples from red jungle fowl
and domesticated chickens (25 vs. 7 and 14 vs. 5, respectively, autosomal
chromosomes only). However, a study on brains of two passerine species found
opposite pattern [44]. Nugent et al. [22] found an almost equal number of genes
ACCEPTED MANUSCRIPT
In our study we also observed higher fold change values in female-biased genes
(Figure 4 and Additional file 3), which is inconsistent with our predictions based on
the male sex drive hypothesis. According to male driver hypothesis, as a result of
higher selection pressure on male traits, male-biased genes should have more
pronounced changes in expression levels relative to female-biased genes. Again, the
pattern identified in our analysis might be due to comparable levels of sexual
selection acting on male and female traits in zebrafish.
Functional gene enrichment analysis suggested that the genes with male-biased
expression were mainly involved in sensory perception, functions of non-motile
cilium and DNA binding and transcription. On the other hand, the genes with
female-biased expression were more likely to be involved in regulation of different enzymatic
and biochemical activities of the cell, lipid transport and wound healing
(Supplementary Figure S8 in Additional file 1).
Comparison of results with other zebrafish studies shows no consistent pattern
of sex-biased transcription
Finally, we compared results of four other studies reporting gene expression from
female and male zebrafish brains (Table 2). Two of these studies found overall
female-biased expression and two found male-biased expression. We compared the
lists of sex-biased genes between our study and the other four studies, where
available, and found less than 1% overlap in gene identity (Supplementary Figure S6
in Additional file 1). The inconsistent findings of different studies may stem from the
differences in the technological platforms used (e.g. RNA-seq vs. microarray),
different sampling and pooling strategies, including strain and age of the fish used,
ACCEPTED MANUSCRIPT
significantly sex-biased genes. In addition, the zebrafish genome is variable between
strains at the base level [45], which could also account for the discrepancies.
Nevertheless, these contradictory published results, together with the findings of our
study, suggest minor or non-existent effects of male sex drive on gene expression
pattern in the zebrafish brain.
Only a small subset of differentially methylated genes correlates with expression
changes
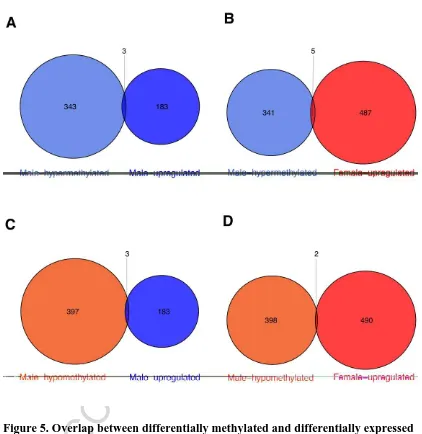
When we compared the lists of differentially expressed genes from our study with the
genes containing DMCs, only 8 of 346 male hypermethylated genes and 5 of 400
hypomethylated genes showed concomitant expression changes with differential
methylation (Figure 5). Interestingly, in these methylation-expression associated
genes, the DMCs were located either in gene body (5 of these 13 genes) or intergenic
regions (8 of 13 genes) but not in promoter (Supplementary Table S2 in Additional
file 1). Three genes containing DMC clusters demonstrated gene expression
differences between sexes (Supplementary Table S3 in Additional file 1). kcnj13,
associated with a hypermethylated DMC cluster in an intron, showed lower
expression in male brains compared to female brains (corrected p-value = 1.88E-05,
log2 fold change = 2.41). In contrast, gp1bb, associated with a hypomethylated DMCs
cluster in an exon, showed lower expression in male brains compared to female brains
(corrected p-value = 5.23E-09, log2 fold change = 1.39). Finally, Junb, associated
with a hyper methylated DMCs cluster in an exon showed higher expression in male
brains compared to female brains (corrected p-value = 2.17E-07, log2 fold change =
ACCEPTED MANUSCRIPT
Overall, the comparison of methylation status and expression levels shows no clear
pattern of the relationship between methylation status and expression levels, for the
differentially expressed genes between the sexes. However, three main limitations of
our study might have resulted in the limited ability to link methylation and expression
in zebrafish brains. First, each of the samples sequenced was pooled from several
individuals and thus inter-individual variation might have masked the relationships.
And third, we used whole-brain homogenates and the patterns could have been
different for different brain tissues if analysed separately. However, for zebrafish,
isolating single cell types is not feasible. Second, we had to use different individuals
for methylome and transcriptome analysis and variation in these individuals might
result in poor correlation in methylation with gene expression. However, DNA
methylation is a stable and mitotically heritable epigenetic mark. Therefore if
sex-specific methylation change and corresponding gene expression change in a
phenomenon in zebrafish, then it is unlikely to alter in different cohort of fish.
Finally, methylation is only one of several factors that regulate differential expression
and thus the relationship between methylation and expression can be complex and
hard to disentangle [23]. In line with this last point, we found more differentially
expressed genes than differentially methylated between the sexes.
Conclusions
The main aim of this study was to test an extended version of the ‘male sex drive’
hypothesis, using zebrafish brains from the two sexes. That is, we examined
differential DNA methylation and expression between the sexes. Overall, our result
does not provide support in favour this hypothesis. The male and female brain tissues
ACCEPTED MANUSCRIPT
hypomethylated DMCs in male. In addition, several discrete DMCs clusters were
identified where males were hyper methylated.
One potential limitation of the study is that the sample size analysed here are small.
However, in each of our library we have pool of 6 fish (i.e., 24 fish in total). This
strategy lowers the possibility of inter-individual variation in methylation to a large
extent. We found very high positive correlation between the male (Pearson’s
correlation coefficient between Male1 vs. Male2 = 0.98) and female (Pearson’s
correlation coefficient between Female1 vs. Female2 = 0.97) replicate samples [25]
demonstrating minimal technical variation between the pooled samples. Further,
These data was derived using high coverage methylation analysis using RRBS.
Methylation calls from RRBS technology has been shown to be very reproducible by
several groups across the world [46-53]. Further, in the identified DMC cluster we
see multiple adjacent CpG sites exhibits large methylation changes in the same
direction. This result suggests that these site-specific differences are biologically
determined rather than just stochastic or spurious variation. Nevertheless, validation
of sex specific DMRs in additional cohorts and functional study will be valuable to
determine the role of these DMRs in zebrafish sex determination in future research.
At transcription level, contrary to our expectation, the gene expression seemed to be
more female-biased. Notably, we found only 13 genes that showed a concordant
methylation and expression pattern. We also reviewed and compared results from four
other studies reporting sex differences in gene expression in zebrafish brain. We
ACCEPTED MANUSCRIPT
inconsistency may stem from the different experimental and analytical methods used
but it also suggests that the effect, if it exists, is small.
Understanding of epigenetic regulation in zebrafish genome is still very limited;
therefore, further work is needed to examine epigenetic events in other tissues in this
important model organism. In relation to the current study it will be intriguing to
explore if the differential methylation we observed is embedded at a very early stage
of development in zebrafish, before the actual sex determination occurs. This will
reveal how early sex-specific epigenetic changes occur and whether other tissues
carry these epigenetic marks and will also allow to investigate role of non-genetic
events in regulating gene expression pattern [54]. Such study also has potential to be
used for understanding the mechanisms of the development of sexual dimorphism in
brain function. Also, it will be important for future studies to look at the role of DNA
methylation in regulating the use of alternative promoters and alternative splicing of
transcripts in zebrafish [55]. Further, it will be important to determine whether the
unique DMC clusters play role in in determining sex-specific phenotypes.
Overall, we know little about developmental pathways involved in gonad
differentiation, and even less about pathways involved in brain differentiation, in
zebrafish. Differential brain development between males and females could be either
the cause or consequence of biased DNA methylation and the links between
sex-specific methylation pattern and sex-sex-specific behaviour are yet to be revealed.
Methods
ACCEPTED MANUSCRIPT
All zebrafish work was approved by the University of Otago Animal Ethics
Committee. Animal handling and manipulations were conducted in accordance with
Otago Animal Ethics Committee (protocol 48–11).
Sample collection
Adult zebrafish wild-type AB strains were used for this study. The fish were
maintained at the Otago Zebrafish Facility, Department of Pathology, University of
Otago. Preparation of DNA for RRBS libraries was performed as previously
described [25, 26]. Briefly, brains were dissected from 12 male and 12 female adult
sexually mature zebrafish and were halved through the sagittal plane. Two male and
two female RRBS libraries were prepared, with each library containing a pool of six
halved zebrafish brains. For RNA-Seq, brain tissues were collected from an
independent cohort of adult male and female fish, and snap frozen in liquid nitrogen.
The frozen samples were stored at -80 °C. One male and one female sample pool
(each containing brain tissues from three adult fish) was created and RNA was
extracted for library preparation.
RRBS library preparation
Genomic DNA from each pooled brain sample was extracted with PureLink Genomic
DNA Mini Kit (Invitrogen) following the manufacturer’s protocol. Reduced
representation bisulfite sequencing libraries were prepared based on our published
protocol [56, 57]. In brief, the genomic DNA was digested with MspI (New England
Biolabs, Ipswich, MA) followed by end repair, addition of 3’ A overhangs and
addition of methylated adaptors (Illumina, San Diego, CA) to the digested fragments.
Following adaptor ligation, DNA fragments ranging from 40-220 bp (pre-ligation
ACCEPTED MANUSCRIPT
Switzerland) and subsequently bisulfite converted using the EZ DNA methylation kit
(Zymo Research, Irvine, CA) with an extended incubation time of 18-20 hours.
Bisulfite converted libraries were amplified by PCR reactions and sequenced on an
Illumina HiSeq2000 sequencer with a single-ended 49 bp run. A total of 98 million
sequenced reads were obtained from four zebrafish brain RRBS libraries.
Quality check and alignment of methylation data
Quality check of the sequenced reads was performed using FastQC software package
(distributed by Babraham Institute, Cambridge, UK). Our in-house cleanadaptors
program was used to assess contamination of adaptor sequences and to remove them
from the sequences. Single-ended bisulfite reads were aligned against zebrafish
genome assembly (Zv9) using Bismark software [58].
Analysis of differential DNA methylation
Following alignment by Bismark, the SAM files containing uniquely aligned reads
were numerically sorted and then processed in R studio (version 0.97.312) using the R
package methylKit [59] to produce single CpG site files. The CpG sites that were
covered by at least 10 sequenced reads were retained for further analysis. The forward
and reverse strand CpG site coverage essentially represent the same CpG sites; we
have combined forward and reverse coverage by setting the DESTRAND = True
parameter in methylKit package (default = False). Differentially methylated CpG sites
were identified using methylKit algorithm [59] that used logistic regression to
calculate p-values, adjusted the p-values for multiple hypothesis testing and generated
q values using SLIM approach [60]. The criteria used for identification of
ACCEPTED MANUSCRIPT
Gene and feature location of differentially methylated CpG sites
To investigate the distribution and genomic positions of the differentially methylated
CpG sites (in relation to the gene and CpG features) we used identgenloc program
from the DMAP package [61]. We developed the DMAP package for comprehensive
analysis of RRBS and WGBS data. The identgenloc program used SeqMonk feature
table information for Zv9 assembly. SeqMonk (freely distributed from Babraham
Institute) provided .DAT files containing information on CpG islands and genes in
zebrafish. These files were parsed by identgeneloc, returning information on proximal
genes, CpG islands and exon, intron locations of differentially methylated CpG sites.
Seqmonk annotations are based on Ensembl database. For the current analysis only
protein coding genes were considered. UNIX awk (an interpreted programming
language) commands were used for further processing of information returned by
identgenloc program [62].
RNA-Seq library preparation
Total RNA was extracted using TRIzol® Reagent (Invitrogen, USA). RNA
concentrations were determined using NanoDrop 2000 (Thermo Scientific). The
integrity of RNA samples was determined using an Agilent RNA 6000 Nano chip on
an Agilent 2100 Bioanalyzer [63, 64]. Samples with RNA Integrity Number (RIN)
value of 8-9 was used for RNA-Seq library preparation. Messenger RNA sequencing
library was prepared using TruSeq total RNA sample preparation kit (Illumina; Total
RNA sample preparation guide), as per the manufacturers instructions, with 3 µg
input RNA per library. Quality of RNA-Seq library was checked following the
ACCEPTED MANUSCRIPT
female samples were performed on the Illumina HiSeq2000 (Illumina, USA) machine
with single-ended 51-bp reads. One sample was sequenced per flow cell lane.
Analysis of RNA-Seq data
The sequenced reads from RNA-Seq experiments were assessed for quality and
subjected to normalization (duplicate filtering) and then mapped to the zebrafish
genome assembly (Zv9) with Tophat alignment tool [65]. The mapped files were then
loaded into Genespring for downstream analysis. Raw read count information were
generated and normalized for each gene. The normalization of raw read counts and
analysis of differentially expressed genes was performed using the DESeq
Bioconductor R package. DESeq estimates variance to mean relationship and uses
negative binomial distribution model to determine differential expression [66]. The
final list of differentially expressed genes consisted of the genes that had a False
Discovery Rate (FDR) q-value less than 0.05 and showed at least 1.2 fold change in
expression between male and female brains. Fold change was calculated using the
formula: fold change = log2 (Normalized count for male / Normalized count for
female).
Additionally, we performed microarray analysis using the Affymetrix GeneChip
Zebrafish Genome Array. Six halved zebrafish brains (the other half was used for
DNA methylation analysis as described above) were pooled and used for RNA
extraction in duplicates for each sex respectively. Hybridizaton of probes was
performed according to the manufacturer's protocol (see:
http://www.affymetrix.com/catalog/131530/AFFY/Zebrafish+Genome+Array#1_1).
Normalization of the raw probe intensities was performed using a Robust Multi-Array
ACCEPTED MANUSCRIPT
the data was performed as we previously described [63]. Differentially expressed
genes between male and female brains were identified using a p-value < 0.05 and
abs(log2FC) ≥ 1.2. However, the number of detected transcripts was very low for
microarray experiments due to low detection rate and subsequently we found few
very differentially expressed transcripts between male and female brain and these data
are not shown. The processed microarray data for male and females are available on
request.
Gene Functional Enrichment analysis
Functional annotation clustering was used to cluster similar GO terms together and
results were ranked according to the Group Enrichment Score (the geometric mean
(on -log scale) of member's p-values in a corresponding annotation cluster)
[67]. Functional annotation clusters were given an overall term which summarised
the general theme of each cluster and only clusters with enrichment scores greater
than 1.5 were considered. List of protein-coding genes of zebrafish genome was used
as the background for these analyses.
Data availability:
The datasets supporting this article are available in the NCBI Gene Expression
Omnibus (GEO) archive. Accession number for the Brain DNA methylation data:
ACCEPTED MANUSCRIPT
List of abbreviations used
DMCs: differentially methylated CpG sites; RRBS: reduced representation bisulfite
sequencing; FDR: False Discovery Rate
Competing interests
The authors declare that they have no competing interests.
Authors
’
contributions
AC, SN conceptually designed the project. PAS performed the alignment of RRBS
data and developed the methylation analysis pipeline. ML, EJR, ED helped in data
analysis, generating relevant figures and contributed to manuscript preparation. JAH
helped in zebrafish experimental work. LZ, JJ, SM, performed RNA-Seq experiments
and data analysis of the transcriptome libraries. YO helped with zebrafish sample
collection and RRBS. AC wrote the first draft of the manuscript with significant help
from all the authors. All authors read and approved the final manuscript.
Authors’ information
1
Department of Pathology, Dunedin School of Medicine, University of Otago, 270
Great King Street, Dunedin 9054, New Zealand 2 Maurice Wilkins Centre for
Molecular Biodiscovery, Level 2, 3A Symonds Street, Auckland, New Zealand. 3
Department of Zoology, University of Otago, 340 Great King Street, Dunedin 9054,
New Zealand. 4 Evolution & Ecology research Centre and School of Biological, Earth
and Environmental Sciences, University of New South Wales, Kensington 2052,
ACCEPTED MANUSCRIPT
Cumberland Street, Dunedin 9054, New Zealand. 7 Department of Biology, Keio
University, 4-1-1 Hiyoshi, Kohoku-ku, Yokohama, Kanagawa 223-8521, Japan, 8
Diabetes and Metabolism Division, Garvan Institute of Medical Research,
Darlinghurst NSW 2010, Australia.
Acknowledgements
Aniruddha Chatterjee is thankful to New Zealand Institute for Cancer Research for
providing a fellowship. SN was supported by the Rutherford Fellowship, NZ, and the
Future Fellowship, AU. The authors are grateful for the financial support provided by
ACCEPTED MANUSCRIPT
References
[1] Pietsch TW. Dimorphism, parasitism, and sex revisited: modes of
reproduction among deep-sea ceratioid anglerfishes (Teleostei: Lophiiformes). Ichthyol Res. 2005;52:207-36.
[2] Connallon T, Knowles LL. Intergenomic conflict revealed by patterns of sex-biased gene expression. Trends Genet. 2005;21:495-9.
[3] Ellegren H, Parsch J. The evolution of sex-biased genes and sex-biased gene expression. Nature Reviews Genetics. 2007;8:689-98.
[4] Yang X, Schadt EE, Wang S, Wang H, Arnold AP, Ingram-Drake L, et al. Tissue-specific expression and regulation of sexually dimorphic genes in mice. Genome Research. 2006;16:995-1004.
[5] Haerty W, Jagadeeshan S, Kulathinal RJ, Wong A, Ram KR, Sirot LK, et al. Evolution in the Fast Lane: Rapidly Evolving Sex-Related Genes in Drosophila. Genetics. 2007;177:1321-35.
[6] Zhang Y, Sturgill D, Parisi M, Kumar S, Oliver B. Constraint and turnover in sex-biased gene expression in the genus Drosophila. Nature. 2007;450:233-7. [7] Harrison PW, Wright AE, Zimmer F, Dean R, Montgomery SH, Pointer MA, et al. Sexual selection drives evolution and rapid turnover of male gene expression. Proc Natl Acad Sci USA. 2015;112:4393-8.
[8] Pointer MA, Harrison PW, Wright AE, Mank JE. Masculinization of Gene Expression Is Associated with Exaggeration of Male Sexual Dimorphism. PLoS Genetics. 2013;9.
[9] Sharma E, Künstner A, Fraser BA, Zipprich G, Kottler VA, Henz SR, et al. Transcriptome assemblies for studying sex-biased gene expression in the guppy, Poecilia reticulata. BMC Genomics. 2014;15:400.
[10] Gagnidze K, Weil ZM, Pfaff DW. Histone modifications proposed to regulate sexual differentiation of brain and behavior. BioEssays. 2010;32:932-9.
[11] Hosken DJ, House CM. Sexual selection. Curr Biol. 2011;21:R62-5. [12] Singh RS, Kulathinal RJ. Male sex drive and the masculinization of the
genome. BioEssays: News and Reviews in Molecular, Cellular and Developmental Biology. 2005;27:518-25.
[13] Singh RS, Artieri CG. Male Sex Drive and the Maintenance of Sex: Evidence from Drosophila. J Hered. 2010;101:S100-S6.
[14] Spruijt CG, Vermeulen M. DNA methylation: old dog, new tricks? Nature Structural & Molecular Biology. 2014;21:949-54.
[15] Chatterjee A, Eccles MR. DNA methylation and epigenomics: new technologies and emerging concepts. Genome Biol. 2015;16:103.
[16] Liu J, Morgan M, Hutchison K, Calhoun VD. A study of the influence of sex on genome wide methylation. Plos One. 2010;5:e10028.
[17] El-Maarri O, Becker T, Junen J, Manzoor SS, Diaz-Lacava A, Schwaab R, et al. Gender specific differences in levels of DNA methylation at selected loci from human total blood: a tendency toward higher methylation levels in males. Hum Genet. 2007;122:505-14.
ACCEPTED MANUSCRIPT
[19] Xu Z, Taylor JA. Genome-wide age-related DNA methylation changes in blood and other tissues relate to histone modification, expression and cancer. Carcinogenesis. 2014;35:356-64.
[20] Barua S, Kuizon S, Chadman KK, Flory MJ, Brown WT, Junaid MA. Single-base resolution of mouse offspring brain methylome reveals epigenome modifications caused by gestational folic acid. Epigenetics & Chromatin. 2014;7:3.
[21] Nätt D, Agnvall B, Jensen P. Large Sex Differences in Chicken Behavior and Brain Gene Expression Coincide with Few Differences in Promoter
DNA-Methylation. PLoS ONE. 2014;9:e96376.
[22] Nugent BM, Wright CL, Shetty AC, Hodes GE, Lenz KM, Mahurkar A, et al. Brain feminization requires active repression of masculinization via DNA methylation. Nat Neurosci. 2015;18:690-7.
[23] Jazin E, Cahill L. Sex differences in molecular neuroscience: from fruit flies to humans. Nat Rev Neurosci. 2010;11:9-17.
[24] Suzuki MM, Bird A. DNA methylation landscapes: provocative insights from epigenomics. Nat Rev Genet. 2008;9:465-76.
[25] Chatterjee A, Ozaki Y, Stockwell PA, Horsfield JA, Morison IM, Nakagawa S. Mapping the zebrafish brain methylome using reduced representation bisulfite sequencing. Epigenetics. 2013;8:979-89.
[26] Chatterjee A, Stockwell, PA, Horsfield, JA, Morison, IM, Nakagawa, S. Base-resolution DNA methylation landscape of zebrafish brain and liver. Genomics Data. 2014;2:342 4.
[27] Krueger F, Andrews SR. Bismark: a flexible aligner and methylation caller for Bisulfite-Seq applications. Bioinformatics. 2011;27:1571-2.
[28] Hutter S, Hettyey A, Penn DJ, Zala SM. Ephemeral Sexual Dichromatism in Zebrafish (Danio rerio). Ethology. 2012;118:1208-18.
[29] Spence R, Jordan WC, Smith C. Genetic analysis of male reproductive success in relation to density in the zebrafish, Danio rerio. Front Zool. 2006;3:1-6.
[30] Liew WC, Orbán L. Zebrafish sex: a complicated affair. Briefings in Functional Genomics. 2014;13:172-87.
[31] Wilson CA, High SK, McCluskey BM, Amores A, Yan YL, Titus TA, et al. Wild sex in zebrafish: loss of the natural sex determinant in domesticated strains. Genetics. 2014;198:1291-308.
[32] Hellman A, Chess A. Gene body-specific methylation on the active X chromosome. Science. 2007;315:1141-3.
[33] Eckhardt F, Lewin J, Cortese R, Rakyan VK, Attwood J, Burger M, et al. DNA methylation profiling of human chromosomes 6, 20 and 22. Nat Genet.
2006;38:1378-85.
[34] Xu H, Wang F, Liu Y, Yu Y, Gelernter J, Zhang H. Sex-biased methylome and transcriptome in human prefrontal cortex. Hum Mol Genet. 2014;23:1260-70.
Spiers H Hannon E Schalkwyk LC Smith R Wong CCY O Donovan MC et al
Methylomic trajectories across human fetal brain development. Genome Research. 2015;25:338-52.
[36] Illingworth RS, Gruenewald-Schneider U, De Sousa D, Webb S, Merusi C, Kerr ARW, et al. Inter-individual variability contrasts with regional homogeneity in the human brain DNA methylome. Nucl Acids Res. 2015:gku1305.
ACCEPTED MANUSCRIPT
[38] Doi A, Park IH, Wen B, Murakami P, Aryee MJ, Irizarry R, et al. Differential methylation of tissue- and cancer-specific CpG island shores distinguishes human induced pluripotent stem cells, embryonic stem cells and fibroblasts. Nat Genet. 2009;41:1350-3.
[39] Rao X, Evans J, Chae H, Pilrose J, Kim S, Yan P, et al. CpG island shore methylation regulates caveolin-1 expression in breast cancer. Oncogene. 2013;32:4519-28.
[40] Chatterjee A, Morison IM. Monozygotic twins: genes are not the destiny? Bioinformation. 2011;7:369-70.
[41] Jones PA. Functions of DNA methylation: islands, start sites, gene bodies and beyond. Nat Rev Genet. 2012;13:484-92.
[42] Bird AP. Gene number, noise reduction and biological complexity. Trends In Genetics : Tig. 1995;11:94-100.
[43] Trabzuni D, Ramasamy A, Imran S, Walker R, Smith C, Weale ME, et al. Widespread sex differences in gene expression and splicing in the adult human brain. Nature Communications. 2013;4.
[44] Naurin S, Hansson B, Hasselquist D, Kim Y-H, Bensch S. The sex-biased brain: sexual dimorphism in gene expression in two species of songbirds. BMC Genomics. 2011;12:37.
[45] Butler MG, Iben JR, Marsden KC, Epstein JA, Granato M, Weinstein BM. SNPfisher: tools for probing genetic variation in laboratory-reared zebrafish. Development. 2015;142:1542-52.
[46] Baranzini SE, Mudge J, van Velkinburgh JC, Khankhanian P, Khrebtukova I, Miller NA, et al. Genome, epigenome and RNA sequences of monozygotic twins discordant for multiple sclerosis. Nature. 2010;464:1351-6.
[47] Bock C, Kiskinis E, Verstappen G, Gu H, Boulting G, Smith ZD, et al. Reference Maps of human ES and iPS cell variation enable high-throughput
characterization of pluripotent cell lines. Cell. 2011;144:439-52.
[48] Gertz J, Varley KE, Reddy TE, Bowling KM, Pauli F, Parker SL, et al. Analysis of DNA methylation in a three-generation family reveals widespread genetic influence on epigenetic regulation. Plos Genetics. 2011;7:e1002228.
[49] Gu H, Bock C, Mikkelsen TS, Jager N, Smith ZD, Tomazou E, et al. Genome-scale DNA methylation mapping of clinical samples at single-nucleotide resolution. Nature Methods. 2010;7:133-6.
[50] Smallwood SA, Tomizawa S, Krueger F, Ruf N, Carli N, Segonds-Pichon A, et al. Dynamic CpG island methylation landscape in oocytes and preimplantation embryos. Nature Genetics. 2011;43:811-4.
[51] Steine EJ, Ehrich M, Bell GW, Raj A, Reddy S, van Oudenaarden A, et al. Genes methylated by DNA methyltransferase 3b are similar in mouse intestine and human colon cancer. The Journal Of Clinical Investigation. 2011;121:1748-52. [52] Chatterjee A, Stockwell PA, Rodger EJ, Morison IM. Genome-scale DNA methylome and transcriptome profiling of human neutrophils. Sci Data. 2016;3:160019.
[53] Chatterjee A, Stockwell PA, Rodger EJ, Duncan EJ, Parry MF, Weeks RJ, et al. Genome-wide DNA methylation map of human neutrophils reveals widespread inter-individual epigenetic variation. Scientific reports. 2015;5:17328.
[54] Ingleby FC, Flis I, Morrow EH. Sex-Biased Gene Expression and Sexual Conflict throughout Development. Cold Spring Harb Perspect Biol.
ACCEPTED MANUSCRIPT
[55] Lenz KM, Nugent BM, McCarthy MM. Sexual differentiation of the rodent brain: dogma and beyond. Front Neurosci. 2012;6:26.
[56] Chatterjee A, Stockwell PA, Rodger EJ, Morison IM. Comparison of alignment software for genome-wide bisulphite sequence data. Nucl Acids Res.
2012;40:e79.
[57] Chatterjee A, Rodger EJ, Stockwell PA, Weeks RJ, Morison IM. Technical considerations for reduced representation bisulfite sequencing with multiplexed libraries. Journal Of Biomedicine & Biotechnology. 2012;2012:741542.
[58] Krueger F, Andrews SR. Bismark: A flexible aligner and methylation caller for Bisulfite-Seq applications. Bioinformatics. 2011.
[59] Akalin A, Kormaksson M, Li S, Garrett-Bakelman FE, Figueroa ME, Melnick A, et al. methylKit: a comprehensive R package for the analysis of genome-wide DNA methylation profiles. Genome Biology. 2012;13:R87.
[60] Wang HQ, Tuominen LK, Tsai CJ. SLIM: a sliding linear model for estimating the proportion of true null hypotheses in datasets with dependence structures. Bioinformatics. 2011;27:225-31.
[61] Stockwell PA, Chatterjee A, Rodger EJ, Morison IM. DMAP: differential methylation analysis package for RRBS and WGBS data. Bioinformatics. 2014. [62] Stockwell PA, Chatterjee A, Rodger EJ, Morison IM. DMAP: differential methylation analysis package for RRBS and WGBS data. Bioinformatics. 2014;30:1814-22.
[63] Chatterjee A, Leichter AL, Fan V, Tsai P, Purcell RV, Sullivan MJ, et al. A cross comparison of technologies for the detection of microRNAs in clinical FFPE samples of hepatoblastoma patients. Scientific reports. 2015;5:10438.
[64] Leichter AL, Purcell RV, Sullivan MJ, Eccles MR, Chatterjee A. Multi-platform microRNA profiling of hepatoblastoma patients using formalin fixed paraffin embedded archival samples. GigaScience. 2015;4:54.
[65] Trapnell C, Pachter L, Salzberg SL. TopHat: discovering splice junctions with RNA-Seq. Bioinformatics. 2009;25:1105-11.
[66] Anders S, Huber W. Differential expression analysis for sequence count data. Genome Biol. 2010;11:R106.
ACCEPTED MANUSCRIPT
[image:33.595.93.491.117.452.2]Figures and legends
Figure 1. Unsupervised hierarchical clustering of CpG site methylation in four
RRBS libraries. Only the CpG sites that were covered by 10 or more sequenced
ACCEPTED MANUSCRIPT
Figure 2. Chromosomal, genomic and CpG feature distribution of differentially
methylated CpG sites in the brains of female and male zebrafish. 2a: Manhattan
plot showing the chromosomal distribution of the DMCs. Chromosomes are shown
along the x-axis (chromosomes 1 to 25). Each differentially methylated site is
represented by a single data point. The y-axis depicts the % difference in DNA
methylation seen at each individual site between males and females, with a positive
value corresponding to higher methylation in male brains, and negative value to
higher methylation in female brain tissue. Figure 2b-c: The distribution of DMCs
ACCEPTED MANUSCRIPT
Figure 3. DMCs clusters with sexually dimorphic methylation patterns. (a-e).
DMC clusters with five or more DMCs are shown in the figure. Male brains are
represented in blue colour while female brains are represented as red. Y-axis: DNA
methylation level (scale of 0-1), x axis: relative distance of the DMCs in bp. Apart
from the significantly differentially methylated CpG sites (DMCs) listed in the Table
1 (marked with * in the figure), the adjacent CpG sites methylation are also shown in
the figure, to provide comprehensive overview of the methylation pattern in these
[image:36.595.117.493.229.598.2]regions.
Figure 4. Expression bias for female upregulated (male downregulated) and male
upregulated genes. Histograms of the distributions of fold change values for genes
that have higher expression in females than in males (red, 492 genes, log2 fold change
> 1.2, q ≤ 0.05) and genes that have higher expression in males than females (blue,
186 genes). Female-biased genes were not only more numerous, but also more often
ACCEPTED MANUSCRIPT
Figure 5. Overlap between differentially methylated and differentially expressed
genes between zebrafish male and female brain. (A-D) different comparisons and
individual overlaps between hypo and hypermethylated genes in males vs. male up-
and downregulated genes (female upregulated). Shades of blue indicate male
hypermethylated and male upregulated genes and shades of red indicate male
ACCEPTED MANUSCRIPT
Tables and captions
Table1.
Genes related to distinct clusters of differentially methylated CpG (DMCs clusters) between male and female zebrafish brains.
Gene Function Number
of
DMCs
in
cluster
Chromosom
e
Contig
length (bp)
Genomic
co-ordinate
Gene relation Hyper
methylated
sex
CABZ0106709
8.1(LOC10033
4776)
Phosphatase and actin
regulator 1-like
14 20 137 53097848
-53097985
Intergenic (
28255 bp)
Male
ACCEPTED MANUSCRIPT
-44487140
gp1bb Glycoprotein Ib
(platelet), beta
polypeptide
8 8 128 4778157
-4778285
Exon Female
SOS1 Son of sevenless
homolog 1
8 11 98 46305439
-46305537
Intergenic (
21613 bp)
Male
Junb Jun B proto-oncogene
b
6 3 334 8435633
-8435967
Exon Male
hecw11 C2 and WW domain
containing ubiquitin
protein ligase
41 2 33 50488990
-50489023
Intron Female
pls32 Plastin 3 42 14 370 13572388 Intergenic (
290864 bp)
ACCEPTED MANUSCRIPT
-13572758
kcnj13 potassium
inwardly-rectifying channel
3 15 22 38879054
-38879076
Intron Male
gk5 Glycerol kinase 5 3 2 44 16503339
-16503383
Intron Female
fam150ba family with sequence
similarity 150,
member Ba
3 23 209 35600782
-35600991
Promoter (1725
upstream)
Male
mrps35 Mitochondrial
Ribosomal Protein
S35
3 26 24 2248265-2248289 Intergenic (
127528 bp)
Male
trim35-31 Tripartite motif
containing 35-31
3 3 8 6085712-6085720 Intergenic (
12577 bp)
ACCEPTED MANUSCRIPT
grhl1 Grainyhead-like 1 3 17 19
32646679-32646698
Intergenic (
14530 bp)
Female
rhcgl1 Rhesus blood group,
C glycoprotein, like 1
3 6 40
36135672-36135712
Intergenic (
24639 bp )
Male
si:ch211-245h14.1
Ensembl:ENSDARG0
0000073913
(predicted protein
coding)
3 20 13
38564459-36135672
Intergenic (14284
bp)
Female
1
Only 4 out of 5 DMCs form the cluster. One DMC (chr2: 50513951) was in an exon and was far apart.
2
ACCEPTED MANUSCRIPT
Table2.
Comparison of the results of studies reporting gene expression in the male and female zebrafish brains.
Reference Cut-off P-value Cut-off log2FC Number of male-biased
genes
Number of female-biased
genes
Overall result
Santos et al., 2008 ≤ 0.05* ≥ 1.2 18 24 Female-biased
Sreenivasan et al., 2008 ≤ 0.05* ≥ 1.5 NA NA Female-biased^
Wong et al., 2014 ≤ 0.05* Not used 48 13 Male-biased
Arslan-Ergul and Adams,
2014
ACCEPTED MANUSCRIPT
* indicates use of FDR-corrected P-values. NA stands for “not available”. ^ - based on authors’ conclusion
ACCEPTED MANUSCRIPT
Availability of supporting data
Additional Files:
Additional file 1 (docx): Figures S1-S8 and Tables S1-S3.
Additional file 2 (.xls): Complete list of differentially methylated CpG sites (DMCs)
and lists of significant differentially methylated genes in different genomic elements
with their associated DMC frequency.
Additional file 3 (.xls.): List of differentially expressed genes (including P-values,
gene name and annotation and normalized RPKM values) between male and female
ACCEPTED MANUSCRIPT
List of abbreviations used
DMCs: differentially methylated CpG sites; RRBS: reduced representation bisulfite
ACCEPTED MANUSCRIPT
Highlights
1. The global DNA methylation profile of male and female zebrafish brain is similar
2. Site-specific methylation differences exist between adult male and female brain
3. Distinct CpG clusters are differentially methylated between male and female brain
4. Differentially methylated CpGs are enriched in gene body, intergenic regions