Boston University
OpenBU http://open.bu.edu
Theses & Dissertations Boston University Theses & Dissertations
2018
Anesthesia and electroconvulsive
therapy
https://hdl.handle.net/2144/31268 Boston University
BOSTON UNIVERSITY SCHOOL OF MEDICINE
Thesis
ANESTHESIA AND ELECTROCONVULSIVE THERAPY
by
SIVASANKARI RAJAMARTHANDAN B.A., University of Virginia, 2016
Submitted in partial fulfillment of the requirements for the degree of
Master of Science 2018
© 2018 by
SIVASANKARI RAJAMARTHANDAN All rights reserved
Approved by
First Reader
Maryann MacNeil, M.A.
Professor of Anatomy and Neurobiology
Second Reader
Michael E. Henry, M.D.
Director of Somatic Therapy and Lecturer in Psychiatry Massachusetts General Hospital and Harvard Medical School
DEDICATION
To my dearest daddy thatha,
ACKNOWLEDGMENTS
I wish to express my gratitude to Dr. Michael Henry for his continued support, patience, enthusiasm, and mentorship. I sincerely thank you, Dr. Henry, for providing me with this incredible opportunity to learn and grow both professionally and personally.
I am really grateful to Ms. MacNeil for her guidance and unrelenting encouragement throughout my education.
Thank you amma, daddy, and Vaiju for being my pillars. You have made successes as well as my struggles your own. I owe you three everything.
ANESTHESIA AND ELECTROCONVULSIVE THERAPY SIVASANKARI RAJAMARTHANDAN
ABSTRACT
Background: Major Depressive Disorder (MDD) is a common mental health illness, characterized by persistent feelings of sadness, diminished interests, guilt, low-self esteem, and disturbances in sleep and appetite. A significant percentage of patients with MDD are treatment resistant. Electroconvulsive Therapy (ECT) is a biological procedure utilized for treatment resistant illnesses. Diagnosis and clinical conditions primarily dictate when ECT is the appropriate treatment modality for an individual. Circumstances requiring rapid clinical response, risks affiliated with alternative treatments, resistance to pharmacotherapy, and medical history are all factors that designate ECT as the treatment of choice.
Methods: The objective of this systematic review was to examine how different anesthetics or combinations of agents affect ECT’s therapeutic efficacy in depressed, adult patients. Electroencephalography (EEG) and motor seizure durations and Hamilton Depression Rating Scale (HDRS) scores were used as primary measures of clinical outcomes. Two rounds of literature searches were conducted in the PubMed, Web of Science, and Google Scholar databases to identify randomized controlled trials and crossover trials that examined the effects of different intravenous sedatives and hypnotic agents on ECT. Two reviewers independently evaluated the internal validity and quality of studies, extracted data, and analyzed statistics. Utilizing all relevant data, standardized
mean differences (SMD) with 95% confidence intervals (CIs), and heterogeneity measures were calculated. Ten studies with 373 participants were included.
Results: Thiopental only anesthesia was associated with longer EEG seizure duration when compared to propofol only treatment. The pooled effect size from studies with propofol anesthesia also suggests that this agent is associated with shorter seizure durations. If assessed individually with thiopental, the combination of ketamine and thiopental is correlated with increased motor as well as EEG seizure durations. When pooled; however, studies with patient groups assigned to anesthesia consisting of
ketamine and another primary agent do not show significant differences either in EEG or motor seizure durations. Additionally, no difference exists in HDRS score reductions between propofol and methohexital. Of note; however, ketamine combined with either propofol or thiopental had significantly greater decreases in HDRS scores.
Conclusion: Choice of anesthetic should be determined based on anticipated clinical outcome, adverse effect profile, reemergence, and patient preference. If long seizures are preferred, thiopental may be a reasonable option. However, if significantly larger
decreases in depression score are preferred, then the combinations of ketamine and propofol or ketamine and thiopental appear to be the therapies of choice. Small sample sizes and insufficient clinical data limit the interpretations of these variables that determine therapeutic efficacy. Larger randomized control trials and crossover trials would provide greater insight into the optimal use of intravenous anesthetic agents with minimal adverse effects.
TABLE OF CONTENTS
TITLE……….……..i
COPYRIGHT PAGE………....…...ii
READER APPROVAL PAGE………...iii
DEDICATION ... iv
ACKNOWLEDGMENTS ... v
ABSTRACT ... vi
TABLE OF CONTENTS ... viii
LIST OF TABLES………...x
LIST OF FIGURES ... xi
LIST OF ABBREVIATIONS ... xii
INTRODUCTION ... 1
History of ECT….…….……….……….….…1
Demographics and Current Practice………..….…….3
Mechanisms of Therapeutic Action……….….…...4
Anesthesia………..…11
METHODS ... 18
Search Strategy………..18
Data Extraction and Analysis……….…...21 RESULTS ... 25 DISCUSSION………...………...…...40 Summary………...40 Primary Outcomes….………...40 Limitations….………….……….………..…42 REFERENCES………..44 CURRICULUM VITAE………52
LIST OF TABLES
Table Title Page
1 Drugs Commonly Utilized in ECT Procedures 12
2 ECT Induced Physiological Responses 13
3 Included Studies and Treatment Groups 26
4 Effect of Anesthetic on Motor Seizure Duration 26 5 Effect of Anesthetic on EEG Seizure Duration 27 6 Effect of Anesthetic on Hamilton Depression Score 27 7 Propofol versus Anesthetic, Combined Effect Size of EEG
Duration
30
8 Propofol versus Methohexital, Combined Effect Size of HDRS Score Change
31
9 Ketamine + Anesthetic versus Anesthetic, Combined Effect Size of EEG Seizure Duration
35
10 Ketamine + Anesthetic versus Anesthetic, Combined Effect Size of Motor Seizure Duration
36
11 Ketamine + Anesthetic versus Anesthetic, Combined Effect Size of HDRS Score Change
LIST OF FIGURES
Figure Title Page
1 Global Cerebral Blood Flow 5
2 3
Longitudinal Effect of ECT on Local Amygdalar Shape Funnel Plot
11 39
LIST OF ABBREVIATIONS
BDNF BPRS
Brain-Derived Neurotropic Factor Brief Psychiatric Rating Scale CBF
CIs CSF DSM-IV
ECD
Cerebral Blood Flow Confidence Intervals Cerebrospinal Fluid
Diagnostic and Statistical Manual of Mental Disorders-IV Ethyl Cysteinate Dimer
ECS ECT FGF-2 GABA gCBF HDRS HPA HVA ICD MDD NGF NMDA PCP Electroconvulsive Shock Electroconvulsive Therapy Fibroblast Growth Factor-2 Gamma-aminobutyric Acid Global Cerebral Blood Flow Hamilton Depression Rating Scale Hypothalamic-Pituitary Axis Homovanillic Acid
International Classification of Diseases Major Depressive Disorder
Nerve Growth Factor N-Methyl-D-aspartate Phencyclidine
PPD rCBF RCT SMD VEGF Pretest-Posttest Control
Regional Cerebral Blood Flow Randomized Controlled Trial Standardized Mean Difference Vascular Endothelial Growth Factor
INTRODUCTION History of Electroconvulsive Therapy
Invented in 1938, electroconvulsive therapy (ECT) is a biological procedure used for a range of neuropsychiatric illness such as major depressive disorder, manic disorder, and psychosis. ECT procedures are performed in multiple countries around the world; approximately 100,000 treatments occur in the United States annually1.
Historically, ECT represents a refinement of convulsive treatment developed by Ladislaus von Meduna, who induced epileptic seizures with camphor to treat
schizophrenic patients. Utilizing existing neuropathologic studies of the time, Meduna, a Hungarian psychiatrist and pathologist, had recognized a contrast between the abundant glial cell growth in patients with epilepsy and the lack thereof in patients with
schizophrenia2,3. Although Meduna postulated this particular biological antagonism between epilepsy and schizophrenia from the studies, his hypothesis was later rejected4. After inducing a brief series of convulsions with intramuscular injections of camphor in oil, Meduna enabled the full recovery of a schizophrenic patient who had suffered with a 4-year catatonic stupor. Substituting camphor with pentylenetetrazol to increase
predictability, Meduna proceeded to revolutionize this therapeutic modality for schizophrenia. While convulsive therapy’s successes facilitated its spread throughout Europe, its constraints, such as, exceedingly undesirable sensations and unpredictable timing, also became manifest. In order to ensure predictability, Italian scientists Cerletti and Bini developed the alternative method of using electric current for inducing seizures2.
After trying several possible positions for electrode placement in animals,
Cerletti’s assistant, Bini discovered that the temples were safe sites for performing ECT. Once further animal testing demonstrated the safety of electrically induced seizures, Cerletti and Bini fine-tuned the stimulus parameters to enable therapeutic application in humans. They performed the first treatment of electroconvulsive therapy on a 39-year-old man, who was found meandering through a train station. Delusional, incoherent, and hallucinating, this patient was diagnosed with schizophrenia, after which he underwent the first ever ECT treatment on April 11, 1938. Although the efficacy of treating
schizophrenia with induced convulsions had been previously demonstrated, the recovery of Cerletti’s patient after 11 ECT sessions had specifically established the safety of electrically induced convulsions2.
Over the next few decades, ECT’s efficacy established its significance in treating severe psychiatric disorders. Multiple contributions to convulsive therapy including, “the introduction of general anesthesia, oxygenation, and muscle relaxing agents; and
refinements in electrode placement, the seizure-inducing electrical waveform, and the informed consent process”4 have enhanced the tolerability, safety, and therapeutic efficacy of ECT. In the late 50s, with the serendipitous discovery of
psychopharmacological treatment options, clinicians preferred treating patients with medications, which were easier to use, relatively inexpensive, and better accepted by patients. Political discourse and media depictions of ECT, illustrating the previous
application of this modality without anesthesia, did little to promote the use of convulsive therapy in the 1950s and 1960s. As limitations of pharmacotherapy in the form of
treatment resistance and medication intolerance became evident, ECT continued to provide relief for these patients. After conducting a series of evaluations, professional organizations, psychiatric associations, and task forces affirmed the value of ECT in psychiatric medical practices around the world4. Since the late 80s, convulsive therapy has reemerged as an important tool for treating severe, treatment intolerant neuro-psychiatric disorders5.
Demographics and Current Practice
ECT has been predominantly performed on patients with severe depression5,6, which is supported by demographic surveys from nations including the United States7,
Spain8, Sweden9, Norway10, and New Zealand11. Among those treated with
electroconvulsive therapy in US community hospitals, elderly patients, aged 65 or older, were 7 times more likely to undergo ECT treatment than patients between the ages of 18 and 3412. This reflects that geriatric depression, which is often resistant to medication as well as psychotherapy, can be associated with higher mortality rates and become chronic in nature13. Greater sensitivity to adverse effects of psychotropic medications and
comorbid medical diagnoses, which interfere with pharmacologic treatment,12 indicate the use of ECT as a treatment modality for the elderly13.
Delivering electrical charge to the brain results in a generalized seizure14. The decision to treat an individual with ECT is based on two factors: diagnoses of MDD, mania, and psychosis with affective symptoms, and compelling clinical circumstance. Other reasons can be used to select ECT as the treatment of choice including clinical
urgency, risks associated with alternative treatments, resistance to medications, past medical history, or patient preference4. Current practice in the US is to conduct ECT in a hospital or clinic under the supervision of a psychiatrist and an anesthetist. ECT is administered after the patient is anesthetized and treated with a muscle relaxant14.
Mechanisms of Therapeutic Action
Anesthesia is integral to patient comfort. Since anesthetic agents act directly on the brain and neurotransmitters, they are important in the regulation of mood. Therefore, we will briefly summarize relevant hypotheses regarding ECT’s mechanisms of action to facilitate interpretations of the clinical effects mediated by different agents. ECT affects both the micro-environments and the macro environment of the brain by changing existing neuro-biological mechanisms, which can be further classified into
neurophysiological, neuro-biochemical, and neuroplasticity theories.
Neurophysiological: ECT delivers an electrical charge that propagates through the brain, resulting in the rapid depolarization of neurons as precipitated by changes in the
intercellular electrical environments and ion concentrations. A convulsion ensues when a collection of depolarized neurons fire simultaneously. The generalized tonic-clonic seizure affects and involves critical brain structures such as the cortex, sub-cortex, thalamus, basal ganglia, and the limbic system.
1. Cerebral Blood Flow: In the remitted state, patients with endogenous depression show reduced regional cerebral blood flow (rCBF) with greater decreases in the left hemisphere than in the right15. Takano et al. examined the changes in cerebral
blood flow (CBF) in patients immediately after acute ECT treatment. When compared to the pre-ECT state under anesthesia, the generalized seizure state is associated with increased global CBF. Whereas in missed (not generalized) seizures, global CBF quantities were at intermediate levels between the previous two conditions. Figure 1 depicts global CBF levels in these three different
conditions16.
Figure 1. Global Cerebral Blood Flow. Global cerebral blood flow (gCBF) under anesthesia (pre-ECT), at missed and successful electroconvulsive therapy (missed ECT and ECT). **p <0.001 as compared to pre-ECT; +p < 0.1 between missed ECT and
pre-ECT, and pre-ECT and pre-ECT, respectively. Figure and caption obtained from Takano, 201116.
In contrast, Nobler et al. reported that depressed patients, who are not in the active seizure state, have global perfusion reductions as well as reduced rCBF in the frontal cortex a week following ECT completion17.
2. Metabolism: Evidence points to persistent hypometabolic rates in the frontal gyri of individuals with unipolar or bipolar depression18. Henry et al. reported that
correlated with decreases in HDRS, after treatment with bifrontotemporal ECT19. Nobler et al. noted widespread regions of reduced glucose metabolism following ECT as well. Consistent with Henry et al.’s study on reduced glucose metabolism after ECT, this finding posits the suppression of functional brain activity,
particularly in the prefrontal cortex, as a putative mechanism of ECT’s therapeutic action. Nobler’s study not only records the decrease in frontal glucose metabolism after a course of ECT, but also significantly correlates these metabolic decreases with reductions in Hamilton depression scores20. While these findings regarding changes in the frontal lobes are consistent with the pathophysiology of depression, evidence suggesting reduced brain metabolism after ECT is not yet conclusive. For example, Mervaala et al. demonstrated regional metabolic increases in the right temporal and bilateral parietal cortices through increased uptake of ethyl cysteinate dimer (ECD) 1 week after ECT completion21.
3. Electroencephalography: The EEG method detects the brain’s electrical activity, indicating changes in the functional integrity of the cerebral cortex. Signals measured during and after ECT may reflect the biological mechanism
underpinning this treatment. A short-term increase in delta and theta power was visualized immediately after ECT; however, at a 2-month follow up, effective ECT forms produced an increase in delta power in prefrontal region22. Responders to ECT display higher amplitude, synchronous, and symmetrical ictal EEG
changes, which were positively correlated with reductions in Hamilton Depression Rating Scale (HDRS) or Brief Psychiatric Rating Scale (BPRS)
scores23. Furthermore, Nobler et al. reported that the postictal suppression after each ECT session is correlated with clinical improvement24.
Neuro-biochemical: Administration of ECT dramatically, but transiently, increases neurotransmission, resulting in the release of various chemicals such as transcription factors, hormones, neurotropic factors and neurotransmitters25. These will be summarized
below.
1. Neurotropic: Mounting evidence suggests a role for neurotropic factors in the
pathophysiology and management of psychiatric illnesses. Brain-derived neurotropic factor (BDNF) is a nerve growth factor that mediates growth,
proliferation, survival, and renewal of neurons. Meta-analyses reveal lower levels of BDNF concentration in depressed patients than in healthy controls26; while increases in peripheral BDNF after ECT treatment have been reported, they do not necessarily correlate with improvements in symptoms25. Moreover,
Kondratyev et al. reported that repeated exposure to electroconvulsive shock (ECS) significantly increases transcription of the gene encoding fibroblast growth factor-2 (FGF-2) in the frontal cortex as well as the nerve growth factor (NGF) in the limbic system, serving a neuroprotective function27. Vascular endothelial growth factor (VEGF), which stimulates endothelial proliferation, angiogenesis, and vaso-permeability, also deserves further investigation into its role in
mediating ECT’s therapeutic effects28.
2. Hormones: The hypothalamic-pituitary-adrenal (HPA) axis has been found to be
levels. Utilizing dexmethasone suppression testing, Hayes and Ettigi noted that, “…dexamethasone does not suppress cortisol levels in depressed patients as compared with normal subjects”29. Elevated cortisol levels have been implicated in the atrophy of neural structures, impairment of neurogenesis and gliogenesis, and thereby, inhibition of neuroplasticity. Patients with MDD who respond to ECT display a reduction of cortisol levels over time25.
3. Neurotransmitters: Disordered monoaminergic transmission has been
hypothesized as one of the pathophysiological mechanisms of major depression. Post mortem studies found decreased concentrations of noradrenaline, and
increased alpha-2-adrenoreceptor binding. Rodent studies suggest that ECS might mediate its therapeutic effects by enhancing noradrenaline release. This results in a decrease of alpha-2-adrenoreceptors in frontal-cortical areas projecting to the amygdala and hippocampus, structures respectively associated with the
processing of emotions and memory.
Several lines of evidence point to the involvement of dopaminergic mechanisms in the pathophysiology of mood disorders4. In Parkinson’s disease, repeated ECT treatment is correlated with a significant increase in cerebrospinal fluid (CSF) concentrations of the main metabolite of dopamine: homovanillic acid (HVA)4. In the rat brain, each administration of ECS resulted in the acute
elevation of dopamine levels30 and increased D1 receptors31, reflecting a
connection between ECS/ECT and dopaminergic effects. Reduced dopamine binding is visualized in structures including the substantia nigra, striatum,
thalamus, and anterior cingulate of MDD patients25. Thus, as Landau et al. suggest, increased dopaminergic transmission after ECT might play a therapeutic role in ameliorating symptoms of mood disorders and Parkinson’s disease32.
An important neuromodulator in both physiological and pathological conditions, serotonin (5-HT), is hypothesized to play a significant role in
depression25. Studies of tryptophan depletion, which is associated with decreased levels of serotonin, have consistently shown that recovered depressed patients experience symptomatic relapse in response to the release of serotonin precursors. Electrophysiological studies using rats, which are not depressed, report that repeated administration of ECS increases sensitivity of the post-synaptic-5HT1A
receptor subtype in limbic structures33. While ECT’s effects on the serotonergic system are still debated, the role of serotonin in indicating the therapeutic efficacy of ECT in depressed patients is highly likely.
Neuroplasticity- While psychiatric disorders have been associated with changes in the volumes of certain neural structures, studies also provide evidence of structural change in the brain as a result of ECT administration. ECT has been shown to excite
synaptogenesis, neurogenesis, dendrogenesis, gliogenesis, and angiogenesis25. Abbott et al. found that the reduction in depressive symptoms correlated with increases in right hippocampal connectivity in patients after ECT. Additionally, the study reported an increase in the volumes of structures such as the right hippocampal cornu ammonis, dentate gyrus, and subiculum34. Joshi et al. provide evidence of increased structural
plasticity in the amygdala after ECT treatment with associated improvements in
depressive symptoms. High-resolution motion-corrected images of brain structures reveal a change in amygdalar shape after electroconvulsive therapy. Figure 2 illustrates this change in patients after each ECT course35.
Figure 2.Longitudinal effect of ECT on local amygdalar shape. Top left panel shows significant local bilateral expansion in the dorsomedial amygdala as well as the left basolateral amygdala in patients across treatment time points. Top right panel shows significant expansions in the left basolateral amygdala in patients at T3 compared to T1. Figure and caption obtained from Joshi, 201635
The brain is organized into networks that are integral to the functions of the nervous system; these networks’ connectivity are reported to change among patients suffering with depression25. Leaver et al. found that ECT administered to depressed
anterior cingulate, to levels that are similar to those seen in control subjects. This normalization of functional connectivity with ECT was associated with clinical
improvement of depressive symptoms36. While many mechanisms potentially explicate the physiological changes brought upon by the application of electroconvulsive therapy, certain conclusions are yet to be made. These suggestions for therapeutic action might not necessarily be mutually exclusive, but, in fact, multiple avenues of physiological and anatomical changes could combine to promote the changes enabled by ECT.
Anesthesia
Since its inception in 1938, electroconvulsive therapy had been conducted without anesthesia for more than 20 years because modern medications and anesthetic techniques were yet to be introduced. When ECT was implemented without anesthesia and muscle relaxants, as many as 40% of patients incurred severe injuries including fractures, late onset seizures, teeth damage, and cardiovascular abnormalities. When modern anesthetic agents were developed, they were added to the ECT treatment protocol. Some increased risks associated with modified ECT include, but are not limited to, intracranial
hypertension, intracranial lesion, cerebral aneurysm, myocardial infarction, heart failure, etc. Necessitating standard American Society of Anesthesiologists monitors and
medications, general anesthesia has become an integral component of ECT. Comprehensive monitoring for heart rate, blood pressure, ECG, capnography, and temperature are essential to the ECT setting as well as resources for the support and
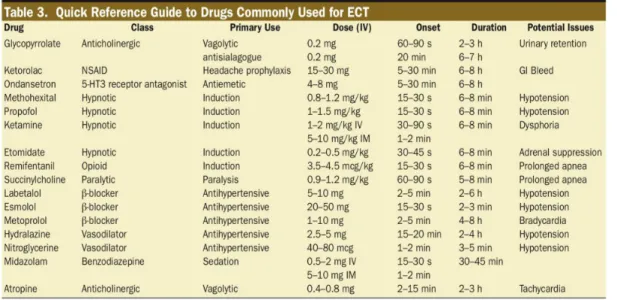
resuscitation of unconscious patients. Table 1 lists common drugs utilized during the procedure37.
Table 1. Drugs Commonly Utilized in ECT Procedures.
Table 1 obtained from Bryson, 201737
ECT treatment elicits a cardiovascular response that results from increased activation of both divisions of the autonomic nervous system. Parasympathetic activation in the tonic phase prompts bradycardia that lasts approximately 10-15 seconds38.
Immediately following is the clonic phase, which is stimulated by a centrally mediated sympathetic response39, resulting in tachycardia and hypertension40. Direct sympathetic activity results in catecholamine release, which transiently increases systolic pressure by 30-40%, and heart rate by 20% or more40. As such, the rate pressure product, which serves as a measure of myocardial oxygen consumption, increases by two- to four-fold41. Table 2 summarizes the physiologic responses to ECT40.
Table 2. ECT Induced Physiological Responses
Common Physiologic Responses and Side Effects Associated with Electroconvulsive Therapy
Variable Response
Central Nervous System Increased blood flow velocity, intracranial pressure, and cerebral metabolism; dizziness, amnesia, confusion, agitation, and headaches
Cardiovascular System
Increased blood pressure, heart rate, and cardiac output; cardiac arrhythmias
Musculoskeletal System
Myoclonic-toxic contractions, bone fractures/dislocations, muscle and joint pain
Miscellaneous Responses
Increased salivation, nausea and vomiting, dental damage, and oral cavity lacerations
Table 2 obtained from Ding, 200240
The ideal anesthetic agent should achieve rapid induction, brief duration, and safe recovery without compromising seizure activity. As seizures serve as the therapeutic agents of an ECT course42,the duration of a seizure might be a potent indicator of therapeutic efficacy43. Depressed patients experience optimal clinical outcomes if their EEG seizure activity lasts anywhere between 25 and 50 seconds. Seizure activity lasting less that 15 seconds or greater than 120 seconds produces a less favorable response44. Associated anesthetic properties, influence on seizure duration, differential effects on hemodynamic parameters, and effects on clinical outcomes are some of the many factors that determine the choice of anesthetic agent45.
As many of the anesthetic agents inherently have anticonvulsant properties, they achieve a dose-dependent increase in seizure threshold. Defined as the minimal electrical intensity required to produce a generalized seizure of a specified minimal duration, seizure threshold is reported to vary among patients by more than 40-fold46. Henry et al. state that, “the initial dose of electricity should therefore be chosen to deliver a
moderately supra-threshold stimulus” for therapeutic efficacy46. The authors also noted that stimulus intensities excessively exceeding seizure threshold are associated with memory difficulties and confusion4. Moreover, they suggest that a stimulus intensity 250% above seizure threshold in right unilateral ECT can achieve a reasonable balance between treatment efficacy and adverse cognitive effects. As US ECT machines are capped at 576 mC, patients with higher seizure thresholds will not have a markedly supra-threshold treatment. Therefore, if ECT administration is standardized (all patients receive the same amount of electrical charge for treatment), patients with higher seizure thresholds might not receive efficacious treatment 44. Anesthetic choice, dose, and resultant effects on seizure threshold and systemic as well as cerebral hemodynamics must be carefully balanced to achieve a safe, effective ECT treatment that minimizes antagonistic effects and optimizes therapeutic outcome40.
The first class of hypnotic agents utilized as anesthesia for ECT were the
barbiturates. Methohexital is the most widely used and recommended oxybarbiturate for ECT in the United States today39. Although barbiturates are short acting agents that
increase seizure threshold and decrease seizure duration, methohexital has the least effect on these factors45. Recommended dose for ECT induction ranges between 0.75 to
1.0mg/kg47. Onset of action occurs within a few seconds with effects lasting between two to eight minutes. Divided doses of methohexital have been suggested to minimize its anticonvulsant effects, extending seizure duration and improving outcomes48. Thiopental is an alternative barbiturate to methohexital for ECT anesthesia; however, it is associated with a shorter seizure duration. It is also associated with a higher frequency of
arrhythmia, sinus bradycardia, premature atrial contractions, and premature ventricular contractions than methohexital49.
Comparable to both methohexital50 and thiopental51, but with a shorter seizure duration, Sevoflurane has also been considered as an anesthetic option for ECT. A a volatile anesthetic, Sevoflurane, ensures rapid induction as well as emergence from anesthesia because it has a low blood-gas solubility with a partition coefficient of 0.6552. In some patients52, Sevoflurane has the effect of prolonging the Q-T interval53.
Elongation of the QT interval can potentially trigger arrhythmias when sustained and is associated with ventricular tachycardia54. The use of Sevoflurane in patients who are taking adjunct antidepressant therapy is thus carefully monitored as antidepressant therapy can also prolong the interval53.
Propofol has also been explored as an anesthetic agent for ECT. It has similar pharmacokinetics to methohexital, and as such, ensures rapid onset of anesthesia. After injection of a single bolus dose, the agent distributes to the central nervous system in the form of lipid deposits; anesthesia lasts for 8 to 10 minutes before patients regain
inactive compounds. In addition to its anti-emetic properties, propofol can also have antipruritic, anxiolytic, bronchodilatory and anti-epileptic effects55.
Another commonly used anesthetic agent, ketamine, is a derivative of
phencyclidine (PCP). Serving analgesic purposes in subanesthetic doses, this anesthetic is the most powerful N-Methyl-D-aspartate (NMDA)-receptor channel blocker available. Not only does ketamine act as PCP’s noncompetitive antagonist, but in interacting with a second membrane-associated site, ketamine also limits the frequency of channel opening. Although both the racemic mixture and S-enantiomer are marketed in some countries, only the racemic mixture is clinically available in the United States. After higher doses, such as an IV bolus dose of 0.9 to 1.1mg/kg, patients reach peak plasma levels and undergo a state of general anesthesia within 60 to 90 seconds. Apart from its role at the NMDA receptor, ketamine produces sympathomimetic action with increased
catecholamine release and decreased reuptake37. Recent studies have found that ketamine possesses a rapid antidepressant effect in treatment-resistant depressed individuals56. Ketamine-induced NMDA receptor antagonism of gamma-aminobutyric acid
(GABA)ergic interneurons activates glutamate release. Ensuing molecular and cellular responses, which stimulate processes such as synaptic potentiation and secretion of BDNF, may be important mediators of the antidepressant response to ketamine57.
Remifentanil is a potent opioid with analgesic properties58 that has also been proposed as an anesthetic option for ECT. Rather than serving as a choice for
postoperative anesthesia, this agent is utilized for procedures with intense pain37. This analgesic has a rapid onset and offset of action with 3.65 minutes as the time needed for
50% reduction in effect site concentration. Opioids are currently under study for treatment resistant depression as they have limited effects on seizure threshold. Remifentanil is usually the agent of choice for patients who have higher seizure thresholds because it has low anticonvulsant tendencies37.
Opioid analgesics such as remifentanil can serve as intravenous adjuvants to benzodiazepine anesthetic agents. A benzodiazepine commonly used in clinical
anesthesia is midazolam. In a double-blind randomized trial, Avramov et al. analyzed the sedative and analgesic effects of remifentanil alone versus that combined with different doses of midazolam (2mg, 4mg, or 8mg). The researchers reported that optimal sedation and analgesia were achieved when remifentanil was combined with 2mg midazolam59.
Potentiating GABA’s neural inhibition, benzodiazepines are associated with effects such as sedation, reduced anxiety, and muscle relaxation. Not only is midazolam rapidly distributed, it has a relatively quick clearance with an elimination half life approximately between 1.7 and 2.6 hours60. As benzodiazepines are known for their anticonvulsant properties, which interfere with seizure induction by increasing seizure threshold37, they
METHODS Search Strategy
As this systematic review aimed to examine the effects of different anesthetic agents on ECT’s therapeutic efficacy, literature searches for randomized controlled trials and crossover trials were conducted. Articles were obtained for inclusion using searches in the PubMed, Web of Science, and Google Scholar databases. Search procedures were extensive with selective use of syntax and parameters to identify all articles for initial title and abstract screening. Terms and markers utilized in the research are described below. PubMed
In all of the searches in this engine, the Search Builder included
“Electroconvulsive Therapy [AND] Anesthetic Agent”. For the term, “Electroconvulsive Therapy”, the following markers were selected as Mesh terms to add onto the PubMed search builder: Adverse Effects, Analysis, Cerebrospinal Fluid, Classification,
Complications, Drug Effects, Economics, Education, Epidemiology, Ethics, Etiology, History, Injuries, Instrumentation, Legislation and Jurisprudence, Manpower,
Metabolism, Methods, Mortality, Nursing, Organization and Administration, Pharmacology, Physiology, Psychology, Standards, Statistics and Numerical Data, Supply and Distribution, Therapeutic Use, Therapy, Trends, Utilization and Veterinary. Through all the PubMed searches, these Mesh terms were consistently bridged under the overarching search words: Electroconvulsive Therapy.
As PubMed failed to create a separate option to insert into the Search Builder for Methohexital, the same Mesh terms as those indicated for “Electroconvulsive Therapy”
were exclusively selected for this anesthetic agent. For all other induction drugs, the name generated a choice word that could be designated in the Search Builder. Web of Science & Google Scholar
To initially identify all related articles in the Web of Science, the search phrase included: “Electroconvulsive Therapy [AND] Anesthetic Agent”.
In the search engine, Google Scholar, two different phrases were employed to identify articles. While the first phrase stated “Electroconvulsive Therapy [AND] Anesthetic agent (name of agent)”, the second phrase was reversed in order to read, “Anesthetic agent (name of agent) [AND] Electroconvulsive Therapy”.
The web-based software tool, Covidence, was utilized for citation screening, full text reviews, and the extraction of studies in this review. Each reviewer independently sorted through all citations for applicability, inclusion criteria, and validity and finalized the data extraction. Two rounds of title and abstract screening were conducted to identify potentially relevant articles. Reviewers always discussed and reached an agreement before excluding studies.
Study Selection
Studies
Randomized controlled trials (RCTs) and crossover trials that fulfilled the following criteria were included: trials that assessed different agents during general anesthesia for ECT and their effects either on seizure duration and/or depression rating scales. The studies with the following anesthetic agents were included: Methohexital,
Propofol, Ketamine, Remifentanil, Sevoflurane, Midazolam and Thiopental. Trials had to be double-blind (i.e., clinicians and patients are unaware of treatment conditions) with either crossover or parallel-arm designs. Studies written in English and published between1975 and December 31st of 2017 were accepted.
Studies meeting the following criteria were excluded:
1. Prospective and retrospective cohort studies, quasi-randomized studies,
dissertations, theses, systematic reviews, commentary articles and abstract only documents.
2. Open and single blind trials.
3. Trials published prior to 1975 and after December 31st, 2017 and not written in
English. Participants
Trials with 15 or more adult volunteers (≥ 18 years) with a primary diagnosis of Major Depressive Disorder according to Diagnostic and Statistical Manual of Mental Disorders –IV (DSM-IV) and equivalent diagnoses of the International Classification of Diseases (ICD)-10/ICD-9 were included. Studies with less than 15 adult volunteers who did not have a primary diagnosis of Major Depressive Disorder were excluded.
Treatment Variables
Included RCTs and crossover trials compared different induction agents used prior to the administration of ECT, including:
1. Intravenous sedative or hypnotic agent versus another intravenous sedative or hypnotic agent.
2. Intravenous sedative or hypnotic combined with a muscle relaxant versus another intravenous sedative or hypnotic combined with the same muscle relaxant. Outcome Measures
Primary Outcomes
1. ECT-induced seizure EEG and motor duration in seconds.
2. Clinical remission of depressive symptoms, Hamilton Depression Rating Scale (HDRS) with a score of ≤ 7 for the 17-item version of ≤ 8 for the 21-item version, ≤ 9 for the 25-item version61.
Data Extraction and Analysis
All data were assessed and recorded by two independent reviewers: one, a board certified psychiatrist and ECT practitioner (M.E.H) and the other, a graduate student (S.R.). The ten studies included in this review provide data before and after the
application of the intervention or control measure. All papers included at least one control group and one treatment group. In five studies, the treatment and control group each consisted of one anesthetic agent. Five out of twelve studies combined two anesthetic agents into one interventional measure.
Meta-analyses utilize the effect size statistic to compare quantitative results from different studies. While p values are calculated to analyze whether observed difference between treatment groups is likely due to chance, the effect size dictates the magnitude of the difference between groups. Standardized mean differences (SMD) and their 95% confidence intervals were calculated as effect size indices for the seizure duration and
HDRS scores. Standardized mean difference, or Cohen’s D, is defined by Kelley and Preacher as:
= −
where describes the mean of the jth group and is pooled estimate of the experimental and control groups62. An extent of difference between the means for two independent groups is thus operationalized by the standardized mean difference. Effect sizes of treatment arms affecting seizure duration in different studies were combined to create single pair-wise comparisons. Cohen’s d values for both EEG and motor seizure duration were calculated as the difference in means of the seizure duration divided by the pooled standard deviations between the two treatment groups.
In order to evaluate changes in depression scores pre- and post- treatment, the effect size for the pretest-posttest-control (PPC) design is theoretically most applicable. This index allows for the estimation of treatment efficacy over a period of time when the control and treatment groups are dissimilar. This comparison of pre-post depression scores in the treatment group to those in a group without the intervention quantifies the magnitude of the interventional effect. The PPC design maximizes relevant quantifiable information in the trials by using pre-ECT depression scores, post-ECT depression
scores, standard deviations, and number of participants in each control and treatment arm. While Becker provides an effect size measure called gppc1 for the PPC design,
This equation relays a better estimate of the population standard deviation as it
assembles data from both treatment and control groups. Although, Morris’s PPC design would have been most accurate, in order to obtain confidence intervals for the effect sizes, Kelley and Preacher’s Cohen’s d equation was utilized for depression scores. Using the change in depression score (before and after ECT) as the mean, the means and pooled standard deviations of the two treatment groups were used to find the Cohen’s d index. As suggested by Zhang and Han, the standard deviation of depression score change for each group was found using the following equation where B stands for baseline standard deviation64:
All seizure duration times, scores from the HDRS, change in scores, and standard deviation values were entered into the Practical Meta-Analysis Effect Size Calculator established by Dr. David Wilson of George Mason University65. Resulting Cohen’s d
indices, variance, and confidence intervals were then utilized to find combined effect sizes for the meta analysis.
Data were analyzed using the random effects model, accounting for clinical heterogeneity, unpublished studies, and research possibly overlooked in the literature search. Meta analytic statistics using the standardized mean difference were obtained from the presentation, “Introduction to Meta-Analysis”, by Dr. Charles DiMaggio of Columbia University66. The weight of each study was calculated using the following equation:
The following equation was utilized to find combined effect size:
Confidence Intervals were found using these equations:
95% Confidence Intervals:
Heterogeneity was measured using the Chi-squared and I-squared statistics. Values of p < 0.1 for the Chi-squared, and > 40% for the latter were indicative of
The following equation was utilized to find I2: I2= 1- df/Q
RESULTS Description of Studies
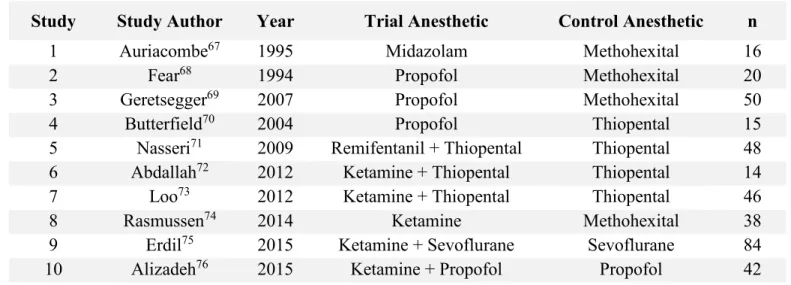
132 articles were screened, 10 trials published between 1994 and 2015 met study criteria and were included in this review. 373 participants with MDD were included in these trials. For the purposes of this thesis, studies were included if they assessed at least one of these outcome variables: impact on seizure duration and/or change in depression rating scale scores. Table III summarizes the included studies and their treatment groups
2
6
Table III. Included Studies and Treatment Groups
Study Study Author Year Trial Anesthetic Control Anesthetic n
1 Auriacombe67 1995 Midazolam Methohexital 16
2 Fear68 1994 Propofol Methohexital 20
3 Geretsegger69 2007 Propofol Methohexital 50
4 Butterfield70 2004 Propofol Thiopental 15
5 Nasseri71 2009 Remifentanil + Thiopental Thiopental 48
6 Abdallah72 2012 Ketamine + Thiopental Thiopental 14
7 Loo73 2012 Ketamine + Thiopental Thiopental 46
8 Rasmussen74 2014 Ketamine Methohexital 38
9 Erdil75 2015 Ketamine + Sevoflurane Sevoflurane 84
10 Alizadeh76 2015 Ketamine + Propofol Propofol 42
Table IV summarizes the effects of anesthetic agents on motor seizure duration.
Table IV. Effect of Anesthetic on Motor Seizure Duration
Study Effect Size Statistic Effect Size p
5 Cohen’s d -0.182 0.26
6 Cohen’s d 1.521 0.006
10 Cohen’s d 0.126 0.34
8 Cohen’s d 0.544 0.14
2
7
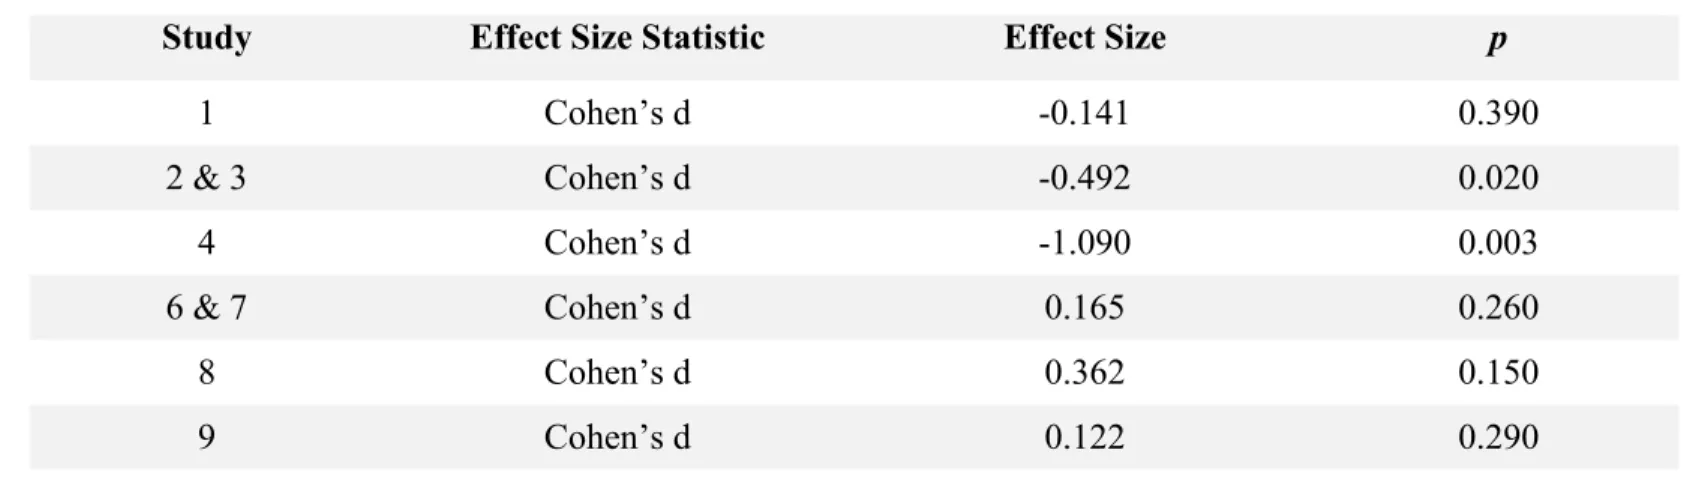
Table V presents the effect sizes of the anesthetic agents on EEG seizure duration.
Table V. Effect of Anesthetic on EEG Seizure Duration
Study Effect Size Statistic Effect Size p
1 Cohen’s d -0.141 0.390 2 & 3 Cohen’s d -0.492 0.020 4 Cohen’s d -1.090 0.003 6 & 7 Cohen’s d 0.165 0.260 8 Cohen’s d 0.362 0.150 9 Cohen’s d 0.122 0.290
Table VI summarizes the impact of anesthetic agents on the Hamilton depression scale.
Table VI. Effect of Anesthetic on Hamilton Depression Score
Study Effect Size Statistic Effect Size p
2 & 3 Cohen’s d 0.061 0.39
Thiopental
Nasseri et al. examined the effects of combining remifentanil with thiopental on seizure duration and hemodynamic changes. In the control group treated with thiopental only, EEG seizure duration was 49 (±17) seconds, while the intervention group with combined thiopental and remifentanil had a mean seizure duration of 46 (±16) seconds. A Cohen’s d value of -0.182 [-0.749, 0.385] (p=0.26) suggests that no difference exists in the seizure durations of the thiopental and the combined thiopental/remifentanil groups. Changes in depression score were not measured.
Butterfield et al. used a crossover design to measure the effects of thiopental and propofol on EEG seizure duration. While propofol group yielded a mean seizure duration of 32.8 (±15.1) seconds, the thiopental group had an average duration of 47.2 (±11) seconds. A Cohen’s d value of -1.09 [-1.857, -0.323] tells us that thiopental was correlated with greater seizure duration, suggesting that the average patient receiving thiopental is likely to have a seizure duration that is 1.09 standard deviations above that of a patient receiving propofol (p=0.003). Butterfield et al. did not measure the effects of these anesthetic agents on alleviating depressive symptoms.
Propofol
Two studies by Fear et al. and Geretsegger et al. analyzed the effects of propofol and methohexital on EEG seizure duration. The propofol treatment groups respectively produced seizure durations of 17.5 (±6.6) seconds and 44.3 (±18.9) seconds in the Fear and Geretsegger trials. Groups randomized to methohexital treatment had seizure durations of 25.5 (±9.3) seconds68 and 56.2 (±25.4) seconds69. An effect size of -0.492
[-0.968, -0.016] (p=0.02) suggests that methohexital is associated with longer EEG seizure duration68,69.
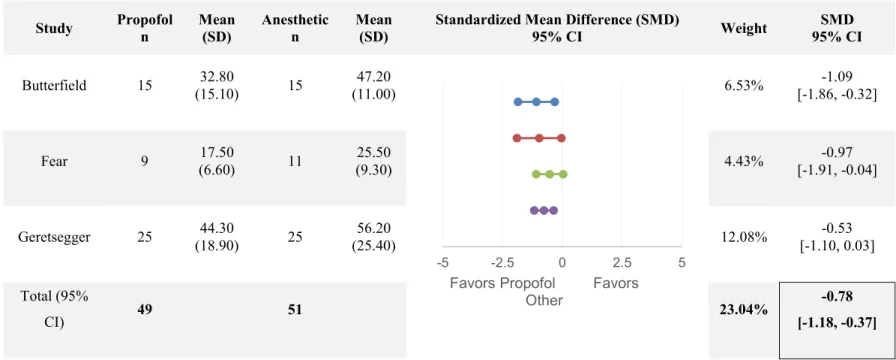
The Butterfield, Fear, and Geretsegger studies, all of which compare propofol with another anesthetic agent, provide mean EEG seizure durations. When assessed together, the three studies indicate that when compared to propofol, the other anesthetic agents, thiopental and methohexital, are associated with greater seizure durations as the combined effect size is -0.78 [-1.18, -0.37], p=0.00001. Inter-study heterogeneity was significant for EEG seizure duration (I2=81.02%).
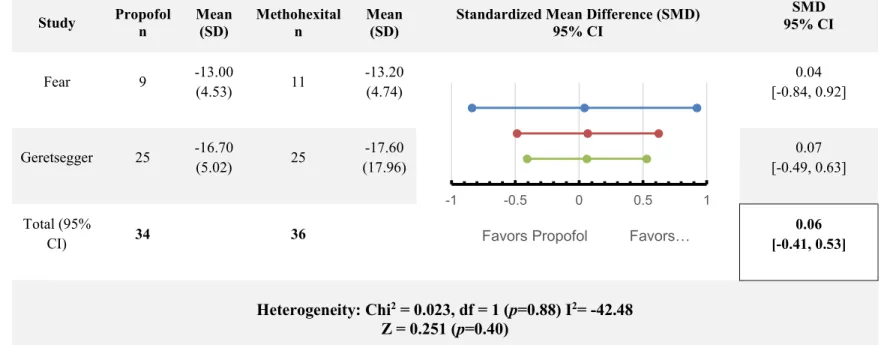
Only the Fear and Geretsegger studies utilized the HDRS score as an outcome variable. In the Fear et al. study, the propofol group had a mean depression score change of -13 (±4.526), while the methohexital group decreased by 13.2 (±4.378) points. Compared to the propofol group in the Geretsegger trial, which had a 16.7 (±5.021) point decrease in depression score, the methohexital group saw a 17.6 (±17.961) point decrease. When assessed together, the two trials indicate a lack difference between the efficacy of each anesthetic in decreasing depression scores (SMD = 0.06 [-0.41, 0.53], p=0.40).There was no significant heterogeneity for change in HDRS scores.
3
0
Table VII summarizes the combined effects of propofol versus another anesthetic agent on EEG duration.
Table VII. Propofol versus Anesthetic, Combined Effect Size of EEG Duration
Study Propofol n Mean (SD) Anesthetic n Mean (SD)
Standardized Mean Difference (SMD)
95% CI Weight SMD 95% CI Butterfield 15 32.80 (15.10) 15 47.20 (11.00) 6.53% -1.09 [-1.86, -0.32] Fear 9 17.50 (6.60) 11 25.50 (9.30) 4.43% -0.97 [-1.91, -0.04] Geretsegger 25 44.30 (18.90) 25 56.20 (25.40) 12.08% -0.53 [-1.10, 0.03] Total (95% CI) 49 51 23.04% -0.78 [-1.18, -0.37] Heterogeneity: Chi2 = 10.54, df = 2 (p=0.0051) I2= 81.02 Z = -3.74 (p<0.00001) -5 -2.5 0 2.5 5
Favors Propofol Favors Other
3
1
Table VIII presents the combined effect size from comparisons between propofol and methohexital on decrease in HDRS scores.
Table VIII. Propofol versus Methohexital, Combined Effect Size of HDRS Score Change
Study Propofol n Mean (SD) Methohexital n Mean (SD)
Standardized Mean Difference (SMD) 95% CI SMD 95% CI Fear 9 -13.00 (4.53) 11 -13.20 (4.74) 0.04 [-0.84, 0.92] Geretsegger 25 -16.70 (5.02) 25 -17.60 (17.96) 0.07 [-0.49, 0.63] Total (95% CI) 34 36 0.06 [-0.41, 0.53] Heterogeneity: Chi2 = 0.023, df = 1 (p=0.88) I2= -42.48 Z = 0.251 (p=0.40) -1 -0.5 0 0.5 1
Methohexital
Although both the Fear and Geretsegger studies found methohexital to be associated with a longer EEG seizure duration than propofol, no difference was found between the durations of the methohexital group and the midazolam treatment group67.
In the Rasmussen et al. study, the effects of methohexital and ketamine anesthesia on motor and EEG seizure duration were compared. The motor seizure duration was 38.45 (±15.69) and 28.06 (±22.66) seconds for the ketamine and methohexital groups respectively. With an effect size of 0.544 [-0.107, 1.195], ketamine is associated with an increase in motor seizure duration, which tends toward significance (p=0.05). EEG seizure duration was 57.78 (±23.64) seconds in the ketamine group and 48.95 ± (25.24) seconds in the methohexital group. Unlike the trend in motor seizure duration, there is no significant difference in electrical seizure duration between the ketamine and
methohexital groups (p=0.14). This study did not provide depression score statistics. Ketamine
While ketamine alone was compared to methohexital in the Rasmussen study, this anesthetic agent was associated with increased motor seizure duration. In contrast, a few studies evaluated the effects of ketamine combined with another anesthetic agent versus those of the primary anesthetic agent alone. In the Abdallah et al. study, the addition of ketamine to thiopental resulted in a motor seizure duration of 41.4 (±9.53) seconds whereas the thiopental only group had a duration of 30.3 (±3.97) seconds. The combined anesthetic group was thus associated with a markedly prolonged motor seizure duration
33
(SMD = 1.521 [0.332, 2.711], p=0.006)72. The intervention group in the Alizadeh et al. study was treated with combined ketamine and propofol, while the control group was treated with propofol only. Motor seizure durations were 26.2 (±5.85) and 25.5 (±5.2) seconds for the combined ketamine/propofol and propofol groups, respectively. At a p value of 0.34, no significant difference existed between the motor seizure durations of the treatment and control groups. In contrast, the mixture of ketamine and Sevoflurane in the Erdil study resulted in a slight decrease in motor seizure duration. While the combined anesthetic group had a motor seizure duration of 23.7 (±5.3) seconds, the control group treated with Sevoflurane only had a duration of 26.2 (±6.2) seconds. A standardized mean difference of -0.433 [-0.865, 0.0002] (p=0.025)75, indicates that the Sevoflurane only
group was associated with a prolonged motor seizure duration. Significant heterogeneity was found for motor seizure duration.
EEG seizure durations for the combined ketamine/thiopental group versus the thiopental only group in the Abdallah et al. study were respectively 57.3 (±14.29) seconds and 43.9 (±7.14) seconds. A significant effect size of 1.1864 [0.050, 2.322] (p=0.02) suggests that the combined anesthetic group was associated with increased seizure duration. In the Loo et al. trial, the treatment group also consisted of combined ketamine and thiopental anesthesia whereas the control group was treated with thiopental only. While the intervention group had an EEG seizure duration of 38 (±17.1) seconds, the control group had a mean seizure duration of 39 (±15.8) seconds. However, no
compared to the Sevoflurane only group with a seizure duration of 35.5 (±9.2) seconds, the ketamine/Sevoflurane combination group had a seizure duration that lasted 36.7 (±10.5) seconds. No significant difference in EEG seizure durations existed between these two treatment groups either. When all these studies are considered together, the addition of ketamine to a primary agent does not change either motor seizure duration (SMD = -0.10 [-0.44, 0.24], p=0.28) or EEG seizure duration (SMD= 0.15 [-0.18, 0.48], p=0.18). Table IX summarizes and pools the effects of combination ketamine anesthesia on EEG seizure duration.
3
5
Table IX. Ketamine + Anesthetic versus Anesthetic, Combined Effect Size of EEG Seizure Duration
Study Ketamine + Anesthetic n Mean (SD) Anesthetic n Mean (SD)
Standardized Mean Difference (SMD)
95% CI Weight SMD 95% CI Abdallah 7 57.30 (14.29) 7 43.90 (7.14) 2.98% 1.19 [0.05, 2.32] Loo 22 38.00 (17.10) 24 39.00 (15.80) 11.47% -0.06 [-0.64,0.52] Erdil 41 36.70 (10. 50) 43 35.50 (9.20) 20.96% 0.12 [-0.31, 0.55] Total (95% CI) 70 74 35.41% 0.15 [-0.18, 0.48] Heterogeneity: Chi2 = 4.02, df = 2 (p=0.13) I2= 50.25 Z = 0.91 (p=0.18) -10 -5 0 5 10
Favors Ketamine Favors Other
3
6
Table X presents the combined effect size of supplementary ketamine anesthesia on motor seizure duration.
Table X. Ketamine + Anesthetic versus Anesthetic, Combined Effect Size of Motor Seizure Duration
Study Ketamine + Anesthetic n Mean (SD) Anesthetic n Mean (SD)
Standardized Mean Difference (SMD)
95% CI Weight SMD 95% CI Abdallah 7 41.40 (9.53) 7 30.30 (3.97) 2.71% 1.53 [0.33, 2.71] Alizadeh 22 26.20 (5.85) 20 25.50 (5.20) 10.46% 0.13 [-0.48, 0.73] Erdil 41 23.70 (5.30) 43 26.20 (6.20) 20.49% -0.43 [-0.87, 0.0002] Total (95% CI) 70 70 33.66% -0.10 [-0.44, 0.24] Heterogeneity: Chi2 = 7.44, df = 2 (p=0.02) I2= 73.12 Z = -0.59 (p=0.28) -10 -5 0 5 10
Only Abdallah et al. and Alizadeh et al. measured Hamilton Depression Rating Scales before and after each ECT session using two treatment groups: ketamine combined with an anesthetic versus anesthetic alone. The group randomly assigned to combination ketamine and thiopental treatment in the Abdallah trial, had a 12.4 (±4.68) point decrease in depression score, while the control group treated with thiopental only had a 17.9 (±4.20) point decrease. An effect size of 1.237 [0.094, 2.381] suggests that combined ketamine and thiopental yields a significantly greater decrease in depressive symptoms (p=0.02).
Combination treatment with ketamine and propofol in the Alizadeh et al. study results in a 19.3 (±4.738) point decrease in depression score compared to the propofol only group with a point decrease of 21.67 (±5.07). With a standardized mean difference of 0.4838 [-0.1305, 1.0982], p=0.02, combined ketamine and propofol treatment is also associated with a greater improvement from the depressive state. When collated, the data from the two trials suggest that mixing ketamine with an anesthetic agent is correlated with a significant decrease in the Hamilton depression score (SMD= 0.65 [0.11, 1.19], p= 0.01). Significant heterogeneity was found for change in HDRS scores. Table XI presents the combined effect size of HDRS score change when ketamine is mixed with another anesthetic agent.
3
8
Table XI. Ketamine + Anesthetic versus Anesthetic, Combined Effect Size of HDRS Score Change
Study Ketamine + Anesthetic n Mean (SD) Anesthetic n Mean (SD)
Standardized Mean Difference (SMD)
95% CI Weight SMD 95% CI Abdallah 7 -12.40 (4.68) 7 -17.90 (4.20) 2.94% 1.24 [0.09, 2.38] Alizadeh 22 -19.30 (4.74) 20 -21.67 (5.07) 10.18% 0.48 [-0.13, 1.10] Total (95% CI) 29 27 13.12% 0.65 [0.11, 1.19] Heterogeneity: Chi2 = 4.03, df = 1 (P=0.04) I2= 75.19 Z = 2.36 (P=0.01) -10 -5 0 5 10
Figure 3. Funnel Plot. Effect sizes of EEG seizure duration measured in the included studies plotted against standard errors. Symmetrical plot indicates no bias.
According to the symmetry observed in the funnel plot above, there is no indication of publication bias. With a non-significant p value of 0.92, the Eger’s test confirms a lack of publication bias.
DISCUSSION
Summary
This systematic review assessed the impact of different anesthetic agents on the efficacy of ECT as measured by either seizure duration or change in the Hamilton Depression Rating Scale score. 10 trials with 373 participants were included. The following anesthetic medications or combinations were utilized in these trials: ketamine, propofol, methohexital, thiopental, midazolam, Sevoflurane, ketamine, ketamine and thiopental, ketamine and propofol, ketamine and Sevoflurane, and, lastly, remifentanil and thiopental. Out of these 10 trials, data were pooled on studies with ketamine combined with another anesthetic (four trials), those comparing propofol with another anesthetic agent (three trials), and those comparing methohexital with another anesthetic (four trials). According to this review, ketamine mixtures with propofol or thiopental appear to be the optimal choices for ECT because these combinations are associated with larger decreases in depression score than either propofol or thiopental alone. In order to effectively conduct risk-benefit analyses of using combination ketamine anesthesia for ECT, additional studies that assess side effect profiles of depressed patients treated with supplementary ketamine are warranted.
Primary Outcomes
A person’s seizure threshold is the minimal electrical dosage required to elicit a grand mal seizure. Sackeim et al. reported that higher seizure thresholds were associated
with shorter seizure durations44. Furthermore, Milstein and Small stated that patients with shorter seizure durations had less improvement in clinical outcomes than patients with longer seizure durations. Attributing it to a higher seizure threshold, the researchers claim that participants with shorter seizure durations presented relative treatment resistance77. Sackeim et al. hypothesized a couple of possible explanations to describe the relationship between threshold and treatment response.
Given that US ECT machines are capped at 576 mC, one hypothesis suggests that if all patients receive the same amount of electrical charge, then those with lower
thresholds receive a noticeably supra-threshold treatment. Conversely, for patients with higher seizure thresholds, the initial charge sufficient for those with lower seizure thresholds might not produce a seizure intensity that adequately exceeds their high threshold. As previously mentioned, the ideal stimulus dose should surpass seizure threshold by 250% to achieve a reasonable balance between treatment efficacy and unfavorable cognitive side effects4. Therefore, according to standardized ECT
administration, patients with high thresholds might not receive a therapeutic treatment44.
It has also been hypothesized that patients with higher thresholds are more
resistant to ECT because of a ceiling effect due to the rise of seizure threshold that occurs during treatment. Evidence of ECT producing a cumulative increase in seizure threshold, and, as such, a decrease in seizure duration, furthers this conjecture44. Higher stimulus intensities might not be adequately supra-threshold, but still contribute to adverse cognitive changes. As such, shorter seizure durations, which are tied to higher seizure
thresholds, are associated with less robust clinical outcomes than longer seizure durations.
Compared to propofol, methohexital enables a longer seizure duration with an effect size measure of 0.491 [0.016,0.968]. However, far surpassing methohexital’s impact on EEG seizure duration with an effect size of 1.09 [0.323, 1.857], thiopental generates the greatest increase in seizure duration. With that large an effect size, there exists an approximately 78% chance that a random participant treated with thiopental anesthesia will have a higher EEG seizure duration than a participant treated with propofol78. When considering therapeutic efficacy of ECT as measured by seizure duration, thiopental is putatively the ideal agent to use.
While adding ketamine to a primary anesthetic agent did not affect seizure duration, two trials were positive for alleviating depressive symptomatology. The
treatment groups in the two trials, ketamine mixed with thiopental and ketamine added to propofol had a combined effect size of 0.65 [0.11, 1.19], p=0.01. This combined effect size suggests that the probability of a patient in the combined anesthetic group exhibiting a larger decrease in depression score than a person in the single anesthetic group is approximately 69%78.
Limitations
This systematic review is limited by the relatively small number of studies satisfying the inclusion criteria and the small sample sizes available within these studies. Larger randomized controlled trials can better elucidate the effects of anesthetic agents on
continuous outcomes such as seizure duration and depression score. Some studies
provided limited data to assess clinical efficacy. Studies that utilized seizure duration as a proxy for therapeutic efficacy would have allowed for better interpretation of clinical outcome had they provided changes in patients’ depression scores with ECT treatment. If all studies had consistently measured seizure duration as well as depression scores, more information would have contributed to the clinical picture, and thereby, the systematic analysis of ECT efficacy.
Another limitation was the number of ECT sessions in each study. As Sackeim et al. indicate, seizure duration reduces throughout a series of ECT treatments and
eventually plateaus44. Thus, trials utilizing the final ECT’s seizure duration might miss
clinically important changes that occur earlier in the course. To extend the utility of these studies, an analysis of the correlation between seizure duration and change in depression score might be informative. In this way, a putative relationship between seizure duration and therapeutic outcome can be examined in the context of ECT treatment for MDD.
Since the depression scale score attempts to provide a direct measure of the clinical state of patients, this index serves as a more reliable indicator of ECT’s therapeutic efficacy than does seizure duration. Based on this analysis, ketamine
combined with either propofol or thiopental appears to be the optimal choice for ECT as these mixtures are associated with larger decreases in depression score than anesthesia without supplementary ketamine. Future studies that assess the side effects of
supplementary ketamine on depressed patients are necessary to perform risk-benefit analyses of using combination ketamine anesthesia in ECT treatment.
REFERENCES
1. Benac N. United States reviews safety of electroconvulsive therapy. CMAJ Canadian Medical Association Journal. 2011;183(5):E269-E270.
doi:10.1503/cmaj.109-3817
2. Abrams R. Electroconvulsive Therapy. Cary, UNITED STATES: Oxford University Press; 2002. http://ebookcentral.proquest.com/lib/bu/detail.action?docID=281369. 3. Payne NA, Prudic J. Electroconvulsive Therapy Part I: A Perspective on the
Evolution and Current Practice of ECT. Journal of Psychiatric Practice. 2009;15(5):346-368. doi:10.1097/01.pra.0000361277.65468.ef
4. Rudorfer MV, Henry ME, Sackeim HA. Electroconvulsive Therapy | Electroconvulsive Therapy | Mania. In: Scribd. ; :1865-1901.
https://www.scribd.com/doc/113689119/Electroconvulsive-Therapy. Accessed March 2, 2018.
5. Potter WZ, Rudorfer MV. Electroconvulsive Therapy--A Modern Medical Procedure. New England Journal of Medicine. 1993;328(12):882-883. doi:10.1056/NEJM199303253281213
6. Taylor S. Electroconvulsive therapy: a review of history, patient selection, technique, and medication management. Southern Medical Journal. 2007;100(5):494-498. doi:10.1097/SMJ.0b013e318038fce0
7. Slade EP, Jahn DR, Regenold WT, Case BG. Association of Electroconvulsive Therapy With Psychiatric Readmissions in US Hospitals. JAMA Psychiatry. 2017;74(8):798-804. doi:10.1001/jamapsychiatry.2017.1378
8. Vera I, Sanz-Fuentenebro J, Urretavizcaya M, et al. Electroconvulsive Therapy Practice in Spain: A National Survey. The Journal of ECT. 2016;32(1):55-61. doi:10.1097/YCT.0000000000000270
9. Nordanskog P, Hultén M, Landén M, Lundberg J, von Knorring L, Nordenskjöld A, Electroconvulsive Therapy in Sweden 2013: Data From the National Quality
Register for ECT. TheJournal of ECT. 2015;31(4):263-267. doi:10.1097/YCT.0000000000000243
10. Schweder LJ, Lydersen S, Wahlund B, Bergsholm P, Linaker OM.
Electroconvulsive therapy in Norway: rates of use, clinical characteristics, diagnoses, and attitude. The Journal of ECT. 2011;27(4):292-295.
11. Alvarez-Grandi S, de la Barra SL, Seifert A, Glue P. Electroconvulsive therapy use in Otago, New Zealand: a 10-year retrospective audit of patient-level treatment data. The Australian and New Zealand Journal of Psychiatry. 2014;48(6):548-553.
doi:10.1177/0004867413514119
12. Flint AJ, Gagnon N. Effective use of electroconvulsive therapy in late-life depression. Canadian Journal of Psychiatry Revue Canadienne De Psychiatre.. 2002;47(8):734-741. doi:10.1177/070674370204700804
13. Riva-Posse P, Hermida AP, McDonald WM. The role of electroconvulsive and neuromodulation therapies in the treatment of geriatric depression. The Psychiatric Clinics of North America. 2013;36(4):607-630. doi:10.1016/j.psc.2013.08.007 14. Electroconvulsive Therapy. In: Harvard Mental Health Letter. Vol 23. ; 2007.
https://bu.userservices.exlibrisgroup.com/view/delivery/01BOSU_INST/128556144 10001161. Accessed March 3, 2018.
15. Kanaya T, Yonekawa M. Regional cerebral blood flow in depression. The Japanese Journal of Psychiatry and Neurology. 1990;44(3):571-576.
16. Takano H, Motohashi N, Uema T, et al. Differences in cerebral blood flow between missed and generalized seizures with electroconvulsive therapy: A positron
emission tomographic study. Epilepsy Research. 2011;97(1):225-228. doi:10.1016/j.eplepsyres.2011.08.007
17. Nobler MS, Sackeim HA, Prohovnik I, et al. Regional cerebral blood flow in mood disorders, III. Treatment and clinical response. Archives of General Psychiatry. 1994;51(11):884-897.
18. Hosokawa T, Momose T, Kasai K. Brain glucose metabolism difference between bipolar and unipolar mood disorders in depressed and euthymic states. Progress in Neuro-Psychopharmacology and Biological Psychiatry. 2009;33(2):243-250. doi:10.1016/j.pnpbp.2008.11.014
19. Henry ME, Schmidt ME, Matochik JA, Stoddard EP, Potter WZ. The effects of ECT on brain glucose: a pilot FDG PET study. The Journal of ECT. 2001;17(1):33-40.
20. Nobler MS, Oquendo MA, Kegeles LS, et al. Decreased regional brain metabolism after ect. The American Journal of Psychiatry. 2001;158(2):305-308.
doi:10.1176/appi.ajp.158.2.305
21. Mervaala E, Könönen M, Föhr J, et al. SPECT and neuropsychological performance in severe depression treated with ECT. Journal of Affective Disorders.