European Commission
Directorate-General for Economic and Financial Affairs
Number 149 March 2001
A Case for Partial Funding of Pensions with
an Application to the EU Candidate Countries
by
Heikki Oksanen
∗∗Correspondence: [email protected]
___________________
Acknowledgements
I am especially grateful to Patrick Wiese of Actuarial Solutions LLC who kindly put at my disposal his Pension Reform Illustration & Simulation Model, PRISM, which I used for calculating the scenarios reported in this paper. I would like to thank Declan Costello, Kieran McMorrow, András Simonovits and Martin Werding for useful comments on an earlier draft, Cecilia Mulligan for careful editorial assistance and Karel Havik for help in handling data. I am solely responsible for remaining errors and omissions.
Views expressed in the paper are exclusively those of the author and do not necessarily correspond to those of the European Commission, for whose Directorate-General for Economic and Financial Affairs the author is working. ECFIN/192/01-EN This paper exists in English only
The paper examines the effects of ageing and makes a case for partial pre-funding of pensions. The argument is based on inter-generational fairness in a situation where pension expenditure as compared to wages increases due to low fertility and increasing longevity. We illustrate the approach by using data representing a typical EU Candidate Country of Central and Eastern Europe with a relatively high pension replacement rate. Pre-funding can take place within the public sector or in a privatised second pillar. We emphasise the need for a consistent framework to cover the many different institutional options available for pension financing.
Keywords: Pension system reform, partial pre-funding, ageing JEL code: H5
Pages
1. Introduction 1
1.1. Description of initial conditions in the CEECs 1
1.2. Outline 3
2. The basics of the PAYG and FF systems 4
2.1. Basic arithmetic 4
2.2. The respective merits of the PAYG and FF systems 6
3. Partial funding for inter-generational fairness 11
4. Scenarios for a partially funded system 16
4.1. Data and the model 16
4.2. From unsustainable expenditure increase to a new base line 18 4.3. Fairness between generations: introducing partial funding 19 4.4. Administration of the accumulated funds 22
4.5. Partial privatisation 23
4.6. Sensitivity of results with respect to fertility, longevity and
interest rates 25
4.7. A note on some previous studies 26
5. Partial funding and privatisation in a broader perspective 27
5.1. Public saving, investment and deficit 27
5.2. Health expenditure 30
5.3. Increased pension contributions and labour market distortion 31 5.4. Differences in fertility, family allowances and migration 31
6. Discussion and Conclusion 33
ANNEX: Derivation of the formulas for the fair pension contribution
rate and pre-funding 36
1. Introduction
The purpose of the present study is to examine the ageing problem in the EU Candidate Countries of Central and Eastern Europe (the CEECs). It leads to an argument for partial pre-funding of pensions, within the public sector schemes or in the newly created privately managed pillars.
The argument for partial funding is more general and could be applied to any country with a pension system with relatively high replacement rate and little or no funding. This would include almost all current EU Member States. The present paper is, however, confined to illustrations based on the orders of magnitude typical for the CEECs, and leaves it to further research to apply the approach more generally.
1.1. Description of initial conditions in the CEECs
The former socialist system left the CEECs with a legacy of relatively low retirement ages. The statutory retirement age for men was often 60 years, 55 for women, with an effective average retirement age well below these figures.
In the mid-1990s the replacement rates (measured as ratio of average pensions to average wages) were close to or above 60% in the Czech Republic, Hungary, Latvia, Poland and Slovenia; 40-50% in Bulgaria, Estonia, Romania and Slovakia; and 30% in Lithuania.
System dependency rates (pensioners/contributors) were (and still are) high, often well above 50%, much higher than in the industrialised countries.
In all the countries mentioned, pay-as-you-go (PAYG) pension systems were in operation.
The contribution rates in those countries where replacement rates are high, often topped up by other social security contributions, approached and even exceeded 50% of wages.1
This is only a snap shot of the situation pertaining in the late 1990s. Adding to challenges faced, the ageing of populations as projected in the UN forecast of 1998 presents a far more worrying picture than that envisaged in Western Europe.
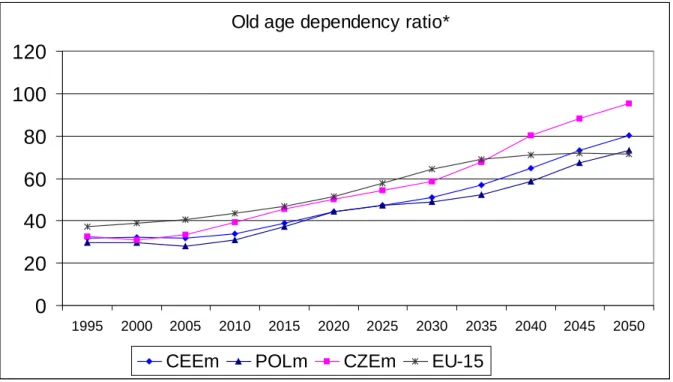
Figure 1 depicts the projected development of the old age dependency ratio (OADR), defined here as the ratio of the population over 60 years of age to 20-59 years old, in the 10 CEECs up to 2050 according to the latest UN population forecast. It rises more than the corresponding figure for EU-15 on average, still continuing to rise after 2050. The Czech Republic and Poland are depicted as the countries with the highest and the lowest paths among the 10 CEECs.
The figures in Figure 1 are based on the medium forecast, while Figure 2 gives the figures for the high and low population growth scenarios, respectively, for the average of the 10 CEECs. Even in the high growth scenario the OADR roughly doubles its current level by 2050, though in this scenario, fertility rates for most of these countries are assumed to rise to about 2.1, much higher than their current rate. In the case of the medium and low growth scenarios, the notable feature is that the OADR still continues to rise after 2050, a factor which cannot be disregarded.
Figure 1: Old age dependency ratio
Old age dependency ratio*
0
20
40
60
80
100
120
1995 2000 2005 2010 2015 2020 2025 2030 2035 2040 2045 2050CEEm POLm CZEm EU-15
CEEC = 10 Central and Eastern European Countries m = medium fertility projection
Source: UN (1998 revision)
Figure 2: Old age dependency ratio
0 10 20 30 40 50 60 70 80 90 100 1995 2000 2005 2010 2015 2020 2025 2030 2035 2040 2045 2050
CEECm CEECh CEECl
CEEC = 10 Central and Eastern European Countries m = medium fertility projection
h = high fertility projection l = low fertility projection
Figure 3: Old age dependency ratio 0 10 20 30 40 50 60 70 1995 2000 2005 2010 2015 2020 2025 2030 2035 2040 2045 2050
CYPm MALm TURm
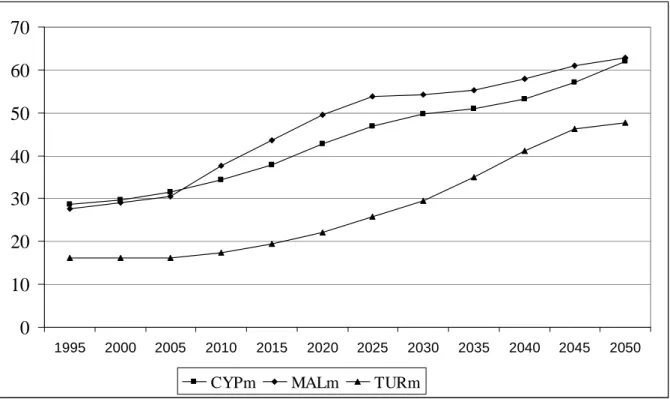
m = medium fertility projection
Source: UN (1998 revision)
Figure 3 completes the picture with medium growth scenarios for Turkey, Cyprus and Malta. For these countries, and for Turkey in particular, the OADRs are at a lower level, but in terms of projected economic effects, their rise is more significant: for Cyprus and Malta they rise almost as fast as for the CEECs, and even faster for Turkey.
To sum up, in the mid-1990s in the counties with relatively high replacement rates the cost of pensions rose in an unsustainable way, while in others, pensions were adversely hit, causing poverty among the elderly populations. The re-establishment of a social safety net became necessary.
1.2. Outline
In Section 2 we review the basic concepts of pension systems and give a short review of the literature of the respective merits of the pay-as-you-go (PAYG) and fully funded (FF) pension systems.
In Section 3 we present an argument for partial funding based on the notion of inter-generational fairness in a situation where pension expenditure as compared to wages increases due to low fertility and increasing longevity. The argument leads to a formula, which rigorously ties the contribution rate and the need for funding to the fertility rate and longevity, producing a simple and easily understandable pension reform rule.
In Section 4 we present scenarios for pension financing using data representing a typical CEEC where the pension replacement rate is relatively high, showing the need for partial funding following from the rule for inter-generational fairness. It is explained that partial
funding can take place within a public sector administered system or in a partially privatised second pillar.
In Section 5 we analyse partial funding and privatisation in a broader context of public sector finances emphasising the need for a consistent framework to cover the many different institutional options available for pension financing. There, we also make preliminary comments on related issues like health expenditure, labour market distortions and on the effects of family allowances (as a possible determinant of fertility) and migration on pension financing.
Section 6 concludes, giving the general thrust of the present paper for designing pension reforms.
2. The basics of the PAYG and FF systems
The objective here is to briefly summarise the very basic concepts needed to discuss pension systems and to give a short review of the literature of the respective merits of the
pay-as-you-go (PAYG) and fully funded (FF) systems. The basics are presented with the
help of figures that resemble the orders of magnitude in many of the CEECs, or in any country with relatively high replacement rates and high and still increasing old age dependency ratios.
2.1. Basic arithmetic
We present the basic arithmetic of pension financing with the help of stylised examples in Tables 1 and 2, presenting for each case figures representing a steady path. More substantive questions related to each mode and to transition from one system to another are discussed in later sections.
We begin by assuming a stationary population, and in the first example, all employees are assumed to work for 35 years and enjoy retirement for 15 years. The replacement rate (pension/wage –ratio) is assumed to be 70%. This is not particularly high, since in this simplified calculation, in addition to the statutory old age pension for the employee, it also includes the survivors and disability pensions that normally add to costs of old age pensions.
Under these assumptions in the PAYG system, the contribution rate to cover current pension payments is (15/35)*0.7 = 30%.
In the FF system the contributors pay a certain percentage of their wages as a contribution which is invested in a fund that earns an interest. Pensions are paid as annuities from the capital and proceeds of this fund. We calculate the contribution required to arrive at a pension of 70% of the wage (assuming that annuities are indexed to the average wage rate to get a perfect parallel to the PAYG pensions).
For a stable solution the rate of interest must be higher than the growth rate of the wage bill. This difference is most often assumed to be one to two percentage points. For the CEECs, where one expects relatively high growth rates of real wages, this order of
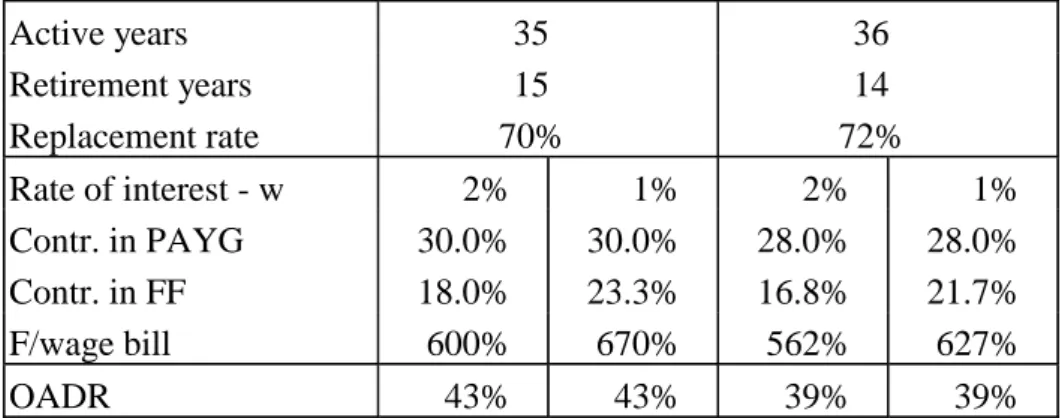
Table 1. Pension financing: steady path with a constant population Active years 35 36 Retirement years 15 14 Replacement rate 70% 72% Rate of interest - w 2% 1% 2% 1% Contr. in PAYG 30.0% 30.0% 28.0% 28.0% Contr. in FF 18.0% 23.3% 16.8% 21.7% F/wage bill 600% 670% 562% 627% OADR 43% 43% 39% 39%
Legend: w = change of the wage rate
Table 2. Pension financing: steady path with a changing population
Active years 35 Retirement years 15 Replacement rate 70% Change of population p -0.5% 0.5% Rate of interest – w 1.5% 0.5% 2.5% 1.5% Rate of interest - (w+p) 2% 1% 2% 1% Contr. in PAYG 34.0% 34.0% 26.5% 26.5% Contr. in FF 20.5% 26.5% 15.7% 20.5% F/wage bill 671% 748% 536% 600% OADR 48.5% 48.5% 37.8% 37.8%
Legend: w = change of the wage rate
magnitude should be sufficient as it maintains real interest rates above the real long term rates in EU-15 (which is a well-based assumption otherwise).
As pensions and the interest rate are assumed to be indexed to the wage rate, the wage rate is taken as the unit of account. Results drawn are thus valid for any assumptions of wage rate movements, real or nominal, or of inflation.
For an individual contributor, the pension fund first accumulates and then goes to zero after 15 years of retirement. At each point in time the fund corresponds to the actuarial value of the acquired pension rights of the employee or the rights still to be utilised by the pensioner. We aggregate over all employees/pensioners and calculate the total amount of pension funds, which is of course constant in a stationary world.
Table 1 gives the key variables as a percentage of the wage bill in both PAYG and FF systems under two alternative assumptions of sharing time between work and retirement, and of the interest rate. The (real) interest rate is either two or one percentage points above the annual change of the (real) wage rate.
Under the above assumptions pension expenditure as a percentage of the wage bill is the same in both systems. It is also, by definition, the contribution rate in the PAYG system.
Contribution rates in the FF system are considerably lower than those in the PAYG system as the proceeds from the fund make up the difference. Thus, the figures should illustrate clearly how the same expenditure is financed in two different ways in the two cases.
Lower interest rates naturally require higher contributions and a larger fund.
The latter two columns show that an extension of working life, assuming that the employee earns a two percentage point increase in pension for each additional working year, lowers the cost of pensions by roughly seven per cent.
The fund as a percentage of the wage bill varies in these examples between roughly 560% and 670%. To obtain a rough measure of what these figures mean in terms of per cent of GDP, they should be divided by three for the CEECs and by two for the more advanced economies (EU-15), this difference stemming mainly from the lower ratio of wage and salary earners to labour force in the CEECs.
Note that given the same pension rights in the two systems, the amount of fund in the FF system, which by definition matches the present value of acquired pension rights (of both current pensioners and employees), also gives the implicit liabilities of the PAYG system, also called implicit pension debt, which has to covered by future contributions (for a presentation of this and related concepts see Holzmann, Palacios and Zviniene, 2000).
Table 2 gives the corresponding figures for populations which either increase or decrease steadily by half a per cent per year. Working life is assumed to be 35 years and retirement 15 years. The assumption of the steadily rising or declining population, with the survival rates in each age group assumed to be given, means that the fertility rate is either above or below the 2.1 births per woman, which would keep the population constant.
The first example resembles the growth of populations in the 1950s and 1960s in Europe, while the latter slightly underestimates the ageing problem, as the current and expected fertility rates in the CEECs and EU-15 indicate that populations may well be starting to decline faster than 0.5% a year. Taking the decline at 0.5%, FF funds or implicit debt in the PAYG system would be around 700% of the wage bill.
The figures for the contribution rates and especially for the size of the fund under alternative assumptions give a rough idea of the orders of magnitude of key variables and display the internal logic of the two alternative financing systems. We turn next to a comparison of the two basic systems with respect to their various merits and to the much broader issue of transition from one system to the other.
2.2. The respective merits of the PAYG and FF systems
Discussion on the respective merits of the PAYG and FF systems has recently been very heated indeed, as top experts have felt the need to clarify their views and arguments. We shall review below the most important aspects and contending arguments.
The cornerstone of analysis and most influential for policy was the World Bank’s
“Averting the Old Age Crisis, Policies to Protect the Old and Promote Growth”,
published in 1994. The key recommendation was to create a mandatory, fully funded, privately managed, defined contribution, individual accounts based pillar, which would cover a large proportion of occupational pensions and hence supplement the public
PAYG defined benefit pillar, which would provide basic pension benefits. A third pillar of voluntary pension insurance, obviously fully funded, would complement the system.
The recommendation for the second pillar - the mandatory FF pensions - later became the object of particularly critical assessments, of which we want to mention four: (1) the UN Economic Commission for Europe Economic Survey 3/1999 containing papers from a seminar in May 1999, (2) Hans-Werner Sinn’s paper “Why a Funded System is Useful
and Why it is Not Useful” originally presented in August 1999, (3) Peter Orszag’s and
Joseph Stiglitz’ paper “Rethinking Pension Reform: Ten Myths About Social Security
Systems” from September 1999 and (4) Nicholas Barr’s paper “Reforming Pensions: Myths, Truths, and Policy Choices”, IMF Working Paper 00/139 from August 2000.
The criticisms triggered clarifying responses from those who advocate an introduction of a FF pillar, e.g. in a paper by Robert Holzmann entitled “The World Bank’s Approach to
Pension Reform” from September 1999.
Prior to these recent contributions, differences of opinion were often highlighted by making a comparison of the pure forms of the two systems (and sometimes, as Diamond (1999) put it, by comparing a well-designed system of one kind with a poorly designed system of the other). Thanks to serious efforts by many discussants, many questions are now more clearly formulated and answered, and the reasons behind remaining disagreements are now better understood. Thus, there is now more consensus also on policy advise than a few years ago. The merits of each system have become clearer, and consequently many economists now think that the best solution is a combination of the two systems, where details depend on the institutional environment, notably on the capacity of the public sector to administer a public pension system and to regulate a privately run system, and on the scope and functioning the financial markets. This also means that a lot of detailed work on specific aspects of designing these systems is still needed.
A review of the various points covered by this discussion is worthwhile because setting up a multi-tier system requires that the interaction of its various parts be understood to allow a coherent view of how the entire system works. The purpose is to explain the essential points as briefly and non-technically as possible, while the reviews quoted have easily extended to 20-40 pages. No attempt is made to give exhaustive references to literature as most arguments and long lists of references are found in the papers mentioned above.
1. A mandatory pension system
Whether the system is PAYG or FF, we mainly refer to the mandatory parts of pension systems. For the PAYG it is self-evident that a contract between successive cohorts to contribute to the pensions of the elderly in exchange for benefits when the contributor reaches old age has to be enforced by law. In the case of the FF system, this is not equally evident, but the argument shared by most is that it, or some part of it, must also be mandatory to avoid free-riding of those who would not save voluntarily but rather, would expect that in old age the (welfare) state would support them. Once the FF system is mandatory, the state becomes involved in it in various ways, as a regulator and guarantor.
2. Defined benefits or defined contributions
The PAYG system is often associated with defined benefit provisions, which normally means that on top of a minimum amount the pension depends on the wage history of the individual (sometimes up to a ceiling) and, during retirement, on average wage and/or inflation developments. The FF system is mostly associated with defined contributions, where the ultimate pension will depend on the contributions paid by the individual (or his employer on his behalf) and the proceeds of the invested funds.
This dichotomy is not entirely correct as the link between benefits and contributions at the level of an individual in a PAYG system can be made rather tight, if desired, even mimicing a FF system by creating a notional fund with a notional interest rate. Recent examples of this are the reformed Swedish, Polish and Latvian systems, where defined contributions are put into a notional fund with a rate of return equal to the increase in nominal wages. Also, some basically FF systems (like the occupational pension funds in the Netherlands) are defined benefit systems, with contributions adjusted according to earnings acquired (as this can be done only afterwards, it does not work exactly like a pure FF system, but roughly so). Also, if the state guarantees, as it often does, a minimum level of benefits in an otherwise defined contribution system, the system de facto provides defined benefits up to a certain level.
3. Intra-generational redistribution
PAYG systems normally include an important element of intra-generational redistribution e.g. a minimum pension level that benefits the poorest. This might be partly neutralised however, by basing the contributions on uniform survival rates for all groups while the low income retirees in reality have a shorter life expectancy.
Advocates of the FF system see it as an advantage that individual accounts help to eliminate redistribution. This may be a valid argument, but one should also note that redistribution can be reduced in the PAYG system by changing the parameters, and that a FF system, if mandatory and therefore state regulated, may also include various elements of redistribution, e.g. by setting uniform parameters for different groups, like gender.
4. Labour-market effects
As contributions to PAYG system are often paid by employers and as the link between contributions and pension at employee level is only loose, PAYG contributions are often treated like any other taxes on wages, thus causing a tax wedge between the cost of labour and income received by the employee, and a consequent loss of welfare. One of the most important arguments put forward by advocates of the FF system is that contributions to these funds can be equated with individual savings, thus avoiding any distortion of the labour market.
This dichotomy gives an exaggerated picture. Often in the PAYG system there is also a link between contributions and benefits, though not a perfect one, and it can perhaps be tightened. Furthermore, a mandatory FF system probably also causes some labour market distortion as it covers those who would not willingly save, and because uniform parameters may cause redistribution between different groups (See Sinn, 2000, pp. 400-402, and especially Orszag and Stiglitz, 1999, pp. 23-26 for more detailed analysis).
5. Administrative costs
The efficiency of each system depends, among other things, on administrative costs. Not surprisingly, they are considered to be higher in the FF system, and sometimes so high that efficiency can be questioned (Orszag and Stiglitz, 1999, pp. 29-32). Obviously, results will vary between Western countries and transition economies.
6. Does FF have higher rate of return than PAYG?
The most important – and the most controversial - argument put forward by advocates of the FF system is that a transition from a PAYG to a FF system increases welfare by improving allocation of capital, in addition to the positive effect via the labour market (point 4 above) net of possibly higher administrative costs (point 5).
For sceptics, this is not so clear. They point out that the difference between the rate of return to accumulated funds in the FF system and the implicit rate of return in the PAYG - which is equal to the rate of increase of the wage bill - has misleadingly been given as a proof of the superiority of the former. Sinn (2000, pp. 391-395) neatly develops the argument that (under certain conditions) this difference only reflects the gains that previous generation(s) received when they did not (fully) contribute to the newly established PAYG system but enjoyed the benefits. These ‘introductory gains’, as Sinn calls them, led at the time to an accumulation of implicit debt, and the difference between the two rates precisely covers the interest on this debt. The burden is either carried by all future generations or by one or more future generations through reduction of the implicit debt by cutting future pension rights or increasing contributions. Thus, Sinn (2000) shows why the difference in rates of return does not prove the superiority of the FF system over the PAYG (see also Sinn, 1997, pp. 5-8, and Orszag and Stiglitz, 1999, pp. 14-16).
The above argument assumes a uniform rate of return on financial assets. Advocates of FF maintain that transition to funding makes it possible to exploit the difference between returns on equity over bonds. However, this improves general welfare only if the rates of return on capital are generally higher with funding than without, i.e. if real capital as a whole is allocated and used more efficiently. Advocates of the FF system tend to answer this positively, as they believe that pension funds (if properly administered) improve the functioning of financial and capital markets more generally (e.g. by providing liquidity).
Sceptics do not find convincing arguments for improved allocation of capital under funding, maintaining that the distribution of financial wealth between equity and bonds is a separate matter, and that the individual accounts as such do not lead to welfare gains, as one form of debt, the implicit pension debt under PAYG, is merely transformed to explicit government debt.
The advocates of funding note that abstract models of capital markets do not provide an answer, notably in transition economies, where markets are far from perfect and funding could cause shifts in portfolios that involve pension liabilities equal to several times annual GDP (Holzmann, 1999a). They thus maintain that establishing a multi-tier system can increase welfare if properly implemented.
In turn, sceptics may sarcastically ask why, if semi-public funds like mandatory pension funds are a miracle, do governments not borrow regardless of pension financing and create trust funds that contribute to general welfare in the same fashion.
They may also doubt whether pension funds (where ownership always remains blurred) contribute positively to better allocation of capital or improved governance of enterprises (e.g. Eatwell, 1999, pp 61-62). Interestingly, the said sceptics can come from quite different schools of thought. Some neo-liberals may fear “pension fund socialism”, while some Keynesians may suspect that herd behaviour among fund managers causes harmful instability in financial markets.
7. Each system is exposed to different risks: mixture is optimal
Both systems have their relative merits in one more respect: the sustainability of the systems as a whole and also individuals in those systems are liable for different types of risks. In short, the PAYG system is vulnerable to demographic risks (i.e. burden increases if ageing shifts abruptly) and political risks, whereby at some stage the young generation may abandon the commitment to pay and leave the elderly without pensions (for a formal analysis see Cremer and Pestieau, 2000).
The FF system is naturally vulnerable to financial market risks (i.e. variations in rates of return that might be affected by any exogenous shocks), but also internally to bad management or outright corruption, a risk that should not be forgotten. It is often asserted that the FF isolates the system from demographic risks. This is true if the rate of return on the funds does not depend on demographic factors. This might be a relatively safe assumption, but in a closer analysis one should recognise that as ageing affects savings, it should also affect rates of interest. Brooks (2000) has produced simulations showing that the baby boom generation loses significantly in the FF system due to a fall in interest rates due to population ageing. The same scenario was produced in a recent Merrill Lynch report “Demographics and the Funded Pension System” (2000).
Thus, although the difference in exposure to different risks might not be so big, it still plays a role, and a mixture of the two systems is therefore probably an optimal way to reduce aggregate risk. The content and relative size of each pillar should then depend on various institutional factors and other details.
8. The real question: cost of transition to funding and inter-generational fairness
Comparing the relative merits of FF and PAYG is not sufficient to advocate switching from one system to the other. Moving from PAYG to FF inevitably means that the generation in active service during the transition will pay more than it would if PAYG were continued.
However, this is not a sufficient argument against transition to funding as one purpose for the transition could precisely be to change inter-generational income distribution in favour of future generations. Accepting this, Holzmann (1999a) gives four principal solutions for financing the transition: (1) partial default on promises, (2) use of proceeds from privatisation, (3) controlled debt financing during the early years, and (4) fiscal measures outside the pension system.
Again, it has been said that all this can also take place without individual accounts in the FF pillar. Benefits in the PAYG system can be cut, proceeds from privatisation can be placed in a fund and subsequently used for pensions, thus reducing the required contribution level. For the latter two measures the basic idea is that implicit pension debt is made explicit and then repaid by public sector savings (increased government revenue or reduced expenditure) over a period of one generation or more, as the case may be.
However, if a public PAYG system is extended to allow deviations from zero balance, then it can also be used to generate savings within the public sector and alleviate the burden of future generations. Orszag and Stiglitz (1999) call this ‘broad pre-funding’ as distinct from ‘narrow pre-funding’ under individual accounts. In both cases the current generation “pays twice” (i.e. pays for the pensions of current pensioners and for its own future pensions, or at least partly so).
As a conclusion, although inter-generational redistribution can be affected by a transition from one system to the other, the same effects may be generated by adjusting the parameters of either system. A wider analysis is required for more precise results.
To fully respect the previous literature we should still mention one important aspect that has been debated. It is the question of whether funding, whether it takes place by accumulating a fully funded pillar or within a partially pre-funded PAYG system, has an effect on aggregate savings in the economy, and hence transfers real resources from one generation to another.
Firstly, as to whether private saving decreases as a result of increase of pension funds, the prevalent view is that private savings may react negatively to increased funding, but not to the extent that it would fully offset the positive effect on the saving rate.
As to public sector saving, the answer will depend on gearing the policy more generally. In Section 5 we analyse cases where accumulation of pension funds within or outside the public sector needs to be taken into consideration in assessing public sector saving, deficit and debt.
3. Partial funding for inter-generational fairness
The review of previous literature left us puzzled as to the relative merits of each system, and to the desirability of transition from one to the other. If the general result is interpreted as favouring a mixture of the two systems, the question as to how fast and in what circumstances that transition should take place remains open.
In this section we develop a rather simple quantifiable rule according to which fairness between successive generations leads to the need for partial funding. Thus, an aspect that should be inherent in the pension system itself is the driving force, without relying on contestable arguments related to development of financial markets and improvement in allocation of resources or any other aspects outside the pension system.
The starting point is the analysis by Sinn (2000) who shows, as explained above, that the difference between the rate of return in FF and the implicit rate of return in PAYG (the growth rate of the wage bill) as such does not prove that the former is more efficient. This difference stems from the implicit debt that accumulated when the previous generations were given ‘introductory gains’, i.e. they received benefits while not having (fully) contributed to anybody’s pensions themselves. Had the first generation to benefit from pensions first contributed fully, the result would have been a FF system.
Based on this, continuation of the PAYG system can be regarded, says Sinn, as distributing the burden of past introductory gains evenly over all future generations. He considers that the conditions under which this holds are not particularly restrictive, and
he criticises various arguments put forward for a transition to a FF system. In short, a rapid transition would put a heavy burden on the currently active working population. The fairness of this is questionable (Sinn, 2000, p. 397).
Sinn (2000, p. 402-406) then moves to the demographic roots of the crisis of the PAYG pension systems: normally the working generation pays for old age pensions and for raising children, who in turn pay for the pensions of the previous generation. If the current working generation chooses not to raise as many children as the previous generation did, it is only fair that it pays part of its own pensions by saving now and reverting to those savings when retired, hence easing the burden otherwise put on the following generation, which will be smaller. This is thus an argument for partial funding.
This opening is a useful one. We shall extend it and make it operational by putting numbers on it, deriving easily understandable arguments for partial funding and for its order of magnitude in coming decades.
For the exercise we need a definition of fairness: each generation pays the same proportion of salary to get the same level of pension rights in “similar circumstances”, which we explain below.
As already seen, in a steady path (determined by demography and a constant interest rate) both FF and PAYG systems are equally fair.
Let’s first remind ourselves that such steady paths may include constantly decreasing or increasing populations. Thus, low fertility per se, and hence reducing population is not a sufficient argument for partial funding. This was illustrated in Tables 1 and 2 above where in all cases, all successive generations pay the same proportion of salary to pensions, including the case with the steadily reducing population.
However, the relevant questions arise when the pension system shifts from one steady path to another. Each such path is determined by demographic variables like fertility and life expectancy, pension system parameters like replacement rate, retirement age etc., and the interest rate. As for the latter, in the simplified world as described in Tables 1 and 2 above, where everything is indexed to the wage rate, it is the difference between the interest rate and the increase of wage bill that matters.
If any of these variables or parameters change, the system departs from the previous trajectory towards another. Depending on the arrangements, some generations may gain or lose. If the system is on a steady path, and any of these factors change, it takes at least 60 years for the system to settle down to the new steady path: this is the time required for a new entrant to the labour force to leave the system (remember that even after his death survivors pensions may have to be paid).
The crux of the matter for the next 50-60 years is that the system is not on a steady path because the demographic factors have changed and are still changing. The burden of pensions will increase particularly rapidly in the next 40 years because fertility has decreased in the recent past and will remain low, and because life expectancy is increasing.
To tackle the question of fairness between generations in a situation characterised by a shift from one (hypothetical) steady path to another, an extension of the concept of introductory gains by Sinn (2000) is useful: under a pure PAYG system, all cohorts that
paid contributions when burden was lower than what it will be when they retire, get introductory gains. Thus, not only will past and current pensioners have gained from this,
but also a large number of currently working cohorts will gain because they retire before the whole system reaches a path of still higher burden. It is only fair to ask whether this is justified, or whether the currently active should now pay in more than what is currently paid to pensioners, thus accumulating funds into a partially funded system.
We shall present a formula for partial funding (technical derivation in the annex) and illustrate it with Table 3. We assume the following:
The population is composed of children (E), adult labour (L) and retirees (R). The wage rate is taken as the unit of account. Pension is a fixed proportion (p) of the wage rate.
For simplicity we assume that each of the three phases of an individual’s life, childhood, work and retirement, are of equal length, which we define as unit period. To keep the correspondence to the real world we assume, firstly, that the unit period corresponds to 30 years, as this is the average age of women at delivery. Secondly, as work and retirement are technically assumed to be of equal length we adjust the replacement rate to make it correspond with realistic numbers: in the illustration we set the replacement rate at 30%, corresponding to 70% if working life lasts 35 and retirement 15 years.
The interest rate (r) is measured as the excess over the rate of change of the wage rate. In the example we assume that it is 50% over the unit period, which corresponds to 1.36% per annum over 30 years.
The population is assumed to have been stationary for at least two unit periods before any change in demographics. Thus in period 0 the number of E, L and R are the same, set at 100.
With these assumptions in period 0 (with stationary population), the contribution rate (c) required to balance the PAYG system is the same as the replacement rate, 30%. This is taken to provide financing on a sustainable basis.
Then, in period 1 the working population decides to bear 20% less children than their parents. This corresponds to a decline in the fertility rate from 2.1 births per woman (constant reproduction) to 1.7. All successive generations keep the fertility rate at this new level. From period 3 onwards this leads to a steady decline in the population at a constant rate of 20 % over the unit period, or by 0.7% p.a.
Scenario 1 in Table 3 illustrates a pure PAYG system if the replacement rate is kept constant. Pension expenditure as a share of the wage bill increases to 37.5% in period 2 and then stays at that level. This is also the required contribution rate.
In this scenario the adult generation in period 1 would pay 30% in contributions. Is this fair? Given their decision to have less children their descendants would therefore have to pay 37.5% of their wages in pension contributions. The working adults in period 1 would
Table 3. Pension system shifting from a steady state to a low fertility path
Initial fertility preserves a constant population. In period 1 fertility declines by 20%.
Initial replacement rate 30%.
Interest rate 50% over the unit period (1.36% p.a.)
Period 0 1 2 3 4
1 E children 100 80 64 51.2 41.0
2 L labour 100 100 80 64 51.2
3 R retired 100 100 100 80 64
4 W wage bill 100 100 80 64 51.2
Scenario 1: Pure PAYG, replacement rate constant
5 P pension expendit 30 30 30 24 19.2
6 P/W = contr. rate 30.0% 30.0% 37.5% 37.5% 37.5%
Scenario 2: Pure PAYG, contribution rate constant
7 Replacement rate 30% 30% 24% 24% 24%
Scenario 3: Partial funding, new contribution rate 34%
8 cL=total contributions 30 34 27.2 21.8 17.4 9 Interest income 0 0 2 1.6 1.3 10 Pension expenditure 30 30 30 24 19.2 11 F=fund 0 4 3.2 2.6 2.0 12 F/W 0 4% 4% 4% 4% 13 30*F/W 0 120% 120% 120% 120%
Legend: variables on lines 4-5, and 8-11 are measured in wage units.
reap the benefits at the expense of the others, while all adult generations from period 2 onwards would be treated equally amongst themselves, having the same number of children per capita and paying the same proportion of their wages to pensions.
Scenario 2 illustrates a fairer solution. In the pure PAYG system, if the contribution rate is kept constant and the replacement rate decreased correspondingly, the working adult in period 1 receive the same treatment as the successive generations: they get a lower pension because they initiated the decline in fertility. In a typical PAYG system this requires that the accrual rate determining how many percentage points of pension is earned per annum be adjusted downwards according to the decline in fertility. This change should take place already in period 1.
The decrease in the replacement rate is a straightforward solution to the ageing problem within a pure PAYG system. However, it is not the solution chosen in most countries, as replacement rates are not systematically decreased.
Scenario 3 therefore assumes a constant replacement rate of 30% and answers the question of how much the adults in period 1 should pay in order to be treated equally with all successive generations. It shows that the fixed contribution rate that must be
applied from period 1 onwards is 34%. The adults in period 1 pay into the pension system 4% of their salaries on top of current pension expenditure. This is put into a fund that produces interest from period 2 onwards. The newly created fund alleviates the burden of all successive generations, which all pay 34% as contributions. The fund as a percentage of the wage bill stays constant at 4% (or 120% of annual wage bill, to keep the simple correspondence to annual figures). Full funding in this structure requires a fund of 20% of the wage bill in the unit period (or 600% of the annual figure).
Equations (1) and (2) give the formulas for the constant contribution rate (cn, n for ‘new’)
for all future generations after a change in fertility from full reproduction to 1-sn (where sn will ultimately be the rate of decrease of population), and the amount of fund as a proportion of the wage bill (qn) thus created as functions of the given replacement rate, p, snas defined above, the interest rate, r, over the unit period (of roughly 30 years), and the
initial fund as a percentage of the wage bill, q0. Subscript o refers to the ‘old’ value until
period 0 and subscript n to ‘new’ value from period 1 onwards. This case is more general than Table 3 in that it allows for an initial fund in period 0.
(1)
(
)
0 1 r p r s q s p c n n n = + + − + (2)(
1)
0 1 r p s q s q n n n = + + −Next, recall that the replacement rate (p) in our simplified calculation is the product of the replacement rate, conventionally defined as the ratio of pension to the wage rate, and the ratio of time periods for retirement and work. The case where longevity increases and the additional time is spent on retirement can be analysed as if p increased. Note that the new values become effective in period 1 if it is realised that those working in this period will live longer, or if it is decided that the replacement rate for them is increased (thus causing in both cases an increase in pension expenditure from period 2 onwards). Equations (3) and (4) give the new contribution rate and the degree of funding, assuming for simplicity a stationary population.
(3) 0 0 1 1 1 rq p r r p r cn n − + + + = (4)
(
0)
0 1 1 q p p r qn n − − + =With the same initial values as in Scenario 3, assuming an increase in longevity such that the time on retirement increases by 10%, gives 32% as the new contribution rate (instead of 33% in pure PAYG) and an increase of funding by 2% of the wage bill over the unit period (or 60% of the annual wage bill).
The derivation of the more general formulas for the combined effects of simultaneous changes in the parameters is given in the annex.
In deriving these formulas we have made a number of simplifying assumptions, e.g. that there is a uniform, exogenously given interest rate, but this is intentional as it allows us to distinguish the most inherent and important aspects of the pension system from other aspects which merit to be analysed separately. The novelty of the formulas above is that
they give contribution rates which treat successive generations fairly when one or the other key factor in the pension system changes and the simple properties of a steady path therefore do not hold. They determine the degree of partial funding necessary to carry financing from one period to another so that each generation bears a fair share of the inter-generational burden. Clearly, the formulas also hold for extreme cases like full funding, where change in fertility, for example, does not disturb fairness.
It should be clear from the above that we have defined fairness as everybody facing the same set of key parameters paying the same proportion of her/his wage to pensions. One could explore aspects beyond these parameters and ask whether our definition of fairness is too simple. We leave this, however, outside the present approach with the conviction that, at the very least, our simple and easily understandable definition of fairness gives a benchmark for any more thorough judgements.
With these tools the following section tackles the question of pension contributions and partial funding with a data set that resembles demographic developments in CEECs.
4. Scenarios for a partially funded system
4.1. Data and the modelBased on the approach developed above, we construct scenarios for pension systems for any country which inherited a high replacement rate and encounters a significant increase in the old age dependency ratio. Most of the CEECs belong to this category.
We have two main criteria in mind when constructing the scenarios: a) the pension system should be sustainable for the next 50-100 years and b) the burden should be shared fairly between the generations as explained in the previous section.
We are using a set of annual data for a typical CEEC, on the basis of which we run scenarios up to 2100 using a actuarial model developed by Patrick Wiese, named Pension Reform Illustration & Simulation Model, PRISM (Copyright © 2000 Actuarial Solutions LLC). The model produces detailed actuarial calculations for pension expenditure and its financing, allowing numerous alternative financing systems. The model captures the cycles of yearly age cohorts, based on assumptions of fertility and survival rates, labour market participation, retirement, pension contributions as percentage of wages, pension expenditure stemming from accrued pension rights etc., just to mention the key features. Based on these assumptions and data for initial variables, the model calculates, for example, pension system revenue and expenditure, the eventual deficit or surplus and implicit pension debt. It is also able to simulate a transfer of part of the contributions and pension rights to a fully funded pillar. Most parameters are changeable, thus the model can be used to run any number of alternative scenarios to analyse the impact of a change of any policy parameter or any demographic or other assumption.
The model captures both the occupational pensions proper and survivors’ pensions allowing for alternative benefit formulas. It is detailed in that it contains e.g. labour
Table 4. Demographic assumptions for the scenarios
2000 2010 2020 2030 2040 2050
Fertility Rate 1.33 1.38 1.52 1.65 1.75 1.8
Average Lifetime Men after 60 16.4 19.7 22.0 22.2 22.2 22.2
Average Lifetime Women after 60 21.5 24.7 26.9 27.1 27.1 27.1
Old age dependency ratio* 33.2 36.7 45.3 49.3 65.6 75.7
* population 60+ over 18-59 years old, %.
market participation rates and numbers of survivors for each yearly cohort. There is no need to report all such details here as we maintain many underlying features in all scenarios and compare the results with respect to alternative assumptions on a few most interesting variables or parameters.
The model can be used to illustrate developments in the next few decades, with the post-WWII baby-boom generation retiring and small age cohorts entering into the labour force. To see clearly the consequences of this we need to simulate at least 50 years ahead in order to calculate the effects of changes in demographics, pension rights and financing modes. We extend the simulations over 100 years, which makes it possible to analyse the convergence to a (hypothetical) steady path and see whether pensions are financed in a sustainable manner, avoiding exploding debt accumulation.
The model is detailed in depicting the pension system, but it is only partial in the sense that it does not cover the interaction of the pension system with macroeconomic variables like GDP per capita growth, rate of interest or inflation. However, this can be considered a strength as in cases where we assume that pensions and all other relevant variables are indexed to wages and simply take the wage rate as the unit of account (as in the previous section). Under this assumption, the results are consistent with any development of the wage rate (or GDP per capita), and therefore powerful due to very wide applicability.2
Inflation does not matter for most variables as we assume that pension expenditure is indexed to wages.
The main driving forces are the changes in the two demographic variables, the fertility and survival rates. For fertility rates in 2000-2050 we take a rough average over the CEECs from the latest UN population forecast. The initial values for demographic variables and for the projected survival rates come from Patrick Wiese’s data set for Hungary, but as they resemble those of the UN data and forecasts for the CEECs on
2 Thus, throughout the scenarios we assume a simple indexation of pensions to average wages as this
helps us to concentrate on the effect of the replacement rate on other variables in a simple and transparent way. In reality indexation is often imperfect, one purpose being a gradual reduction of pensions as compared to wages. One model applied in some countries is 50/50 indexation to nominal wages and price level. In such cases the outcome also depends on the assumed rate of increase of real wages. Furthermore, we should combine the chosen indexation rule with alternative assumptions of the accrual rate, because these two might be inter-related. Three assumptions on these three factors would thus produce 27 different scenarios. The model we are using would allow us to run them, though there is no reason to proceed in that direction in the present paper, where the main question is how fertility and longevity should be taken into account in setting pension contributions and degree of funding. The base case could be any of those 27 combinations, so it is clearly preferable to take a case with a simple indexation rule as the base case to help make the results very general as they are independent of real economic growth.
average, our exercise is not limited to any individual country. Table 4 depicts the assumed fertility rate, life expectancy at 60 years of age for men and women and the ratio of population over 60 years to that of 18-60 years.
One important set of assumptions concerns participation rates. The model allows the user to assume any rates for each age cohort and make them change in time. In all scenarios to be reported below the participation rates for men aged 30-54 are assumed to increase from a range of 81-90% to 83-93 from 1997 to 2025 and then stay at that level, and correspondingly for women from 69-70% to 75-83%. It is beyond the scope of the actuarial model to endogenise labour market participation with respect to pension contributions or anything else and is therefore left for further studies.
The rate of interest is set by assumption and can be varied. It is assumed to be 1.5 percentage points above wage rate change. While it would be possible to present scenarios with other assumptions, below we merely comment on the order of magnitude of an effect of a change in this particular variable.
4.2. From unsustainable expenditure increase to a new base line
The starting point for the scenarios is a balance of the PAYG system in year 2000 with a contribution rate of 35.7%. The accrual rate is 1.65 percentage points per year, which gives a replacement rate of slightly below 60% after 35 years of service. In addition to old age pensions come survivors and disability pensions. The average retirement age for men is 59.5 and for women 55.5.
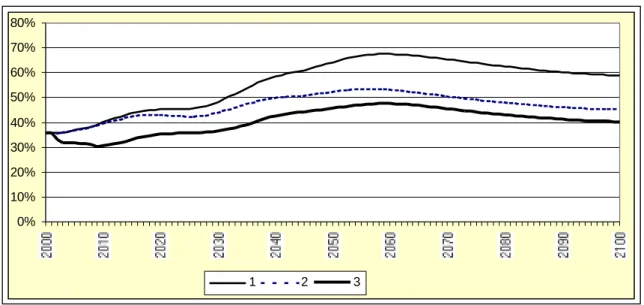
A set of three scenarios is illustrated in Figures 4 and 6. Scenario 1 is a ‘no policy change scenario’ which leads to expenditure at 45% of the wage bill in 2020, and over 65% in 2060. The implicit pension debt in 2000 is 800% of the wage bill, reflecting not only pensions in disbursement but also the rising expenditure caused by the future pensions of the current work force. The figure increases to over 1300% in 2050.
The simple conclusion to be drawn from the first scenario is that the contribution rates, given that there are also other taxes on labour income, should be rejected as economically and politically unsustainable. Even with the best controls it would most probably lead to massive evasion of contributions as people would, on good grounds, expect the system to collapse, so incentives to comply with the rules would be weak or absent. (Here we leave aside any arrangements whereby pensions are financed from other sources of public revenue causing redistribution from other groups in favour of employees/pensioners.)
Thus, the conclusion which follows is that the pension rights must be cut in one way or another. In introducing a scenario with reduced pension rights careful thought should be given to whether somebody (or some generation) is losing something. It is true that some, probably most, people will lose as compared to the mechanical historical extrapolation. However, comparing to an illusion of a continuing trend is not very relevant, and a (moderate) cut in pension rights does not necessarily mean that people would lose in comparison with anything that could in reality be possible.
In what follows we do not take a position on what the maximal sustainable level of pension rights might be, but we want to provide a method of moving in steps to arrive at scenarios that could represent a sustainable path. This way we avoid jumping to a scenario of a drastic cut in pension rights without being able to justify it as necessary. If the result of the analysis is that the expenditure is too high for one or the other financing
pattern, then we should go back and assume a further cut of the pension rights. Again, note that it is the method and the orders of magnitude we want to present rather than any precise numbers.
If the necessity to cut pension rights is the hard part of the chain of reasoning, we want to make the adjustment as softly as possible by assuming that the accrued pension rights are respected and the accrual rates are reduced only for future accumulation of pension rights. This means that expenditure reductions follow only with a lag.
Scenario 2 in Figures 4 and 5 assumes a cut of the accrual rate to 1.25 percentage points. This is a considerable cut, leading to a 44% replacement rate after 35 years of work. Note, however, that most often the pension is based on the salary of the most recent years before retirement, meaning that the base is higher than the average salary over the entire working life. Also, progressive taxation means that the cut in net pension rights is more moderate than in before tax figures.
Figure 4 shows that the effect of the cut of the accrual rate on expenditure is not big in 2020, but increases significantly afterwards. Expenditure would still be over 50% of the wage bill after 2040 showing that it is probably not sustainable.
As another element of reducing expenditure we introduce in Scenario 3 in Figures 4 and 5 an increase in retirement age. We assume that the normal retirement age for men is increased from 60 to 62, and that the average retirement age increases by 1.5 years. For women the normal retirement age is assumed to gradually increase from 56 to 62 and the average retirement age from 55.5 to 61 years by 2010. In the model these changes cause a gradual adjustment to participation rates of employees near retirement.
The effect of this cut on implicit pension debt and on expenditure after full adjustment (after 2030) is somewhat over 10%. It is not bigger because we assume that working longer gives a higher pension. However, in the first years there is an additional transitional impact on the expenditure as workers contribute longer and retire later. In 2010, for example, expenditure is more than 20% lower than in the previous scenario.
4.3. Fairness between generations: introducing partial funding
For the sake of argument we assume that pension expenditure in Scenario 3 in Figures 4 and 5 can be financed in a sustainable way. However, Figures 7 and 8 show that keeping the contribution rate at 35.7% does not provide sufficient financing in the long run. True, mainly due to increase of the retirement age, reserves are first accumulated, reaching nearly 100% of the wage bill, but in 2050 the fund turns negative and debt explodes.
In addition, keeping the contribution rate constant would not necessarily be fair. Therefore, the next step is to find a scenario in which each generation pays in fair contribution amounts with fertility and longevity as forecast (Table 4 above) taken into consideration.
The path for fairly adjusted contributions in Figure 6, Scenario 4, is based on the formula in the previous section. We assume, following the principles of a PAYG system, that at each point in time the contribution rate is uniform for all employees, starting with the
Figure 4. Pension expenditure 0% 10% 20% 30% 40% 50% 60% 70% 80% 1 2 3
Legend: all figures as a percentage of the wage bill
1. Scenario 1: no reform
2. Scenario 2: accrual rate decreased to 1.25
3. Scenario 3: accrual rate decreased to 1.25 and retirement age increased to 62
Figure 5. Implicit liabilities
0% 200% 400% 600% 800% 1000% 1200% 1400% 1600% 1 2 3
Legend: all figures as a percentage of the wage bill
1. Scenario 1: no reform
2. Scenario 2: accrual rate decreased to 1.25
Figure 6. Reformed expenditure with constant and fair contributions 20% 40% 60% 1 2 3 35.7%
Legend: all figures as a percentage of the wage bill
1. Expenditure in Scenarios 3 and 4
2. Constant contribution rate 35.7 in Scenario 3 3. Fairly adjusted contribution rates in Scenario 4
Figure 7. Reformed expenditure with constant and fair contributions: fund assets -1000% -800% -600% -400% -200% 0% 200% 400% 600% 1 2
Legend: all figures as a percentage of the wage bill
1. PAYG assets with 35,7% contributions in Scenario 3 2. PAYG assets with fairly adjusted contributions in Scenario 4
contribution rate for 2000. Thereafter, the rate is adjusted according to fertility and longevity.3
We see that the peak contribution rate will be just above 40% in 2020. Thereafter it will decrease because the effect of increased fertility is stronger than that of increased longevity.
The fund reaches 133% of the wage bill in 2020, with a maximum amount of around 270 % in the late 2040s. Due to the assumed increasing fertility of generations active after 2050 and the assumed constant longevity, the fund decreases towards the end of the century.
3 The new rate is calculated somewhat approximately in ten year intervals for the cohort in the
middle of working life, looking at past fertility and life expectancy at age 60. The adjustment in the ten year intervals is assumed to be gradual.
This amount of partial pre-funding results from a policy to make the generation working from 2000 to early 2030s pay more into the system than the current pension expenditure. Otherwise they would not pay their fair share.
4.4. Administration of the accumulated funds
We cover the question of administration of a partially funded public pension system outlined above only from the point of view of explaining whether the funds are classified within or beyond the general government sector in national accounting.
In principle the accumulated fund could be inseparable from any other government assets and liabilities, thus one component affecting government net assets or debts. A straightforward case is that where the accumulated pension funds show as a reduction in government gross debt. This is the case if government gross assets are determined by factors other than those related to the pension system.
For various administrative and political reasons, the public pension system is normally a separate sector within general government. As long as the funds are invested in government bonds, the result in national accounting is the same as above. The limiting case is one where the public, mandatory system is administered outside the government sector proper. There are such cases, with involvement of labour market partners. If the key parameters like benefit rules and contribution rates are still set by the government, these funds are classified as part of general government. Thus their surplus or deficit is a component of the general government financial balance. However, there can be an impact on gross assets and debt. If the pension funds invest only part of their assets in
government bonds and part in the private sector, then gross public debt depends on the shifts between the two.4
4.5. Partial privatisation
The reform initiatives in many of the CEECs go beyond accumulating funds in the reformed PAYG mono-pillar system by introducing multi-pillar systems with a mandatory fully funded, defined contribution second pillar. Hungary, Poland, Latvia and Croatia have legislated such systems and many others are in the process of preparing such decisions (for a review of pension reforms in transition countries see Lindeman, Rutkowski and Sluchynskyy, 2000).
Typically the new system is established by diverting a certain percentage of contributions to the second pillar. In most cases the oldest employees stay in the old system, those of middle age may choose transition, and the new system is mandatory for the youngest. For those moving to the new system the benefits to be paid from the old system are gradually reduced.
To illustrate the effects of transition to a partially privatised system, starting from year 2000, we take Scenario 4 above as the reference case, assume that total benefits remain unchanged and that a uniform rate of interest prevails for all assets and liabilities. This way we can show the pure effect of partial privatisation on key variables without possible additional effects of the change in the management structure. The transition is assumed to take place by diverting six percentage points of contributions of those who shift to the new second pillar. Half of the contributors are assumed to shift immediately and the rest follow in the two subsequent years.
The result is Scenario 5 in Figure 8, which depicts the main developments in implicit debt of the first pillar (still to be called PAYG pillar as it operates on the same principles as the mono-pillar PAYG system) and the assets of both the first and second pillars.
4 These questions do not arise in most EU countries, which have pure PAYG systems. In Finland
and Sweden the question of public pension fund management was deliberated in the late 1950s/early 1960s when partially funded systems were established. In Sweden the funds remained mostly within the public sector. In Finland, to alleviate the fear that the state would use the accumulated funds to take over ownership of production, enterprises were given the right to pay pension contributions on credit (provided that required guarantees were produced), with a scheduled repayment of the debt thus acquired. Until the early 1990s, more than half of the funds were placed this way in the enterprises. Management of the funds was designed so as to prevent domination of any specific interest. Thus, the funds operate outside the state administration under supervision of the labour market partners, i.e. both employers associations and trade unions, closely regulated by the government for the solvency of the system, but without direct interference with investment decisions. – For a description of these Finnish institutions see Lassila and Valkonen (2001). Adding to their information, it might be useful to understand that with the original rules set in the beginning of the 1960s the degree of funding would have been relatively high if there were no inflation. The funds earned a nominal rate of interest and the corrections for indexation of benefits were financed from current contributions. Inflation, especially in 1970s, then led to drastically reduced funds. Subsequently the funding rules were changed in the 1990s to guarantee about 25% degree of funding irrespective of nominal economic growth. – The Finnish case is just one example of a pension system where the long-run properties were not adequately reflected upon and the rules adopted led to inflation having a perverse effect on the system.
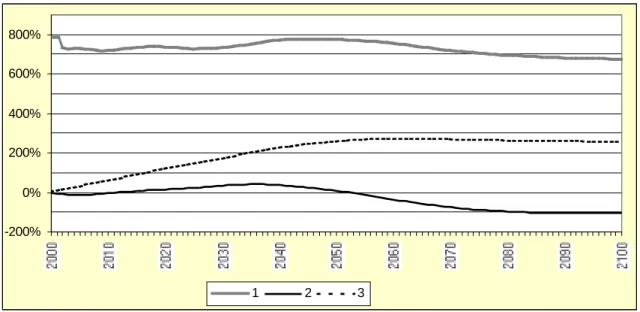
Figure 8. Partially privatised pension system: Scenario 5 -200% 0% 200% 400% 600% 800% 1 2 3
Legend: all figures as a percentage of the wage bill
1. Implicit liabilities in the first pillar 2. First pillar assets
3. Second pillar assets
The immediate effect is that the first pillar goes into deficit of 3% of the wage bill. Later, as more contributors shift to the second pillar and interest has to be paid on the accumulated debt, the deficit increases further, but subsequently, as part of the benefits are then paid from the second pillar, the deficit declines.
Our reference case has the additional element that it represents a simulation where total contributions exceed pension expenditure in the early decades, therefore offsetting part of the initial deficit in the PAYG pillar. Due to this, the peak of the deficit in the PAYG pillar, 4.5% of the wage bill (slightly over one per cent of GDP), is passed already in the second year. Thereafter the deficit declines and turns into a surplus in less than ten years. This follows from the surplus of total contributions over pension expenditure, which is highest, almost eight per cent of the wage bill, in 2010. Recall that there are various factors behind this, notably the transitional effect of the increase of the retirement age.
Partial privatisation through creation of the second pillar does not necessarily take place in a situation where partial funding was already foreseen. Therefore, the initial deficit might be a more persistent problem than in the description above. In general, the initial deficit in the PAYG pillar, and hence in the general government, depends on the size of the newly created second pillar, and on the speed of the shift of the contributors. The additional problem is that the speed of transition might be uncertain, depending on the behaviour of the contributors. This causes uncertainty also for the general government deficit, and hence for its use as a target variable in designing the fiscal policy stance.
If a shift to the second pillar is made under a binding restriction on the deficit, there is a dilemma. Assuming that the surplus created in the second pillar will be outside the general government finances, and maintaining the assumptions on pension expenditure, raising the total contributions even more in the beginning of the transition than in Scenarios 4 and 5 above becomes necessary. This raises the issue of too much burden
being put on the currently active generation. This question would be the more significant the higher the proportion of contributions to be shifted to the second pillar. The extreme case is a transition to full funding where the whole stock of implicit pension debt of 800-1000% of the wage bill would be repaid by the generation which undertakes this effort. The contribution rates required could easily be seen as unjustly high.
Thus, one has to look into a number of aspects in order to judge whether the shift to the second pillar causes a problem with the deficit and debt of the PAYG pillar, and if so, how big a deficit. We shall return to this issue below in section 5.1.
Scenario 5 in Figure 8 illustrates further how the assets of the first pillar turn positive in 2012 as the second pillar starts to provide part of the pensions and hence reduces the expenditure of the first pillar. Later, its assets again turn negative displaying the long-term pattern that total assets in the entire system are the same as in the mono-pillar case of Scenario 4: as the second pillar reaches its permanent level of assets of 260-270% of the wage bill the corresponding reduction in the PAYG assets as compared to the mono-pillar case appears.5
Overall, Scenario 5 in Figure 8 should illustrate the short- and long-term phases of shifting part of the implicit liabilities in the mono-pillar PAYG system to explicit liabilities (or to a reduction of its explicit assets as the case might be), and the accumulation of second pillar assets. The initial deficit and the possible emergence of permanent explicit debt as such should not prevent a reform creating a multi-pillar system, but these consequences should be correctly understood in designing the reform and appropriately coped with.
It should be recalled that we have described the transition to a two-pillar system assuming that a uniform interest rate prevails in both of them. If this does not hold, there will be additional shifts in disposable income between the groups covered differently by the two pillars. Of course, the whole idea with the defined contribution second pillar is that its members gain from the rate of return of its assets in the form of higher pensions, but also take the risk of lower return. With the above we sought to show the benchmark case of a uniform interest rate to highlight the pure effects of the transition on the structure of the system.
Furthermore, if there are convincing reasons to believe that the creation and functioning of the privatised second pillar increases the rate of return on capital overall in the economy, general macroeconomic effects would also ensue, extending also to effects on inter-generational fairness.
4.6. Sensitivity of results with respect to fertility, longevity and interest rates
One of the key variables determining the fair contribution rates and partial finding in Scenario 4 (and subsequently in the privatisation Scenario 5; Figures 6-8) is fertility. Naturally, its future development is unknown. Fortunately, this is not necessarily a big
5 The consistency of these figures can be confirmed as follows: when approaching a steady path in the
late 2100s the total pension debt in Scenarios 4 and 5 is about 900% of the wage bill. From the orders of magnitude in Table 2 above we know that in the hypothetical case of full funding the contribution rate would be somewhat over 20%. The six percentage point contribution to the funded pillar compared to this is the same fraction as the second pillar assets compared to total pension debt.