S1
Support Information (SI)
Charge Transfer in the Heterostructure of CsPbBr
3Nanocrystals with
Nitrogen Doped Carbon Dots
Ekashmi Rathore,1 Krishnendu Maji,1 Dheemahi Rao,2 Bivas Saha2 and Kanishka Biswas1, *
1New Chemistry Unit and School of Advanced Materials,
2 Chemistry and Physics of Materials Unit, Jawaharlal Nehru Centre for Advanced Scientific
Research (JNCASR),Jakkur P.O., Bangalore- 560064, India. *E-mail: [email protected]
Experimental section.
Reagents. Cesium carbonate (Cs2CO3, 99.9%, Sigma-Aldrich), lead (II) bromide (PbBr2, 99.9%,
Aldrich), oleic acid (OA, tech. 90%, Aldrich), oleylamine (OAm, tech. 70%, Sigma-Aldrich), 1-octadecene (ODE, tech. 90%, Sigma Sigma-Aldrich), and toluene (AR, 99.0%, SDFCL), citric acid (99.5%, Sigma-Aldrich), thiourea (99%, Sigma-Aldrich), dialysis membrane were used for the synthesis without further purification.
Synthesis of Cs-Oleate. In a 50 mL 3-necked round-bottom flask, 410 mg (1.26 mmol) Cs2CO3
and 20 mL ODE were taken and heated at 120 °C with continuous stirring under vacuum for 1 h to get a homogeneous solution. After 1 h, 1.30 mL of OA was added, and the solution was kept for another 30 min at the same condition. The vacuum was replaced with nitrogen atmosphere and kept for 5 min to get a clear Cs-oleate solution. This Cs-oleate solution was stored at room temperature under nitrogen atmosphere for further use.
Synthesis of CsPbBr3 nanocrystals. In a typical synthesis, 0.376 mmol (137 mg) of PbBr2 and
10 mL of ODE were taken in a 25 mL 3-necked RB flask and dried under vacuum for about 1 h. Then the RB is filled with N2 and 1 mL each of OA and OAm were added. Again, the flask was
S2
kept under vacuum until PbBr2 dissolved and a transparent solution is formed. The reaction
temperature is raised to 140oC under N
2 atm and 0.8 ml of previously heated (at 100oC) Cs-oleate
solution was swiftly injected. The reaction mixture become fluorescent green and after 5 min the reaction was quenched by ice bath. The synthesized CsPbBr3 NCs were then washed with toluene
and precipitated by centrifugation at 8000 rpm for 15 min, followed by dispersing the products in toluene for further studies.
Synthesis of nitrogen-doped carbon dots. 1g of citric acid and 500 mg of urea were dissolved in 25 mL of distilled water. The solution mixture was taken to an autoclave and heated at 160oC for 6 h. The prepared reaction mixture was centrifuged at 9000 rpm for 10 min to discard the larger particles. Then, the dispersion solution was dialyzed against pure water for 24 h. At the end, the final dispersed solution was vacuum- dried at 70 oC for 3 days.
Powder X-ray diffraction. The powder X-ray Diffraction pattern of all the samples were collected on a Bruker D8 difractometer by using Cu Kα (λ=1.5406 Å) at room temperature.
Transmission electron microscopy. The transmission electron microscopy (TEM) images of the synthesized CsPbBr3 NCs and CDs were taken using a JEOL (JEM3010) TEM instrument (300
kV accelerating voltage) fitted with a Gatan CCD camera and also with a FEI TECNAI G2 20 STWIN TEM instrument (operating at 200 kV).
Fourier transform infrared spectroscopy (FTIR). FTIR spectra were recorded in the range of 400-4000 cm-1 by using a Bruker Optics Alpha-P FTIR spectrophotometer equipped with an
attenuated total reflectance (ATR) module.
X-ray photoelectron spectroscopy (XPS). The measurement was done on AXIS ULTRA in the range of 0-1100 eV.
Optical measurement. Electronic absorption spectra were recorded using Perkin-Elmer Lambda 900. A FluoroMax-4 spectrofluorometer (Horiba JobinYvon Inc.) with a 5 nm slit width was used to record the photoluminescence (PL) spectrum.
Photoluminescence (PL) quenching study. 2 mL CsPbBr3 NCs solution in toluene with 1.97 x
S3
solution in toluene of dispersed N doped CDs ((12.37 - 92.59 mg/L) was added to it in each step and after the sonication at room temperature PL spectra was recorded.
Fluorescent lifetime measurement. The time-correlated single photon counting (TCSPC) method was implemented during the fluorescence lifetime measurements using the FluoroCube (Horiba Jobin Yvon, formerly IBH product) with a 373 nm LED excitation source. The TBX-04 picosecond photon-detection module was used to detect the fluorescence signal. The DAS 6 decay analysis software package (HORIBA Jobin Yvon IBH) was used to analyze the fluorescence decay, where the best decay curve fit was achieved by monitoring the reduced χ2 values and the
weighted residuals. A multi-exponential decay model was used to fit the life-time data. We obtained reduced χ2 values in the range 0.9-1.2.
𝐼(𝑡) = α1𝑒−𝑡/𝜏1 + α2𝑒−𝑡/𝜏2+ α3𝑒−𝑡/𝜏3 Eq. 1
𝜏𝑎𝑣𝑔 = ∑ α𝑖 𝑖 𝜏𝑖2/ ∑ α𝑖 𝑖 𝜏𝑖 Eq. 2
Determination of molar extinction coefficient (ε). To determine ε, the absorption of dilute solution of CsPbBr3 and CDs was collected with different concentrations. ε was then calculated
using Beer-Lambert Law: A = εCL, where, A is the absorbance, and L is the optical path length (1 cm) taken from cuvette dimension.
Current-voltage (I-V) measurement. The samples were made into square shaped pellets of uniform size and gold contacts were deposited using e-beam evaporation method. The I-V measurement was performed using Kiethley-2450 source meter. The Xe arc lamp (Oriel Newport) was used as light source to study the photo enhancement in current. The lamp was set to 150W and placed 20 cm away from the samples during measurement.
Electrochemical measurements. To calculate the electrochemical band edge energies for N-doped CD and CsPbBr3, the cyclic voltammogram was recorded under non-aqueous conditions.
The following formula was utilized to determine the experimental electrochemical HOMO and LUMO levels in terms of eV unit1:
E (LUMO) =-e [Eredonset + 4.4]
S4
where E0–0 represent the 0–0 energy, which is defined as the lowest energy transition and
that we can estimate from UV–vis and fluorescence emission spectra. We obtained a value 2.37 eV for E0-0 corresponding to 523 nm for CsPbBr3.
For CsPbBr3,
E(CB) =-e [-0.71+ 4.4] = -3.69 eV E (VB) = [-3.69 -2.37] eV = -6.06 eV
We obtained of 2.32 eV, 3.65 eV and 4.15 eV for E0–0 corresponding to 534 nm, 339 nm and
298 nm for N-doped CDs. For N-doped CDs, E* (LUMO) =-e [-0.73+ 4.4] = -3.67 eV EnC=N(HOMO) = [-3.67 -2.32] eV = -5.99 eV EnC=O(HOMO-1) = [-3.67 -3.65] eV = -7.32 eV E (HOMO-2) = [-3.67 -4.15] eV = -7.82 eV
S5
Figure S1. FTIR spectrum of (a) N-doped CDs, (b) CsPbBr3 (black) and heterostructure of
CsPbBr3 and N-doped CDs (red), and (c) zoomed version of ν(C═O) region.
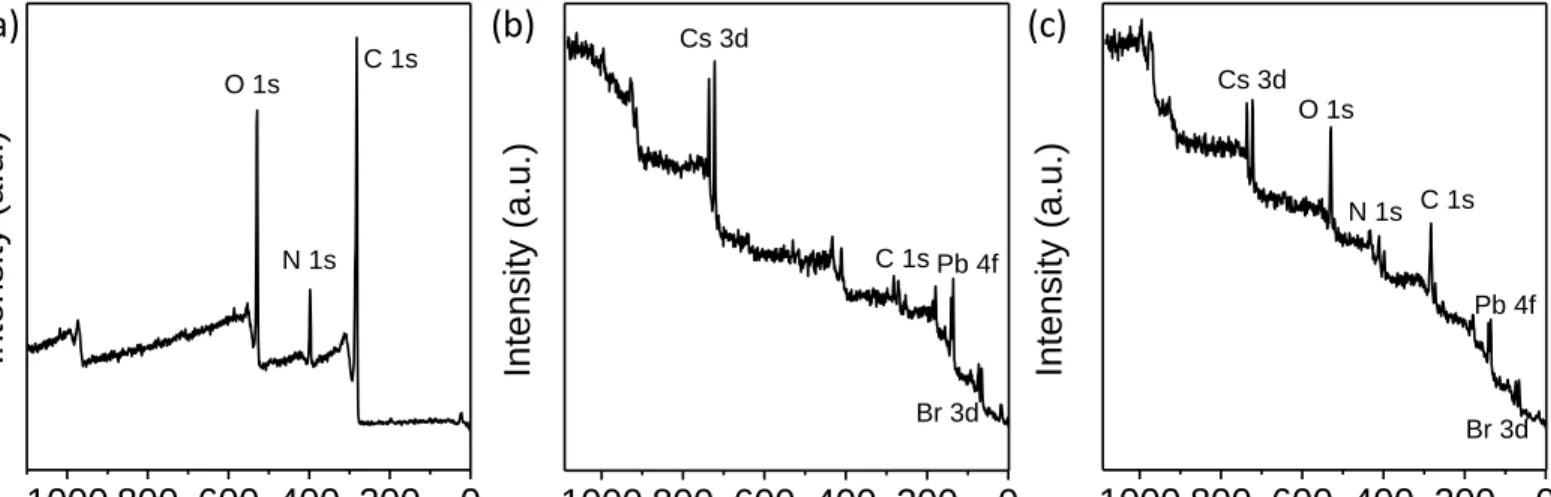
Figure S2. XPS full survey scan of (a) N-doped CDs, (b) CsPbBr3 and (c) heterostructure of
CsPbBr3 and N-doped CDs. 1000 800 600 400 200 0 Inte nsity ( a.u .)
Binding Energy (eV)
Cs 3d C 1s Pb 4f Br 3d 1000 800 600 400 200 0 N 1s O 1s C 1s Inte nsity ( a.u .)
Binding Energy (eV)
1000 800 600 400 200 0 Br 3d Pb 4f Cs 3d Inte nsity ( a.u .)
Binding Energy (eV)
O 1s N 1s C 1s (a) (b) (c) 3750 3000 2250 1500 750 65 70 75 80 85 90 95 C -N H -C CH 2 (N -H ) (C =O) (C-H) Tr ansmit tance % Wavenumber (cm-1) (O-H) (N-H) 3600 3000 2400 1800 1200 (C O O -) (C –N ) (N–H) ( N -H ) (C -H 2 ) (C =O ) (C–H) Tr ansmit
tace (a. u.)
Wavenumber (cm-1) CsPbBr3 + N-doped CDs (25 mg/L) CsPbBr3 1760 1720 1680 1706 cm-1 1713 cm-1 Wavenumber (cm-1) Tr ansmit tace (a. u. ) CsPbBr3 + N-doped CDs (25 mg/L) CsPbBr3
(a)
(b)
(c)
S6
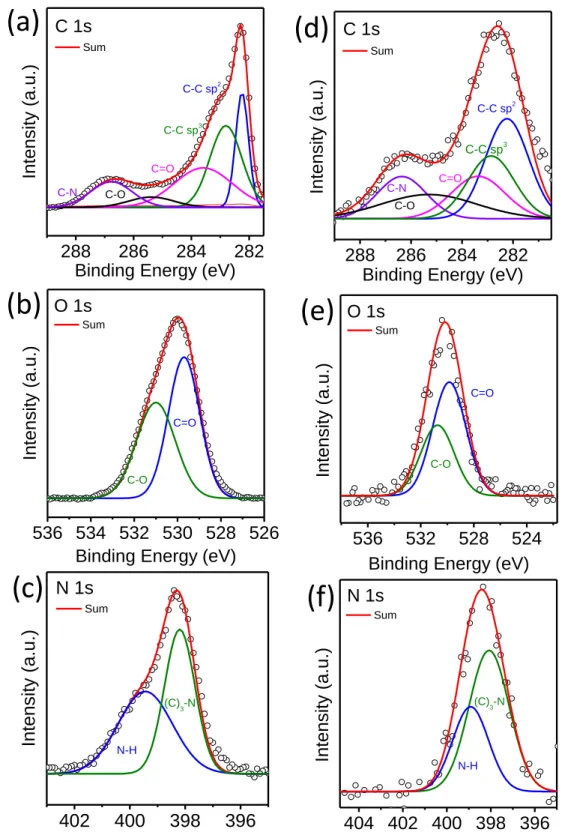
Figure S3. XPS high resolution scan of C1s, N1s, and O1s for N-doped CDs (a, b, c) and the heterostructure of CsPbBr3 and N-doped CDs (d, e, f).
536 534 532 530 528 526 O 1s C=O Inte nsity ( a.u .)
Binding Energy (eV)
Sum C-O 536 532 528 524 Inte nsity ( a.u .)
Binding Energy (eV) O 1s Sum C-O C=O 402 400 398 396 Sum Inte nsity ( a.u .)
Binding Energy (eV) N 1s N-H (C) 3-N 404 402 400 398 396 N 1s Inte nsity ( a.u .)
Binding Energy (eV)
Sum N-H (C) 3-N 288 286 284 282 Sum C=O C-C sp3 C-N C 1s Inte nsity ( a.u .)
Binding Energy (eV)
C-O C-C sp2 288 286 284 282 C 1s Inte nsity ( a.u .)
Binding Energy (eV)
Sum C-N C-O C=O C-C sp3 C-C sp2
(a)
(b)
(c)
(d)
(e)
(f)
S7
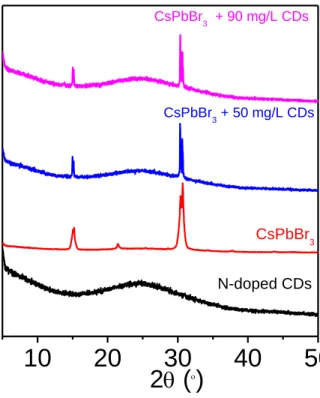
Figure S4. PXRD of N-doped CDs, CsPbBr3 and heterostructure of CsPbBr3 NCs -N- doped
CDs system.
10
20
30
40
50
2
(
)
Inte
nsity (
a.u
.)
N-doped CDs CsPbBr 3 CsPbBr3 + 50 mg/L CDs CsPbBr3 + 90 mg/L CDsS8
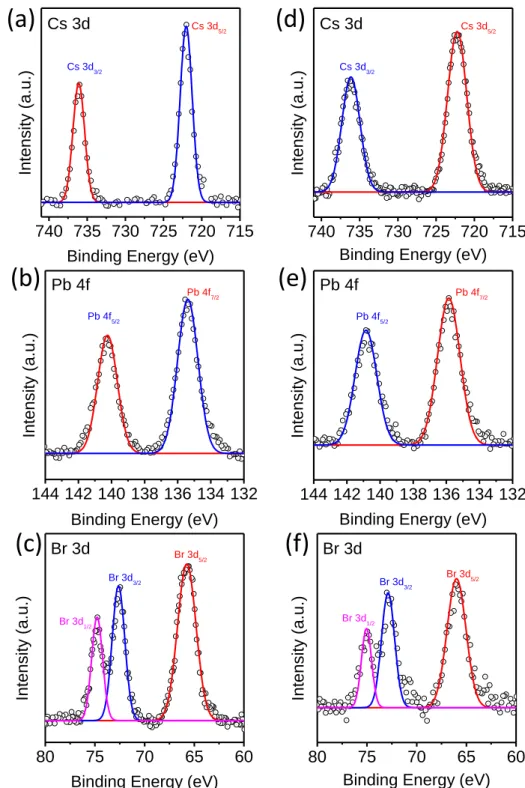
Figure S5. XPS high resolution scan of Cs3d, Pb4f, and Br3d for pristine CsPbBr3 (a, b, c) and
the heterostructure of CsPbBr3 and N-doped CDs (d, e, f).
80 75 70 65 60 Inte nsity ( a.u .)
Binding Energy (eV)
Br 3d1/2 Br 3d3/2 Br 3d5/2 Br 3d 740 735 730 725 720 715 Inte nsity ( a.u .)
Binding Energy (eV) Cs 3d Cs 3d3/2 Cs 3d5/2 144 142 140 138 136 134 132 Inte nsity ( a.u .)
Binding Energy (eV) Pb 4f Pb 4f5/2 Pb 4f7/2 740 735 730 725 720 715 Cs 3d Cs 3d 5/2 Cs 3d 3/2 Inte nsity ( a.u .)
Binding Energy (eV)
144 142 140 138 136 134 132 Pb 4f Pb 4f 5/2 Inte nsity ( a.u .)
Binding Energy (eV) Pb 4f 7/2 80 75 70 65 60 Br 3d 1/2 Br 3d 3/2 Br 3d 5/2 Br 3d Inte nsity ( a.u .)
Binding Energy (eV)
(a)
(b)
(c)
(d)
(e)
(f)
S9
Figure S6. (a) Change in peak-width (FWHM) of PL peak as a function of excitation wavelength. (b) Absorbance of N-doped CDs in toluene. Tauc plot from the electronic absorption data with band energies for (c) N-doped CDs (inset shows the zoom version) and (d) CsPbBr3 NCs.
320 340 360 380 400
85
90
95
100
105
110
FWHM (nm)
Wavelength (nm)
300
400
500
600
Ab s orbance (a. u. ) TolueneWavelength (nm)
2.0
2.5
3.0
3.5
4.0
0
5
10
15
20
25
[h
] h
(eV)
4.15 eV2.2
2.3
2.4
2.5
2.6
0.00
0.05
0.10
0.15
0.20
[ h ] 2h
(eV)
2.37 eV(b)
(d)
2.0 2.5 3.0 3.5 4.0 0.2 0.4 0.6 0.8 1.0 1.2 1.4 h(eV) 2.32 eV 3.65 eV(c)
(a)
S10
Figure S7. Zoomed PL spectra (focusing N doped CD emission) of the heterostructure with variable concentrations of carbon dots (12.37-92.59) mg/L in 1.97 x 10⁻⁶ M CsPbBr3 NCs in
toluene medium.
370
380
390
400
0
2
4
6
8
10
12
14
CsPbBr 3 + 12.37 mg/L CDs CsPbBr 3 + 24.51 mg/L CDs CsPbBr3 + 36.41 mg/L CDs CsPbBr3 + 48.08 mg/L CDs CsPbBr 3 + 59.52 mg/L CDs CsPbBr3 + 71.75 mg/L CDs CsPbBr3 + 81.78 mg/L CDs CsPbBr 3 + 92.59 mg/L CDsPL
i
nte
nsity
Wavelength (nm)
-1.2 -0.9 -0.6 -0.3 0.0 -6 -4 -2 0 2 4 Cu rren t x 10 -5 (A) Potential Applied (V) N-doped CDs CsPbBr3 -0.71 V -0.73 VS11
Figure S8. Cyclic voltammograms of CsPbBr3 NCs and CDs in 0.1 M tetrabutylammonium
perchlorate (TBAP) solution of acetonitrile.The scan rate used was 50 mV/s.
Table S1. Photoluminescence decay analysis of CsPbBr3 NCs and N-doped CD
heterostructure. Concentration of CDs in CsPbBr3 solution (mg/L) τ1 (ns) τ2 (ns) τ3 (ns) α1 α2 α3 τavg (ns) 0 20.6 125.4 2.7 40.41 45.25 14.34 111.3 12.37 19.6 117.4 3.1 39.15 42.93 17.92 103.5 24.51 15.4 99.5 2.4 40.87 40.52 18.60 48.6 36.41 10.8 66.9 1.7 39.77 41.46 18.78 58.8 48.08 9.2 59.2 1.4 42.25 34.28 23.47 50.5 59.52 7.49 45.3 1.0 40.53 30.08 29.38 37.7 81.78 3.22 18.5 0.5 43.68 28.77 27.55 15.0 92.59 2.75 15.8 0.4 42.96 26.28 30.76 12.6 References
1. Micaroni, L.; Nart, F. C.; Hummelgen, I. A. Considerations about the electrochemical estimation of the ionization potential of conducting polymers. J. Solid State Electrochem. 2002, 7, 55–59.