Volume 9, Number 2, 2016, 175-197
© Copyright 2016 the authors. 175
Competitiveness of Beef Cattle Production Systems in Nigeria: A Policy Analysis Approach
Cecilia Nwigwe, Victor Okoruwa, Kemisola Adenegan and Adeola Olajide Department of Agricultural Economics, University of Ibadan, Nigeria
Corresponding Author: Cecilia Nwigwe, Department of Agricultural Economics, University of Ibadan, Nigeria
Abstract: This study assesses the competitiveness and comparative advantage of the major beef cattle production systems in Nigeria, using the policy analysis matrix (PAM) on a sample of 339 farmers. Results of the PAM revealed that all the production systems are competitive, given their level of technology, input and output prices. The financial cost benefit ratio (FCBR) of less than one revealed that financial profit (FP) was maintained in all the production systems; however, the ranching system was the most competitive in terms of FP as well as the FCBR, which was found to be 0.064. Social profitability (SP), domestic resource cost (DRC) and social cost benefit ratio (SCBR) of less than one also suggest that Nigeria has comparative advantage in producing beef cattle within the three production systems. Sensitivity analyses showed that a 20 percent increase in freight on board (FOB) and a 20 percent depreciation of the domestic currency will increase competitiveness and comparative advantage of beef cattle production in all the production systems. The study recommends that government should ensure a level of policy stability in the beef cattle sector and also encourage the ranching system when production is targeted at improving national income.
INTRODUCTION
Beef is an important agricultural commodity in the world economy. Generally, world beef production constitutes about 40 percent of the livestock output (FAO, 2005). The total beef output in 2009 was estimated to be 62 million metric tonnes (FAOSTAT, 2011). Brazil, Australia, New Zealand, Argentina, Canada and USA, are the leading exporters of beef and it is predicted that by the year 2020, developed countries will export about 2.7 million metric tonnes of beef annually to the developing world, after meeting their own consumption needs if production policies remain unchanged (Hall et al., 2004). West Asia and North Africa will be the major importers (1.7 million metric tonnes), while exports from Latin America (especially Brazil and Argentina) will drop to about 600,000 metric tonnes. Further, India is expected to be able to export 100,000 metric tonnes.
Beef is indeed, a highly traded commodity and these projections suggest that there might be considerable opportunities for trade in beef, especially in developing countries such as Nigeria. In the opinion of Grain de Sel (2010), Nigeria is by far the leading beef cattle producer in Central and West Africa. Nigeria’s cattle herds are estimated at over 16 million heads, far ahead of Niger (8.7 million), Mali (8.2 million) and Chad (7 million). The beef cattle sub-sector plays important roles in the Nigerian economy, not only in terms of its contribution to the gross domestic products (GDP) but also contributes substantially to the supply of animal protein (FDLPCS, 2002 and Tewe, 2010). Perhaps Nigeria could benefit by improving its beef production and possibly export to the North African market where it might have relative geographical advantage in trade, due to proximity. This is in line with one of the objectives of agricultural strategy in Nigeria, which is to increase farm incomes and create a more modern and internationally competitive agricultural sector; beef cattle being regarded as a key commodity in this strategy.
In the opinion of Saab et al., (2009), competitiveness is achieved when the demands of the different world markets are met by being economically efficient while catering for a general desire for environmental preservation and for social sustainability of all those who directly or indirectly are part of the production processes. Competitiveness of beef cattle production therefore has a direct relationship with the economics of the production system. To be more competitive, as well as more profitable, the production system must be sustainable, this being a more widespread definition of economic efficiency (ANUALPEC, 2009).
The objectives of the present study are to assess the competitiveness and comparative advantage of beef cattle production in Nigeria. The study examined the three major beef cattle production systems viz pastoralism, agro-pastoralism and ranching systems, with a view to providing recommendations for further increasing the competitiveness and comparative advantage of the commodity. Beef cattle farming in Nigeria are conducted mainly in form of traditional production systems (pastoralism and agro-pastoralism), while commercial production is limited to ranches and feedlots (Tewe, 2010). Meat quality is determined by many factors, including animal breeds, rearing practices, water supply, pasture quality, supplementary feeding, disease control, infrastructure, labour and husbandry practices.
Nomadic pastoralists (also referred to as nomads) typically have temporary abodes and migrate seasonally with cattle and other livestock in search for pasture and water. Herders rely on traditional knowledge to adapt to climatic conditions, which includes flexibility in natural resource use, mobility and diversification of herds to mitigate risks from drought, livestock rustling and outbreak. In Nigeria, this system is practiced by about 1% of rural households engaged in livestock farming (Nuru, 1988). They are less commercialized but derive a relatively large share of their livelihood from cattle and other livestock. They mostly rear local or indigenous breeds of cattle such as zebu, boran, etc.
Agro-pastoralism is another system of beef cattle production in which crops and livestock are produced for sustenance. Within this system, livestock rearing and crop production are practiced interdependently where livestock is grazed on harvested fields and animal manure is applied as crop fertilizer (NBS, 2007/2008). In comparison to the traditional pastoralist system where herders go in search of pasture and water during dry seasons, sedentary agro-pastoralists face additional challenges from land pressure and limited pastures for their cattle; agro-pastoralists are relatively more commercialized than the pastoralists.
Commercial ranching system involved rearing animals for fast growing breeds, such as Sokoto Gudali, Keteku and other exotic breeds and the cross breeding of such animals with local short-horn Zebu. Ranches are purely commercialized livestock enterprises and may also grow a few crops for use as on-farm fodder or for sale. They mainly use controlled grazing on their private land, and purchased supplementary feeds, in contrast to both the nomads and agro-pastoralists that generally depend on open grazing, with limited use of purchased feeds.
MATERIALS AND METHODS
Analytical framework
The policy analysis matrix (PAM), which is a computational framework developed by Monke and Pearson (1989) and augmented by Masters and Winter-Nelson (1995) was adopted in the study to determine the competitiveness of beef cattle production systems at social and private level. Also, it was used to measure the degree of efficiency (comparative advantage), and impacts of policy for the three major beef cattle production systems in Nigeria. The policy analysis framework is shown in table 1.
Table 1: Policy analysis matrix framework
Cost
Revenue Tradable Domestic factor Profit
Private price A B C D
Social price E F G H
Divergence I J K L
Developed by Monke and Pearson (1989)
The PAM framework is a representation or a product of two basic accounting identities, as presented in Table 1. The first identity (row) provides a measure of private profitability defined as the difference between observed income (revenue) and costs. This captures the competitiveness of the agricultural system given current technologies, prices of input, output values and policy transfer. The second row of the PAM is used to measure social profit which is calculated at shadow price. The social profit reflects social opportunity costs and it measures efficiency and comparative advantage. A positive social profit indicates that the system uses scarce resources efficiently and contributes to national income (Nelson and Panggabean, 1991; Keyser, 2006).
A negative social profit indicates inefficiencies and suggests that production at social costs exceed the costs of imports, thus indicating that the sector cannot survive without government intervention at the margin. The final row of the matrix represents transfers that come into play due to policy-induced market distortions. This captures the divergences between the first row (measured at private prices) and the second row (measured at social prices). If there was no market distortions the two were often the same. If, however, there were market failures or distortions then the two diverges from one another. Their divergence acts as a signal for policy intervention. In this way, the
matrix allows us to compute the effects of a particular policy or the adoption of a new technology on income, costs and profits.
The columns of the matrix also show income and profits, as well as a breakdown of costs into two components, tradable inputs and domestic production factors. The tradable inputs in beef cattle production are majorly, foreign feeds, veterinary medicine, supplements etc. while the domestic factors are labour, land, local feeds, etc. Some particular conventions are adopted for pricing outputs and inputs, in order to calculate social profitability. For those outputs (E) and inputs (F), which are internationally traded, world prices (CIF for imports and FOB for exports) set up appropriate social values, whereas the valuation of domestic factors (G) corresponds to their opportunity cost, i.e., to the net income lost by not putting those factors to their best alternative use. Several important indicators such as nominal protection coefficient (NPC), effective protection coefficient (EPC), domestic cost ratio (DRC), subsidy ratio to producer (SRP), private cost ratio (PCR), profitability coefficient (PC) which are useful in asserting the level of competitiveness between production systems can be calculated from the PAM framework (see Monke and Pearson, 1989; Masters and Winter-Nelson, 1995 for details on how these indicators were estimated).
Data and modeling assumption
The study used survey data from six states (Oyo, Ebonyi, Delta, Adamawa, Sokoto and Niger) that are representative of the three beef cattle production systems in Nigeria, namely nomadic pastoralism, agro-pastoralism and ranches. Nigeria is found in the tropics, where the climate is seasonally damp and very humid. The natural vegetative zones that exist in the country are governed by the combined effects of temperature, humidity, rainfall and particularly, the variations that occur in the rainfall. The humid tropical forest zone of the south that has longer rains is capable of
supporting crop production while the northern part of the country representing about 80% of the vegetative zones experience lower rainfall and shorter rainy season, and they make up the savannah land. The savannah land forms an excellent natural habitat for a large number of grazing livestock such as cattle. Nigeria’s agro-ecological zones can be classified into: mangrove forest and coastal vegetation; freshwater swamp forest; tropical high forest zone; derived savannah; guinea savannah zone; sudan savannah (short grass savannah); sahel savannah (marginal savannah and montane savannah). The areas sampled in the study represent different agro-ecological zones, but are contiguous, hence logistically more accessible.
A multi-stage sampling procedure was used. In each of the six states, 2 Local Government Areas (LGAs) were selected. Within the 2 LGAs, 4 small units (villages) were randomly selected from the list of all the villages in the LGAs, taking into account the general distribution of cattle in the study area. Subsequent stages involved a random selection of a sample of 5 locations. The primary sampling units for the survey were therefore 20 locations in each state. In each of the location, a random sample of respondents was drawn from the available list of farmers; in total, 360 farmers including 55 ranchers, 97 nomads and 208 agro-pastoralists were interviewed by a team of researchers sponsored by the Agricultural Research Council of Nigeria (ARCN) between October 2013 and March, 2014.
The PAM constructed for the study made use of farm budget values (sales revenue and input cost) obtained from the three major beef cattle production systems (pastoralism, agro-pastoralism and ranching) considered for assessment for 2013/2014 farming season, on a per hectare basis. The study made use of data for yields, input use, market and farm gate prices of inputs and outputs. The price data obtained through the field survey were utilized as private prices. Further estimations in the PAM were based on World reference price and subsidized prices collected from Alibaba’s official website and were estimated on the bases of export parity prices; these were used as reference
prices for computing social prices for output and input respectively. The US FOB Gulf price was used as the reference price for beef cattle. The farm-gate was used as the location for comparing the market and efficiency prices for the commodity evaluated in the study. For the purposes of this study, the farm-gate is regarded as being located in Lagos and the world prices were adjusted for transportation cost to be comparable with farm gate price.
Secondary information was collected on international prices of input and exchange rates. For imported commodities like foreign feeds and supplements, social prices at the farm gate were calculated by adding transportation cost, port charges, tariffs to the respective CIF price (calculated by adding ocean freight charges to FOB price) in domestic currency. Data were collected from the Customs and Excise Division, Customs brokers, farmers, importers and wholesalers. Primary data were collected on fixed and variable assets like water pump, feed trough, water trough, rangeland, labour costs, marketing costs, transport costs etc. Data for calculating the efficiency prices of non-tradable items, such as labour and transportation, were obtained from farmers and Statistics of the Central Statistical office (CSO). The social price of land is the opportunity cost of land. The opportunity cost of land in this study was taken to be the net return (profit) of the competing beef cattle production system. The opportunity cost of land for beef cattle production is therefore the net return (profit) that would be earned from the next best alternative production system. A shadow exchange rate (SER) that reflects the opportunity cost of the foreign currency was also used in the analysis. Since the official exchange rate in Nigeria during the period of the survey oscillated between 152 and 155, N153 was adopted as the shadow exchange rate, in the calculation of the import parity price for tradable(s).
The social prices of domestic factors such as land, capital, labour and water were determined in the domestic economy of the country. Alternative approach was applied to estimate the social prices of each factor. Estimation of shadow prices for domestic
factors envisaged the estimation of shadow wage of labour, social interest rate for capital and opportunity cost of water and land. In the estimation of private cost for labour, the prevailing wage rate was used in the case of hired labour. In the case of family labour, the opportunity cost of family labour is used (Gittinger, 1982). The opportunity cost of family labour equals the wage rate of the best alternative employment opportunity apart from farming.
However, this is usually very difficult to measure. Thus, in this study, family labour was treated the same way as hired labour and the prevailing wage rate was used as proxy for the private price of family labour. Children between the ages of 5 and 14 in Nigeria earn about half of what hired adult workers earn, hence, in the calculation of wages for child labour, half the wage rate of adult hired labour was used. The social price of labour differs from the prevailing wage rate. This study adopted the approach in (Ogbe et al., 2011 and Mkpuma et al., 2013), which decomposed labour into peak-season and off-peak peak-season components. The wage rate in the peak-peak-season is the opportunity cost of labour for the period considered and the opportunity cost of labour in the off peak season is half the prevailing wage rate. With this, the social price of labour is calculated thus:
𝑃𝐿= 𝑊𝑃 + 0.5𝑊𝑜/2 where:
𝑆𝑃𝐿 =Social price of labour
𝑊𝑝= prevailing wage rate in peak season
𝑊𝑜=prevailing wage rate in off peak season
The social price of land is the opportunity cost of land. The opportunity cost of land (for beef cattle production) in this study was taken to be the net return (profit) of the competing crop production system. The social valuation of land for beef cattle production was calculated as the ratio of net returns to land.
Sensitivity analysis
Sensitivity analyses were also carried out to look at the effects of changing variables on the bottom line and indicators of the beef cattle PAM. The sensitivity analyses were done to see the changes that will occur with the increase/decrease in exchange rate, increase/decrease in freight on board (FOB). Following (Nguyen and Heidhues 2004; Mane-Kapaj et al., 2010; Mohanty et al., 2003; Liverpool et al., 2009), sensitivity analysis was carried out along the value chain to test whether the results would be altered by changes in the underlying assumptions. PAM is a static model, which cannot capture the potential changes in policy parameters and productivity (Akter et al., 2003). Due to the static nature of the Policy Analysis Matrix, sensitivity analysis was carried out to determine earning capacity of the investment with changes such as exchange rate and free on board price, among others. Sensitivity analysis provides a way of assessing the impact of changes in the main parameters on both private and social profitability (Monke and Pearson, 1989). The sensitivity analysis illustrates the reaction in the policy indicators such as NPC, DRC, EPC and SRP, with changes in the aforementioned factors. The effects on private and social profitability were evaluated.
RESULTS AND DISCUSSION Competitiveness of the beef cattle production systems
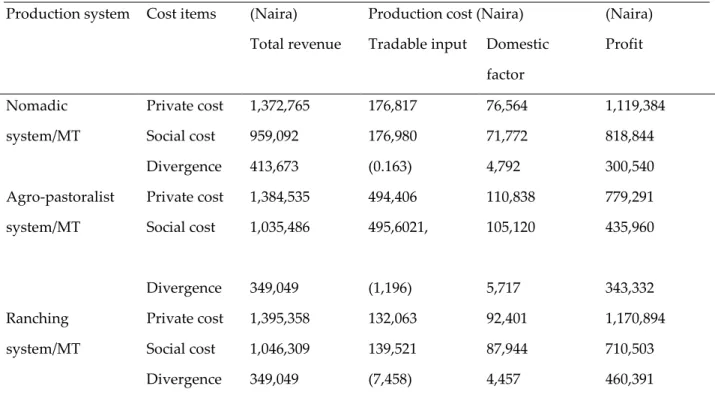
The competitiveness of beef cattle production systems was analyzed, using policy analysis matrix tool (PAM). The results of the policy analyses for the three beef cattle production systems in Nigeria in per hectare was presented in table 2 while the summary of competitiveness and protection indicators was provided in table 3.
Policy analysis of beef cattle production systems competitiveness:
Table 2 presented the estimates of the policy analysis matrix for the nomadic, agro-pastoral and ranching production systems respectively in Nigeria. The values from the private and social budget of beef cattle in Nigeria were used to calculate values for profitability in private and social prices and also the divergence between these two prices as a result of government policies and market failures. From table 2, the nomadic system of cattle production was observed to record private and social revenues of N1, 119,384 and N818, 844 respectively. This resulted in a positive divergence of N300, 540, showing that cattle producers in the nomadic system enjoyed some amount of incentives and were thus able to compete in the market. However, with respect to tradable inputs, social costs exceeded the private cost, leading to negative divergence, thus implying that input cost was a disincentive to nomads in the market place.
With respect to assessing the competitiveness of the beef cattle production systems, private and social price valuation of cost, revenue items and activities along the chain were used in PAM framework for this purpose. Results from table 2 showed that positive private and social profits were made throughout the systems, with positive divergence. Tradable input costs were about three times plus higher than the domestic factor cost at both private and social valuation in the nomadic and agro-pastoralist systems; however, in the ranching system, tradable input costs were not up to two times higher than the domestic factor cost at both private and social valuation. The financial/private profits were also found to be positive and about 30% and above higher than social profit across systems. All the production systems were also found to be competitive, given their level of technology, input and output prices. However, in all the systems, the ranching production system was found to be the most competitive (with the highest private profit) in the nation. Furthermore, the beef cattle production was found to be efficient/ or had good comparative advantage in all systems, since the social profits were positive across the systems and the nation as a whole. The ranching
production system was also found to be the most efficient or comparative advantageous (highest divergence value in the profit column).
In summary, the divergences between private and social valuations were positive for revenue, cost, and profit across the production systems (with exception of the tradable input, which was negative), implying that transfers were made from consumers to producers. In other words, consumers were being made to pay higher than the social price (world price), which resulted in higher profit for the producers; it also implies that no transfers were made from the government as protection in form of subsidy and tax on import substitutes for the farmers.
Table 2: Policy analysis matrix for beef cattle production systems in Nigeria Production system Cost items (Naira) Production cost (Naira) (Naira)
Total revenue Tradable input Domestic factor Profit Nomadic system/MT Private cost 1,372,765 176,817 76,564 1,119,384 Social cost 959,092 176,980 71,772 818,844 Divergence 413,673 (0.163) 4,792 300,540 Agro-pastoralist system/MT Private cost 1,384,535 494,406 110,838 779,291 Social cost 1,035,486 495,6021, 105,120 435,960 Divergence 349,049 (1,196) 5,717 343,332 Ranching system/MT Private cost 1,395,358 132,063 92,401 1,170,894 Social cost 1,046,309 139,521 87,944 710,503 Divergence 349,049 (7,458) 4,457 460,391 Policy indicators for Nigeria beef cattle production systems:
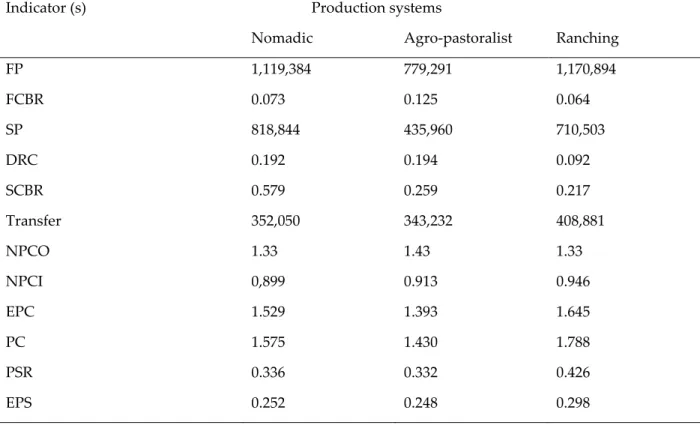
Arising from the computation of PAM, a number of relevant indicators were estimated and presented in Table 3.The PAM indicators were estimated to give further insight of the policy parameters in explaining competitiveness, efficiency/comparative
advantage, and policy protection and transfers within the beef cattle production systems in Nigeria.
Table 3 presented the financial profitability and cost-benefit ratio indicators, which were used in assessing the competitiveness of the production systems. As shown in table 3, the private/financial profitability (FP), which helped to determine the competitiveness of any agricultural system at market price, was positive for all the systems of cattle production in the country, thus indicating that the systems were competitive at market price with opportunity for expansion in the future. The financial cost benefit ratio (FCBR) of less than one also revealed that FP was maintained in all the systems within the beef cattle value chain. However, the ranching system was found to be the most competitive in terms of FP as well as the financial cost benefit ratio (FCBR), which is a measure of efficiency.
Three indicators were used to assess the comparative advantage of producing beef cattle in Nigeria. These included the social profitability (SP), domestic resource cost (DRC) and social cost benefit ratio (SCBR) indicators. Indication from the values of the indicators presented in table 3 suggested that Nigeria had comparative advantage in producing beef cattle within the three production systems. This was made possible giving the fact that the SP was positive while the DRC was less than one (ranging from 0.097 to 0.197) across the three systems of beef cattle production in the country. The fact that the DRC of all the production systems were less than one was an indication that the cost of domestic resources used to produce beef cattle in Nigeria was less than the contribution of value added at social prices. This meant that the country was making efficient use of the domestic resources in the production of cattle, which could also be exported given the current policy of government.
Similarly, the SCBR indicator (ranging from 0.217 to 0.579), which measured the ratio of tradable input and domestic factor costs to the gross revenue was also found to be less than one in the three systems of cattle production, indicating that the production
systems were making revenue in excess of costs of inputs and domestic factors. In ranking the production systems however, using the three indicators of SP, DRC and SCBR, table 3 showed that the ranching production system possessed better comparative advantage in cattle production than the other systems.
Transfers reflect the effect of policies and changes on the agricultural system of interest, which can be assessed with any or all of the following indicators – nominal protection coefficients of input or output (NPCs); effective protection coefficient (EPC); profitability coefficient (PC) and producer subsidy ratio (PSR). Table 3 showed the estimated values of the indicators. Net transfers was least with agro-pastoralist system of cattle production and largest in the ranching system of cattle production. With reference to the nominal protection indicators, the computed values showed that the NPCOs across all the systems are greater than one (>1). This indicates that policy had permitted private price of output (beef) from cattle production in the country to be higher than world price. In other words, tariffs were placed on imported beef to discourage importation and encourage domestic/local production. On average, price of beef produced in Nigeria was estimated to be about 72% higher than world price. The NPCIs on the other hand, revealed that the three production systems enjoyed a little form of subsidy with respect to inputs used for production; thus, the average market prices of inputs were about 99% of the world market prices.
The effective protection coefficient (EPC) value, which measured the extent to which producers were protected against price distortions arising from both input and output market, showed that beef cattle producers were protected within the policy environment across all production systems. Producers under the ranching system were most protected (EPC – 1.65) while those under the agro-pastoralist system were less protected (EPC – 1.49). The incentive effects of all policies as measured by the PC values (more realistic than EPC), revealed that the net policy transfers across all systems were high to producers. The result showed a similar pattern to that of EPC, as the transfer
from social value to private is largest with the ranching system and least with the agro-pastoralist system.
The producer subsidy ratio (PSR) and equivalent producers’ subsidy (EPS) further revealed the presence of incentives to the producers within the beef cattle value chain across the production systems in the country. The PSR values showed that at least 36% increase in revenue of producers was due to transfers and that transfers are largest with the ranching system and least with the agro-pastoralist system. Similarly, the EPS values also reinforced the presence of subsidy across the systems.
Table 3: Summary of competitiveness and protection indicators for the beef cattle production systems in Nigeria
Indicator (s) Production systems
Nomadic Agro-pastoralist Ranching
FP 1,119,384 779,291 1,170,894 FCBR 0.073 0.125 0.064 SP 818,844 435,960 710,503 DRC 0.192 0.194 0.092 SCBR 0.579 0.259 0.217 Transfer 352,050 343,232 408,881 NPCO 1.33 1.43 1.33 NPCI 0,899 0.913 0.946 EPC 1.529 1.393 1.645 PC 1.575 1.430 1.788 PSR 0.336 0.332 0.426 EPS 0.252 0.248 0.298
Sensitivity analysis of different policy options on the beef cattle production systems in Nigeria
The policy analysis matrix (PAM) was used to evaluate the effects of present trade and market policies on the beef cattle production systems in Nigeria. Sensitivity analyses were also carried out to look at the effects of changing variables on the bottom line and indicators of the beef cattle PAM. The sensitivity analyses were done to see the changes that will occur with the increase/decrease in exchange rate, increase/decrease in freight on board (FOB). The resulting indicators were presented in Tables 4-9.
(a) Increase and decrease in exchange rate
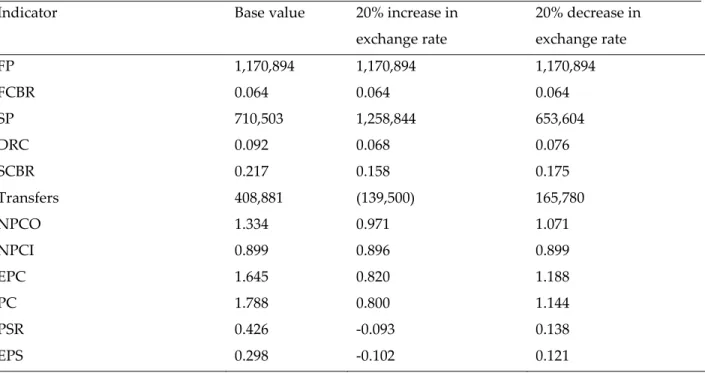
Sensitivity analyses of the exchange rate involved increasing and decreasing the value of the exchange rate by 20%. With an increase in the exchange rate, the magnitude of the indicators were found to be lower than the base values while they were usually higher with decrease in exchange rate. In all the production systems, the indicators revealed that the beef cattle system was profitable (financial profitability) and efficient (social profitability). Financial and social profitability were highest within the ranching and agro-pastoralist production systems. The domestic resource costs indicate comparative advantage of the beef cattle production system.
The nominal protection coefficients on output reflect that there is some form of subsidy to the production systems. The nominal protection coefficient on input on the other hand indicates policy options that subsidize inputs within the agro-pastoralist and ranching systems in Nigeria. On the whole, as given by the effective protection coefficient and the profitability coefficient, there is evidence of flows of incentives from the policy environment to the beef cattle production systems within the country.
(b) Increase and Decrease in FOB
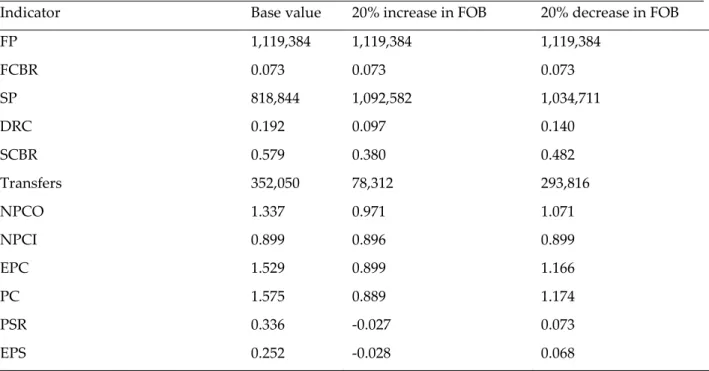
The sensitivity analysis was also conducted to examine the effect of a 20% increase /decrease in the freight on board (FOB), on the PAM indicators of the beef cattle system. A 20% increase in the FOB increases the values of the social profitability, indicating an increase in efficiency of the beef cattle production system. However, it reduces the value of the other indicators of profitability and transfers, except that the NPCI which remains the same (the signs also remaining the same). When the FOB is reduced by 20%, there is a reduction in the social profitability, but an increase in the magnitude of the other indicators, except the NPCI. The reduction in social profitability with a 20% decrease in FOB is significant in the ranching system, where the social profitability is the lowest. This indicates that a reduction in the FOB to the extent used will totally bring the ranching cattle production system into comparative disadvantage as compared with the current FOB.
In summary, the PAM analyses revealed that the production of beef cattle among the three production systems was economically efficient and maintained both competitive and comparative advantage. It also revealed that the cost of domestic resources used to produce beef cattle in Nigeria was less than the contribution of value added at social prices. This means that the country is making efficient use of the domestic resources in the production of cattle, which could also be exported, given the current policy of government. The local producers were well protected by the government through its macroeconomic and sectoral policies. The study also showed that the ranching system was more efficient, thereby justifying the need for intensified effort and policy attention on the ranching system if Nigeria is going to attain self-sufficiency in the production of beef cattle.
Table 4: Sensitivity analysis for change in exchange rate for nomadic production System
Indicator Base value 20% increase in exchange rate 20% decrease in exchange rate FP 1,119,384 1,119,384 1,119,384 FCBR 0.073 0.073 0.073 SP 818,844 1,209,993 1,075,973 DRC 0.192 0.197 0.134 SCBR 0.579 0.381 0.468 Transfers 352,050 (39,099) 94,921 NPCO 1.337 0.880 1.081 NPCI 0.899 0.899 0.899 EPC 1.529 0.903 1.159 PC 1.575 0.889 1.174 PSR 0.336 0.059 0.027 EPS 0.252 0.056 0.026
Table 5: Sensitivity analysis for change in FOB in the nomadic cattle production System
Indicator Base value 20% increase in FOB 20% decrease in FOB
FP 1,119,384 1,119,384 1,119,384 FCBR 0.073 0.073 0.073 SP 818,844 1,092,582 1,034,711 DRC 0.192 0.097 0.140 SCBR 0.579 0.380 0.482 Transfers 352,050 78,312 293,816 NPCO 1.337 0.971 1.071 NPCI 0.899 0.896 0.899 EPC 1.529 0.899 1.166 PC 1.575 0.889 1.174 PSR 0.336 -0.027 0.073 EPS 0.252 -0.028 0.068
Table 6: Sensitivity analyses for change in exchange rate for agro-pastoralist production system
Indicator Base value 20% increase in exchange rate 20% decrease in exchange rate FP 779,291 779,291 779,291 FCBR 0.125 0.125 0.125 SP 435,960 973,557 680,997 DRC 0.194 0.054 0.170 SCBR 0.259 0.166 0.206 Transfers 343,232 (194,265) 98,295 NPCO 1.431 0.916 1.142 NPCI 0.913 0.913 0.913 EPC 1.393 0.973 1.085 PC 1.430 1.072 1.032 PSR 0.332 -0.123 0.077 EPS 0.252 0.056 0.026
Table 7: Sensitivity analysis for change in FOB for agro-pastoralist production system
Indicator Base value 20% increase in exchange rate 20% decrease in exchange rate FP 779,291 779,291 779,291 FCBR 0.125 0.125 0.125 SP 435,960 979,917 344,037 DRC 0.192 0.097 0.140 SCBR 0.259 0.165 0.207 Transfers 343,232 (200,625) 135,255 NPCO 1.433 0.911 1.142 NPCI 0.913 0.913 0.913 EPC 1.393 0.973 1.085 PC 1.430 0.968 1.088 PSR 0.332 -0.127 0.109 EPS 0.252 -0.028 0.068
Table 8: Sensitivity analysis for change in exchange rate for ranching production system
Indicator Base value 20% increase in exchange rate 20% decrease in exchange rate FP 1,170,894 1,170,894 1,170,894 FCBR 0.064 0.064 0.064 SP 710,503 1,252,524 959,964 DRC 0.092 0.074 0.072 SCBR 0.217 0.172 0.167 Transfers 408,881 (133,140) 159,420 NPCO 1.334 1.057 1.024 NPCI 0.899 0.899 0.899 EPC 1.645 0.825 1.132 PC 1.788 0.800 1.144 PSR 0.426 -0.089 0.132 EPS 0.298 -0.097 0.116
Table 9: Sensitivity analysis for change in FOB for ranching production system Indicator Base value 20% increase in
exchange rate 20% decrease in exchange rate FP 1,170,894 1,170,894 1,170,894 FCBR 0.064 0.064 0.064 SP 710,503 1,258,844 653,604 DRC 0.092 0.068 0.076 SCBR 0.217 0.158 0.175 Transfers 408,881 (139,500) 165,780 NPCO 1.334 0.971 1.071 NPCI 0.899 0.896 0.899 EPC 1.645 0.820 1.188 PC 1.788 0.800 1.144 PSR 0.426 -0.093 0.138 EPS 0.298 -0.102 0.121
CONCLUSION
The production of beef cattle in all the production systems was economically efficient and maintained a comparative advantage. However, ranching system should be encouraged when production is targeted at improving national income since findings have shown that DRC and SCB were less than one in the production systems, with ranching having the highest comparative advantage. Again, sensitivity analyses revealed that a large change in either the free on board prices or the devaluation of the exchange rate was necessary to alter the results of the competitiveness, and hence, PAM indicators for all the beef cattle production systems. It was therefore concluded, that domestic policy reforms that will strengthen the current levels of effective protection in input and output will significantly go a long way to increase beef cattle production, and hence, its competitiveness in all the production systems.
References
[1] Akter, S, M.A, Jabbar and S.K. Ehui 2003 Competitiveness and efficiency in poultry and pig production in Vietnam, Working paper No. 57; International Livestock Reasearch Institute, Nairobi, Keya; 55Pp
[2] ANUALPEC 2009 Anuario da Pecuaria Brasileira. Agra el FNP. Sao Paulo, Brazil, 360pp. In Competitiveness of beef farming in Rio Grande do sul State, Brazil; P.R. Marques, J.O.J. Barcellos, C. McManus, R.P.Oaigen, F.C. Collares, M.E.A.Canozzi, V.N.Lampert: Agricultural Systems 104(2011) )689-693).
[3] FAO 2005, ‘Livestock Sector brief”, Livestock Information Sector Analysis and Policy Branch, FAO, Rome
[4] FAOSTAT 2011, Food and Agriculture Organization of the United Nations (FAO), Statistical Database; Available from: http://faostat.fao.org/ [Last accessed: 30 March 2011].
[5] Hall, D.C, Ehui, S. and Delgado, C. 2004. ‘The Livestock revolution, food safety and small-scale farmers: Why they matter to us all; Journal of Agricultural and Environmental Ethics, 17(4-5): 425-444.
[6] Keyser, J.C. 2006 Description of methodology and Presentation of Templates for Value Chain Analysis; Part 1: Narrative Text Background paper for the Competitive Commercial Agriculture in sub-Saharan Africa (CCAA) study.
[7] Liverpool, L.S.O., Ayoola, G.B and Oyeleke, R.O. 2009 Enhancing the Competitiveness of Agricultural Commodity Chains in Nigeria: Identifying Opportunities with Cassava, Rice and Maize using a Policy Analysis Matrix (PAM) Framework; Nigeria Strategy Support Program (NSSP) Background Paper No NSSP 013 December 2009; International Food Policy Research Institute
[8] Mane-Kapaj, A, Kapaj,I, Chan-Halbrendt, C and Totojani, O. 2010 Assessing the Comparative Advantage of Albanian Olive Oil Production, International Food and Agribusiness Management Review 13(1) Pp. 15-16.
[9] Masters, W.A and Winter-Nelson, A 1995 Measuring the comparative advantage of agricultural activities: domestic resource costs and the social cost-benefit ratio; Am.J. Agric Econ. 77: 243-50. [10] Mohanty, S, Fang, C and Chaudhary, J 2003 Assessing the Competitiveness of Indian Cotton
Production: A Policy Analysis Matrix Approach. The Journal of Cotton Science 7: 65-74.
[11] Monke, E.A and S.R. Pearson 1989 The Policy Analysis Matrix for Agricultural Development, Ithaca and London: Cornel University Press.
[12] NBS 2008 Livestock Sector-National report: Census of Agriculture www.nbs.go.ng/nbs/index php
2007/2008; National Bureau of Statistics, Nigeria.
[13] Nelson, G.C. and M. Panggabean 1991 The cost of Indonesian Sugar Policy: A Policy Analysis Matrix Approach, Am.J. Agric Econ. 73: 703-712.
[14] Nguyen, M.H and F. Heidhues 2004 Comparative Advantage of Vietnam’s Rice Sector under different liberalization Scenarios, University of Hohenheim, Stuttgart, Germany, Deutscher Tropentag 2000 in Hohenheim, 11 Pp.
[15] Nuru, S. 1998 Research and Development in pastoral production system in Nigeria: Past, present and future: In Proceedings of a national conference on pastoralism in Nigeria, Kaduna.
[16] Ogbe. O.O, Okoruwa, V.O, Saka, O.J. 2011 Competitiveness of Nigerian Rice and Maize Production Ecologies: A Policy Analysis Matrix Approach. Trop. Subtrop.Agroecosyst. J., 14 (2011): 493-500 [17] Saab, M.S, Neves, M.F, Claudio, L.D.G 2009. O desafio da coordenacao e seus impactos sobre a
competitividade de cadeias e sistemas agroindustriais. Rev Bras Zootech, 38: 412-422 In Oaigen, R.P, Barcellos, J.O.J; Soares, J.C.R, Lampert, V.N, Gottschall, C.S, Marques, P.R and Tavares, H.R (2013); Beef Cattle Production System Competitiveness in the South of Brazil, Arch. Zootec. 62 (238): 161-170. [18] Tewe, O.O. 2010 Sustainability and Development: Paradigms from Nigeria’s Livestock Industry.
Inaugural lecture series; University of Ibadan Press, Ibadan
[19] Ude, M, Adeoye, I,B, Yusuf, S.A, Balogun, O.L, Akinlade, R.J. 2013. Competitiveness of rice processing and marketing in Ebonyi State: A policy analysis approach. International Journal of Agricultural Sciences ISSN: 2167-0447 Vol.3 (2): Pp 410-418, February 2013.