CodeCrawler — Lessons Learned in Building a Software Visualization Tool
Michele Lanza
[email protected] - Software Composition Group - University of Berne, Switzerland
Abstract
Software visualization tools face many challenges in terms of their implementation, including scalability, usabil-ity, adaptabilusabil-ity, and durability. Such tools, like many other research tools, tend to have a short life cycle and are vulner-able to software evolution processes because of the complex problem domain and the constantly changing requirements which are dictated by research goals. In this paper we dis-cuss the implementation of the software visualization tool CodeCrawler according to five criteria, namely the over-all architecture, the internal architecture, the visualization engine, the metamodel and the interactive facilities. This discussion generates implementation recommendations and design guidelines that hold for our tool and the class of tools its stands for. We then also extract common design guide-lines and recommendations that apply for other software visualization and general reverse engineering tools as well, and hope that these insights can be used fruitfully by other researchers in this field.
Keywords: Software Visualization, Tools, Reverse En-gineering, Experience Report
1
Introduction
Reverse engineering, the understanding of legacy soft-ware systems, has become a primary concern in softsoft-ware industry. It is an important prerequisite for the maintenance and evolution of software systems. A commonly used ap-proach in reverse engineering is software visualization, the graphical display of software.
The reverse engineering research community has imple-mented several software visualization (SV) tools, each of them addressing different aspects and trying to offer solu-tions for different problems. All of these tools have advan-tages and drawbacks of their own, and face several problems at the levels of architecture and implementation. Such tools are constantly changed and evolved in order to cope with new requirements, new platforms, new languages, new im-port/export formats, etc. This constant evolution puts pres-sure on a researcher, since the tools he implements for his
research are often only a vehicle for it and not the primary goal.
We have built a software visualization tool called Code-Crawler, whose development started in 1998 and which has been re-implemented several times since then and is cur-rently still being developed and extended. CodeCrawler is a lightweight software visualization tool which combines metrics information with its visualizations [23, 9, 24]. It is mainly targeted at static software visualization.
CodeCrawler’s implementation changed and evolved in order to cope with the new requirements our research gen-erated. Its current design is thus able to solve most of the problems we encountered with static software visual-izations. Moreover, several of the lessons learned with CodeCrawler can be generalized into more common design guidelines and recommendations which apply to other kinds of software visualization tools as well.
We identify five key issues pertinent to the implementa-tion of a software visualizaimplementa-tion tool:
1. the overall architecture, the way the SV tool as a whole is structured. A clear separation of its three main subsystems, e.g., the core, the visualization en-gine and the metamodel, provides for the higher flexi-bility that is necessary to be resistant against software evolution processes.
2. the internal architecture, the design of the core main model. Although simple at first sight, the do-main model must be designed for extensibility, since the added and new requirements in terms of the func-tionality needed by the users have an impact on it. 3. the visualization engine, the way information is
vi-sualized. Since SV tools have special needs, an off-the-shelf visualization library does not offer the de-gree of freedom needed by the SV tool provider. On the other hand writing a complete visualization library from scratch is a cumbersome and lengthy process that should not burden the SV tool provider. We describe a compromise solution that largely satisfied our needs. 4. the metamodel, the way data is collected and stored.
but to more general and common reverse engineering issues, should also be separated from a software visu-alization tool and be reused as an external and well-defined source of functionalities.
5. the interactive facilities, the direct-manipulation pos-sibilities that are offered to the user. Although hard to validate, it is this aspect that requires the most work from a SV tool provider and that ultimately dictates the tool’s usability and success.
We discuss the implementation of CodeCrawler accord-ing to these five aspects and then generalize the lessons learned into design guidelines and recommendations for the implementation of software visualization tools. We hope these lessons can ultimately be used profitably by re-searchers in this field in case they want to start a new im-plementation or enhance an existing imim-plementation of a software visualization tool.
Structure of the article. In Section 2 we introduce the domain of software visualization. This discussion leads us to identify five criteria that we want to test our tool against. In Section 3 we first introduce CodeCrawler, the tool we have implemented in our research group, and then discuss the advantages and drawbacks of its implementation in the context of each of the identified criteria. We then generalize the lessons learned into design guidelines and recommen-dations in Section 4. We then take a look at related work in Section 5 and then conclude Section 6) by summarizing our findings.
2
Software Visualization
Price et. al [31] define software visualization as the use
of crafts of typography, graphics design, animation, and cinematography with modern human-computer interaction and computer graphics technology to facilitate both the hu-man understanding and effective use of computer software.
Ware [38] states that visualization provides an ability to
comprehend huge amounts of data. However, software
vi-sualizations are often too simplistic and lack visual cues for the viewer to correctly interpret them. In other cases the obtained visualizations are still too complex to be of any real value to the viewer. The goal of any software visualiza-tion tool is ultimately to visually render software, be it in a dynamic or static fashion. Software visualization is useful because visual displays allow the human brain to study mul-tiple aspects of complex problems in parallel. All software visualization tools face problems coming form the more general fields of information visualization [38] and
semi-otics of graphics (the study of symbols and how they convey meaning), wonderfully discussed by Tufte [35, 37, 36] and
Bertin [5].
Ware [38] describes four basic stages in the process of data visualization, and interestingly enough these four stages have a direct mapping on the architecture of software visualization tools:
1. The collection and storage of data itself.
2. The preprocessing designed to transform the data into something we can understand.
3. The display hardware and the graphics algorithms that produce an image on the screen.
4. The human perceptual and cognitive system, i.e., the perceiver.
We deduce from these four stages four components that
de facto must be present in one way or another in every
software visualization tool:
1. The metamodel. The data to be visualized, in this case it is software source code, must be collected and stored using a metamodel that provides facilities like parsing, storing, etc.
2. The internal architecture. Based on the data pro-vided by the metamodel, a software visualization tool must have some kind of internal representation of what it visualizes.
3. The visualization engine. An important part of every tool is devoted to the graphical output of information. 4. Interactivity. The perceiver, e.g., the viewer, not only
wants to look at software, most of the times he also wants to interact with the visualizations, since static visualizations seldom offer exhaustive explanations to the viewer.
Furthermore the union and interplay of these compo-nents can be regarded as the overall architecture of a soft-ware visualization tool.
3
CodeCrawler
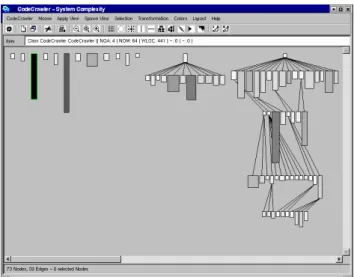
CodeCrawler is a language-independent software visu-alization tool written in Smalltalk. CodeCrawler supports reverse engineering through the combination of metrics and software visualization [23, 9, 12, 24]. In Figure 1 we can see a screen shot of CodeCrawler. Its power and flexibil-ity, based on simplicity and scalabilflexibil-ity, has been repeat-edly proven in several large scale industrial case studies. To model software, CodeCrawler uses Moose, a language independent reengineering environment. The first imple-mentation of CodeCrawler started in 1998 as part of a mas-ter thesis [23]. At the beginning CodeCrawler was based
Figure 1. A snapshot of CodeCrawler’s main window. The visualized system in this case is CodeCrawler itself.
directly on the Smalltalk language, since its reflective ca-pabilities provide for many functionalities that otherwise must be provided by an external metamodel. In 1998 in the context of the FAMOOS ESPRIT project, Moose, the first implementation of the FAMIX metamodel, neared comple-tion and CodeCrawler started to use Moose as metamodel. While FAMIX provided for possibilities as language inde-pendence (Java, C++, Smalltalk, Ada, COBOL, etc.) it also involved more complexity. CodeCrawler has had 5 major releases since then, it was last released in October 2002. In its newest re-implementation, described in this article, CodeCrawler is now also able to visualize any construct,
e.g., not necessarily out of the field of software reverse
en-gineering.
3.1
Overall Architecture
As in every software system, the general architecture of a software visualization tool dictates on one hand how much and which kind of functionality it provides, on the other hand it also defines how it can be extended in case of chang-ing or new requirements.
CodeCrawler adopts the what we call a bridge architec-ture described above, as we see in Figure 2: the internal architecture, e.g., the core of CodeCrawler, acts as a bridge between the visualization engine (on the left) and the meta-model (on the right). It uses as visualization engine the HotDraw framework [6, 21] and as metamodel the FAMIX metamodel [11], whose implementation is called the Moose reengineering environment [13] [14]. Both of them are de-scribed in more detail later on. In order to keep a certain
Figure 2. The general architecture of Code-Crawler, composed of three main subsys-tems: the core, the metamodel and the vi-sualization engine.
flexibility CodeCrawler uses facade classes which hide both the visualization engine and the metamodel from the core. It thus can limit the effects of changes happening on the visualization engine and the metamodel. This has the ad-vantage that only the facade classes must be changed when the visualization engine or the metamodel changes. An ex-ample of such a change is the newly supported GXL format [18], which directly affects only Moose and does not af-fect the implementation of CodeCrawler, except for adding a new menu item in CodeCrawler’s file menu. An example of a major future change is to use a 3D visualization en-gine. Although at first sight a massive change, this would affect again only the visualization engine’s facade classes. In a second moment CodeCrawler would then start to ex-ploit the added third dimension for its visualizations and only then this would have an effect on the implementation of its core.
3.2
Internal Architecture
The internal architecture of software visualization tools is largely dictated by their domain model. This depends on the type of visualizations the tool provides. CodeCrawler is focused on visualizing static information about software,
i.e., thus working mainly at a structural level. Other
visu-alizations types, not discussed here, include algorithm
vi-sualization and animation, computation vivi-sualization.
Ac-cording to the taxonomy presented by Price et al.[27] Code-Crawler is a static code visualization tool.
The internal architecture of CodeCrawler, i.e., all things not related to the visualization engine or the metamodel, can be divided into four parts: (1) the core model, (2) the polymetric views subsystem, (3) the layout engine and (4) the user interface and service classes.
The Core Model. We can see a simple class diagram of CodeCrawler’s core model in Figure 3. CodeCrawler uses nodes to represent entities (classes, methods, subsystems, etc.) and edges to represent relationships (inheritance,
in-Figure 3. The core model of CodeCrawler.
vocation, access, etc.) between the entities. The nodes and edges are contained within a class that represents a graph in the mathematical sense. Both the node class (CCNode) and the edge class (CCEdge) inherit from an abstract superclass which represents a general item (CCItem). CCItem serves as bridge between the visualization part (it contains an at-tribute named figure which points to a figure class). It is also a bridge to a parallel plugin hierarchy (it contains an attribute named plugin which points to a plugin class). The classes in the plugin hierarchy provide most of the func-tionality of the nodes and edges. We decided to separate this functionality into an own hierarchy (instead of putting it inside the node and edge classes) in order to obtain more flexibility and a higher degree of extensibility. The plugin hierarchy ultimately serves as another bridge [16] to the metamodel representing the software. In our case the ab-stract superclass CCItemPlugin defines an attribute named
entity which points to the needed class, e.g., in the case of
visualizing software it point to a class in Moose which rep-resents a software artifact. To protect against changes in the metamodel we use again facade classes, i.e., in Code-Crawler we implemented a hierarchy of FAMIX plugins which have counterparts in Moose. To make an example, in order to represent a FAMIX class in Moose (called at this time MSEClass), CodeCrawler implements a CCFAMIX-ClassPlugin class which interfaces with MSEClass. The re-turn in extensibility of this implementation became obvious when some students extended CodeCrawler’s plugin hier-archy in order to model and visualize other kinds of enti-ties, for example for the fields of concept analysis, web site reengineering and prolog rule repositories.
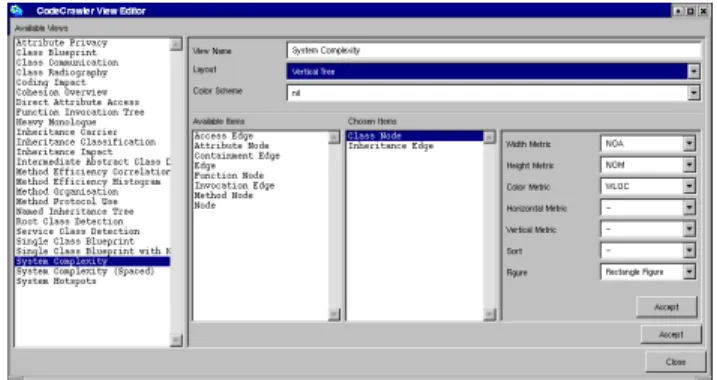
The Polymetric Views. All information regarding a cer-tain visualization (what is to be visualized, how, where, which metrics, etc.) is stored by means of a view specifica-tion class (CCViewSpec). When it comes to display a view of a software system, a view builder (CCViewBuilder) in-terpretes an instance of a specification class and builds the needed visualization. The specifications of the views are easily composed and modified in the view editor window
depicted in Figure 4.
Figure 4. CodeCrawler’s View Editor. The views are composed piece by piece and can then be directly invoked from the main win-dow.
The Layout Engine. The complex problems that go with graph drawing and graph layouts have been a subject of research for many years [2]. The layout class hierarchy is part of CodeCrawler, i.e., we do not use any external or commercial graph layout library. The reason for doing so is that in Smalltalk there is no freely available standard-ized layout library, as is the case for other programming languages like Java or C++. Although an interfacing with libraries written in C would not have been a problem, we decided against that in order to keep as much control as pos-sible. This trade-off between having or delegating control must be carefully evaluated. In CodeCrawler all layouts (at this time ca. 15) inherit from a common abstract superclass (CCAbstractLayout). A layout class takes as input a collec-tion of node figures and assigns a posicollec-tion to each of them.
The Service and UI Classes. Besides the classes men-tioned above, CodeCrawler contains many more classes which provide for various services, for example storing con-stants and color mappings. Other classes are pure user in-terface classes (Dialogs, Panels, etc.). In order to keep the size of this paper within reasonable limits, we omit their discussion.
3.3
Visualization Engine
The primary task of a software visualization tool’s visu-alization engine is to provide for the graphical output on the screen.
We can see a simple class diagram of the visualization engine in Figure 5. CodeCrawler uses as visualization en-gine the HotDraw framework, a lightweight 2D editor writ-ten in Smalltalk, consisting of ca. 150 classes. It provides for basic graphical functionalities like zooming, scaling,
eli-Figure 5. The visualization engine of Code-Crawler. CodeCrawler subclasses and ex-tends some basic HotDraw figure classes. The class hierarchy composed of the classes CCItemFigureModel, CCNodeFigure-Model and CCEdgeFigureCCNodeFigure-Model serves as Fa-cade for the HotDraw figure classes.
sion and comes with a collection of simple figures (rect-angles, lines, ellipses, composite figures, etc.) that can be easily reused and extended through subclassing, as Code-Crawler does indeed: the subclasses include CCDrawing, which represents the drawing surface on which the visual-ization is displayed, and several figures classes (CCRectan-gleFigure, CCLineFigure, etc.) which add functionality to the quite simple HotDraw figure classes. However, these subclasses do not offer protection against changes in Hot-Draw, since the subclasses would be affected too. Therefore in CodeCrawler three classes (CCItemFigureModel, CCN-odeFigureModel and CCEdgeFigureModel), organized in a small hierarchy, serve as facade classes for the figure classes that subclass HotDraw’s classes. This allows us to replace on-the-fly the graphical representation, e.g., the figure, of a node or an edge. Furthermore, the facade classes implement several operations that we want to effect on figures (graph-ical operations, geometric transformations, etc.) and dele-gate them to the appropriate concrete figures on the screen.
3.4
Metamodel
The primary task of a metamodel is to collect and store the data that later on is visualized.
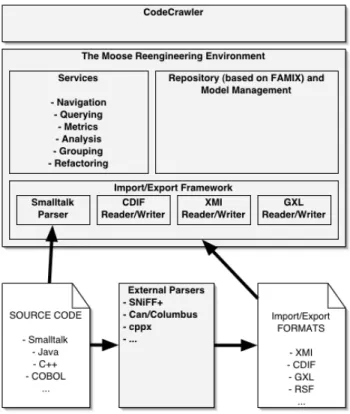
Figure 6. The architecture of Moose, Code-Crawler’s metamodel.
CodeCrawler uses Moose, a language independent reengineering environment written in Smalltalk, to model software systems [13, 14]. In Figure 6 we see the inter-nal organization of the Moose reengineering environment. Moose is based on the FAMIX metamodel specification [11] [34], which provides for a language independent repsentation of object-oriented source code and contains the re-quired information for reengineering and reverse engineer-ing tasks like navigation, queryengineer-ing, metrics, refactorengineer-ings, etc. It is language independent, because in the context of the FAMOOS ESPRIT project we needed to work with legacy systems written in different implementation languages. It is
extensible, since we cannot know in advance all information
that is needed in future tools. Since for some reengineering problems (e.g., refactorings [34]) the tools might need for language specific information, we allow for language plug-ins that extend the model with language specific features. Next to that we also allow the tool plug-ins to extend the model with tool specific information.
The FAMIX metamodel comprises the main object-oriented concepts – Class, Method, Attribute and Inheri-tance – plus the necessary associations between them – In-vocation and Access. Note that the complete FAMIX meta-model includes many more aspects of the object-oriented paradigm, and contains source code entities like formal pa-rameters, local variables, functions, etc. We opted against the use of UML because it is not sufficient for modeling source code for the purpose of reengineering, since it is specifically targeted towards OOAD and not at represent-ing source code as such [10].
Moose, a full-fledged reengineering environment, pro-vides CodeCrawler with several services from parsing (Smalltalk and Java) to reading exchange files in different formats (XMI, CDIF, GXL, RSF, ...). CodeCrawler uses the functionalities provided by Moose either directly using delegation or by subclassing some of Moose’ classes. Fur-thermore, the plugin hierarchy in CodeCrawler contains a subtree composed of FAMIX plugins, which serves as fa-cade for the actual FAMIX classes in Moose. This is de-scribed in detail in the Section 3.2.
To limit the size of this paper, we do not further describe Moose, but rather point the reader to the referenced articles.
3.5
Interactive Facilities
Once the visualization is rendered on the screen, the user not only wants to look at it, he also wants to interact with it. According to Storey et al. [33] this helps to reduce the cognitive overhead of any visualization.
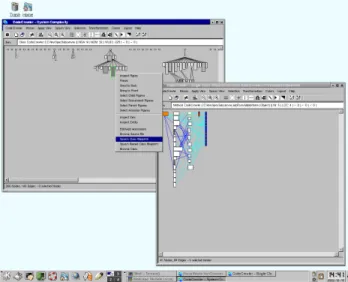
Figure 7. CodeCrawler at work. The context menus are dynamically built depending on the entity or relationship that is selected.
In Figure 7 we see CodeCrawler at work. In Code-Crawler the HotDraw framework provides for direct manip-ulation at a purely graphical level, i.e., the user can click, drag, double-click, delete, zoom out/in, spawn child win-dows, etc. CodeCrawler uses that functionality by provid-ing context-based (pop-up) menus for each node and edge. Note that depending on the type of the node (class, method, etc.) different choices are offered to the user. For example it is possible to open a class browser on a node, or look at a list of senders of a certain method, etc. In the context of a master in our group [30], a student has implemented on top of CodeCrawler several navigation facilities that enable the user to go back/forth from one view to another (macro navigation) or that offer the user context-based navigation aids (micro navigation).
The context menus and the micro navigation are lo-cated within the plugin hierarchy, since they are context- or entity-based. The macro navigation and all other graphical interactions like geometric transformations and all multi-windowing techniques are located in CodeCrawler’s main window.
4
Lessons Learned
In this section we take the lessons learned from the implementation of CodeCrawler and generalize them into more common design guidelines and recommendations. These apply not only for static software visualization tools like CodeCrawler, but in a wider context for visualization tools and reverse engineering tools in general.
4.1
Overall architecture
In the case of a software visualization tool, as we have seen in Section 2, the general architecture is readily identi-fied and is composed of (1) the visualization engine, (2) the
metamodel, and (3) the core or the internal architecture. The visualization engine. It provides for the graphi-cal capabilities of the SV tool. In some cases the SV tool provider uses or extends a commercial or external graphi-cal library, e.g., OpenGL, DirectX, while in other cases he implements it by himself. We do not recommend to imple-ment a graphical library from scratch, as this can become a long and painful implementation marathon without any real improvement of the tool’s capabilities. Another design decision that the SV tool provider must take is whether he wants to use a 2D or 3D visualization engine. We do not think that 3D involves a much higher complexity, it rather puts more pressure on direct manipulation issues, i.e., how can the visualized software be interacted with and how can it be navigated?
The metamodel. The metamodel provides for the SV tool’s data collection and data storage capabilities. The
metamodel itself can be language independent (thus provid-ing for a representation of several programmprovid-ing languages at the same time), language dependent or in some cases even be the language itself without any additional meta-information.
The core. Ultimately the core is the part of the SV tool where the domain model and the tool’s functionalities are modeled and implemented.
Both the visualization engine and the metamodel can be considered as external tools whose evolution cannot be di-rectly controlled by the SV tool provider, unless they pro-vide one or both of them. However, this involves more work which distracts from the implementation of the SV tool’s core capabilities. It is therefore useful to provide a mechanism of protection against changes happening in ei-ther the visualization engine (e.g., the visualization engine is not supported anymore, not up-to-date, does not work on a certain platform, etc.) or in the metamodel (e.g., the im-plementation changes). By providing the right protection mechanisms it is even thinkable to replace either the visu-alization engine or the metamodel without having a (big) impact on the SV tool core. In our case we do so by means of Facade classes, in a more general case the main point is to define precise interfaces to the both the metamodel and the visualization engine. The quality and stability of these interfaces ultimately defines the overall stability of the tool.
4.2
The Internal Architecture
The core task of any visualization tool is to visualize (parts of) this internal graph representation. The visualiza-tion can be done by different means, but most tools visualize nodes as rectangles and edges as connecting lines between the rectangles. The internal architecture thus provides for functionalities to allow a visualization. This mainly in-volves providing guidance to the user and assist him in the process of visualization, i.e., what should be visualized and how?
Many static code visualization tools have adopted as internal representation the basic entity-relationship meta-model, internally represented as a graph consisting of nodes (the entities) and edges (the relationships).
The nodes. The nodes represent concrete and inconcrete software artifacts. Concrete artifacts can be localized in the source code and include classes, methods, functions, pack-ages, etc., whereas inconcrete artifacts cannot be localized within the source code, but represent often abstractions in the head of the developers. Examples for inconcrete arti-facts are groups of classes, subsystems, functionalities, etc. The edges. The edges represent relationships between the software artifacts. Once again we can identify concrete relationships like inheritance relationships and invocations
between methods, and inconcrete relationships between in-concrete artifacts. An example of such a relationship is a dependency between two subsystems (”subsystem A de-pends on subsystem B”) which cannot be localized within the source code.
This representation has the advantage of being domain independent, therefore making a mapping from a domain always possible. However, if domain-related information must be added, the E-R-metamodel is too general. This is where a parallel domain-dependent plugin hierarchy comes into play: we have seen that by using a parallel plugin hi-erarchy we can separate two concerns: one is the repre-sentation of a graph composed of nodes and edges in the mathematical sense, including all operations that go with it (traversing the graph, getting children nodes, etc.), the other is the domain-relevant information, i.e., the node rep-resents a certain software artifact and this information must be modeled as well. One alternative would be to encode ev-erything in the node and edge classes, thus having a deep hierarchy of items, composed of classes like ClassNode, MethodNode, InheritanceEdge, etc. A previous implemen-tation of CodeCrawler adopted this model, but the limits in terms of flexibility soon became evident: the nodes and edges classes became too large, since all item-specific func-tionality was encoded in them. A separation into two hier-archies practically froze the core model and made it become very stable, while the constant enhancements and additions of functionality have mainly an impact only on the plugin hierarchy.
4.3
The Visualization Engine
The visualization engine of a SV tool has an influence on its most prominent aspect, the visualization. Indeed, the user perceives it as the tool itself, since he does not see any other internal details. The design decisions to be taken in this case include the type of engine (3D vs. 2D), the degree of possible interactivity, and whether the engine comes from a third party as a possibly commercial product or whether the SV tool provider chooses to implement himself the vi-sualization engine as part of the tool.
Engine type (3D vs. 2D). This decision heavily influ-ences the visualizations provided by the SV tool. The use of 3D involves more navigation (e.g., fly-through) and more computing performance. Moreover, the added third dimen-sion must be exploited intelligently, for it is too easy to gen-erate nice looking 3D boxes.
Interactivity. Direct-manipulation interfaces which al-low for several kinds of direct interactions are known to be more user-friendly than others. They effectively reduce the latency between the perception of something of interest and the following investigation performed by the user. The user naturally wants to click on the interface to reduce the
dis-tance between what he sees and what he thinks he sees. This
translates to all kinds of interactions, like selecting, moving, removing, copying, inspecting, etc. visualized artifacts. We discuss this aspect in more detail later on.
Implementation. The decision whether to use or not a third party product (possibly a commercial one) has an im-pact on the implementation weight that the SV tool provider has. Naturally, third party and/or commercial products are more stable, faster and better documented, because the peo-ple that provide such products are more experienced and more engaged in graphical issues. It is all too easy for a SV tool provider to shift his attention towards the visualiza-tion part by providing nicer, faster and more colorful dis-plays at the expense of semantics: Ultimately the goal of a SV tool is to provide meaningful information, and not only nice displays, to the user. Therefore reusing graph visual-ization tools and libraries like Dotty, Grappa and GraphViz can break down the implementation time, but it can also in-troduce new problems like lack of control, interactivity and customizability.
A visualization engine is merely a vehicle, and not the goal of a software visualization tool. In that sense, although choosing the right engine is important, for the visualization tool the interface to the engine matters. The better-defined it is, the less time the tool provider spends on the engine. In our case we chose to use a lightweight engine which is easily extensible and which provides for all the necessary functionality.
One lesson learned is to choose the appropriate engine and to delegate the job of visualizing as much as possi-ble to the engine. Furthermore, the easier it is to visual-ize with an engine, the better. In case the tool provider chooses to implement his own engine, we recommend to use a lightweight incremental approach and to strive to ob-tain visualizations as quickly as possible. Another lesson learned is that keeping as much control as possible over the visualization engine, in terms of implementation, helps to increase the usability of a SV tool. The first experiments we did with external engines soon reached a limit, because they were not customizable and flexible enough for our needs. Put in simple words, total (or as much as possible) control is necessary in this case.
4.4
The Metamodel
The metamodel used by a SV tool has an influence on its internal architecture. In some SV tools there is no dis-tinction between the metamodel and the internal architec-ture. This has the drawback that the tool has a monolithic architecture, and that the concern of the metamodel is not clearly separated from the other parts of the tool. The SV tool provider has an interest in making this separation, since the metamodel comes with a considerable level of
com-plexity that should not be added to a software visualization tool’s complexity. The reason for this complexity resides in concerns like the collection of information (parsing source code, reading and writing of files in various exchange file formats and the storage and querying of this information (using databases, web browsers, etc.).
The general lesson is to separate metamodel concerns as much as possible from the implementation of a SV tool. The SV tool must interface to a metamodel and reuse its functionalities, but it should not be tied to it to prevent a mixing of concerns.
4.5
The Interactive Facilities
Modern computers allow for faster and more powerful displays. This has made direct-manipulation interfaces pos-sible, which allow the user to not only look at informa-tion on the screen, but to interact with it. Several publi-cations and books in the human-computer-interface (HCI) field point out that it is essential to give the user the possi-bility to ”play” with the displayed information. Since user interface design is not a topic of this paper we limit our-selves to point out its importance by citing some essential literature by Alan Cooper [7, 8], Jef Raskin [28], and Jeff Johnson [20].
The interactive facilities a software visualization tool provides heavily influence the quality of the tool in terms of reverse engineering. Storey et al. provide a list of 14 cognitive design elements needed for a reverse engineering process [33]. We deduce from that list that if a tool features direct manipulation it can facilitate navigation by provid-ing directional and arbitrary navigation, while at the same time it reduces disorientation effects by reducing the effort for user-interface adjustment. Put in simple words we can say that the user is more at ease with a tool that supports interactive visualizations.
At the implementation level the problem of interactivity is that it is a cross-cutting concern, i.e., interactivity must be provided by all parts of the system: the visualization en-gine provides graphical interactivity, while the internal ar-chitecture (and the metamodel) provide context-based inter-activity. A simple example are pop-up menus, which offer choices at a graphical level (delete figure, spawn window, ...) but also context-based choices (dive into a class node, inspect the senders of a method node, ...). In our case we have seen that the overall bridge architecture is able to cope with this problem: the context menu on a figure is built in succession by the figure, its facade, its item and its plugin, and then presented to the user. Other solutions to this prob-lem is to separate interactive facilities into separate classes and offer them as plugins.
5
Related Work
There have been quite extensive research on the evalu-ation and comparison of reverse engineering and software visualization tools. Bassil and Keller [1] compare several SV tools at a functional and practical level. Storey’s Ph.D. Thesis [32] is targeted more towards the cognitive aspects of software visualization. Bellay and Gall [3, 4] evaluate reverse engineering tools again at the level of offered func-tionalities and in terms of usability and extensibility. These and other excellent works are all targeted towards a qualita-tive evaluation of the tools.
However, to our knowledge there is no explicit work about the implementation and architecture of reverse engi-neering tools, and more specifically about software visual-ization tools. Pieces of this information can be gathered from the tools’ web sites, their documentation (if it exists) and the publications of the tool providers. Moreover, indus-trial and commercial tool providers do not like to disclose such information. The best-documented software visual-ization tool we know is Rigi [26], widely used since more than a decade, which comes with a 170 pages documen-tation. However, the documentation’s goal is to describe the functionalities provided by Rigi and not the way it is implemented, although this can be partly inferred. Shrimp Views [25], another well-known visualization tool, comes with a set of publications targeted more at cognitive issues [33]. Other visualization tools, like Gsee [15] or GASE [17] and many other excellent tools, come with more or less consistent documentation, while many of them, despite being open source, come badly documented. The lack of documentation, and CodeCrawler is no exception in this, is mainly due to the academic environment most of these tools have been developed in. Another phenomenon we have no-ticed is that consistent research has been conducted on soft-ware visualization where the tools are basically dropped and forgotten after the research has finished. Examples of such research publications include works by Riva [29], Kazman [22] and Jerding and Rugaber [19].
6
Conclusion
In this paper we have presented the internal architecture of a software visualization tool and have identified common problems and issues that are inherent to such systems at var-ious levels. The levels we have discussed include the over-all architecture, the internal architecture, the visualization engine, the metamodel and the interactive facilities of soft-ware visualization tools.
The overall architecture. An overall architecture which separates the three main parts (core, metamodel, visual-ization engine) of a software visualvisual-ization tool allows for higher flexibility and greater extensibility. At the same time
the SV tool becomes less vulnerable against software evo-lution processes.
The core / internal architecture. The design of the core of a SV tool is largely guided by the goals the tool provider has in mind. Although the notion of a graph consisting of nodes and edges seems trivial, the functionality that matters is the one added to this core and the way this functionality can be used by the tool’s users. In the case of CodeCrawler we have seen that there is a separation of the graph notion from a parallel, extensible, plugin hierarchy. This separa-tion allows for a great extensibility through subclassing and addition of functionality.
The visualization engine. The visualization engine’s main task is bring the visualizations of software to the screen. However, the degree of integration between a SV tool’s core and its visualization engine influences the qual-ity of the visualizations. Apart from providing protection mechanisms against changes in the visualization engine, the engine is also largely responsible for the level of interac-tivity a SV tool offers. Seen in this light we do not rec-ommend commercial (black-box) products, but favor white-box products whose classes can easily be reused by delega-tion or subclassing. In the case of CodeCrawler we protect it against changes by using a facade [16] and use and ex-tend a freeware, lightweight visualization framework called HotDraw. Note that some visualization engines provide a graph layout library as well. We recommend to use such libraries, because they can greatly reduce the complexity of a SV tool.
The metamodel. The metamodel’s task is to collect and store the data that is visualized by the SV tool. We rec-ommend the separation of the metamodel from the SV tool in order to keep the focus on the core functionalities of the SV tool. The metamodel can be developed by someone else than the tool provider that has more experience in that area. To make an example, the SV tool provider should not have to write a parser by himself, but reuse the existing parsers.
The interactive facilities. Providing interactive facili-ties to the viewer is essential to the quality of a software visualization tool. While at a purely technical level this should be provided by the visualization engine, the inter-actions that are enriched with context information are often provided by the the domain model, i.e., the internal archi-tecture of the SV tool.
Acknowledgments
We would like to thank Oscar Nierstrasz, St´ephane Ducasse, and the anonymous reviewers for their helpful comments.
This work has been funded by the Swiss National Science Foundation under Project No. 20-61655.00 (Meta-models and Tools for Evolution Towards Component Systems).
References
[1] S. Bassil and R. K. Keller. Software visualization tools: Sur-vey and analysis. In Proceedings IWPC 2001, pages 7 – 17, 2001.
[2] G. D. Battista, P. Eades, R. Tamassia, and I. G. Tolls.
Graph Drawing - Algorithms for the visualization of graphs.
Prentice-Hall, 1999.
[3] B. Bellay and H. Gall. A comparison of four reverse engi-neering tools. In Proceedings WCRE 1997, pages 2 – 11, 1997.
[4] B. Bellay and H. Gall. An evaluation of reverse engineer-ing tools. Journal of Software Maintenance: Research and
Practice, 1998.
[5] J. Bertin. Graphische Semiologie. Walter de Gruyter, 1974. [6] J. Brant. Hotdraw. Master’s thesis, University of Illinois at
Urbana-Chanpaign, 1995.
[7] A. Cooper. About Face - The Essentials of User Interface
Design. Hungry Minds, 1995.
[8] A. Cooper. The Inmates are running the Asylum. SAMS, 1999.
[9] S. Demeyer, S. Ducasse, and M. Lanza. A hybrid reverse engineering platform combining metrics and program visu-alization. In F. Balmas, M. Blaha, and S. Rugaber, editors,
Proceedings WCRE’99 (6th Working Conference on Reverse Engineering). IEEE, Oct. 1999.
[10] S. Demeyer, S. Ducasse, and S. Tichelaar. Why unified is not universal. UML shortcomings for coping with round-trip engineering. In B. Rumpe, editor, Proceedings UML’99
(The Second International Conference on The Unified Mod-eling Language), volume 1723 of LNCS, Kaiserslautern,
Germany, Oct. 1999. Springer-Verlag.
[11] S. Demeyer, S. Tichelaar, and S. Ducasse. FAMIX 2.1 – the FAMOOS information exchange model. Technical report, University of Bern, 2001.
[12] S. Ducasse and M. Lanza. Towards a methodology for the understanding of object-oriented systems. Technique et
sci-ence informatiques, 20(4):539–566, 2001.
[13] S. Ducasse, M. Lanza, and S. Tichelaar. Moose: an exten-sible language-independent environment for reengineering object-oriented systems. In Proceedings of the Second
Inter-national Symposium on Constructing Software Engineering Tools (CoSET 2000), June 2000.
[14] S. Ducasse, M. Lanza, and S. Tichelaar. The moose reengi-neering environment. Smalltalk Chronicles, Aug. 2001. [15] J.-M. Favre. Gsee: a generic software exploration
environ-ment. In Proceedings of the 9th International Workshop on
Program Comprehension, pages 233–244. IEEE, May 2001.
[16] E. Gamma, R. Helm, R. Johnson, and J. Vlissides. Design
Patterns. Addison Wesley, Reading, Mass., 1995.
[17] R. C. Holt and J. Pak. GASE: Visualizing software evolution-in-the-large. In Proceedings of WCRE’96, pages 163–167, 1996.
[18] R. C. Holt, A. Winter, and A. Sch¨urr. GXL: Towards a standard exchange format. In Proceedings WCRE’00, Nov. 2000.
[19] D. Jerding and S. Rugaber. Using Visualization for Archi-tectural Localization and Extraction. In I. Baxter, A. Quilici,
and C. Verhoef, editors, Proceedings Fourth Working
Con-ference on Reverse Engineering, pages 56 – 65. IEEE
Com-puter Society, 1997.
[20] J. Johnson. GUI Bloopers. Morgan Kaufmann, 2000. [21] R. E. Johnson. Documenting frameworks using patterns. In
Proceedings OOPSLA ’92, pages 63–76, Oct. 1992.
Pub-lished as Proceedings OOPSLA ’92, ACM SIGPLAN No-tices, volume 27, number 10.
[22] R. Kazman and M. Burth. Assessing architectural complex-ity. Technical report, University of Waterloo, 1995. [23] M. Lanza. Combining metrics and graphs for object
ori-ented reverse engineering. Diploma thesis, University of Bern, Oct. 1999.
[24] M. Lanza and S. Ducasse. A categorization of classes based on the visualization of their internal structure: the class blueprint. In Proceedings of OOPSLA 2001, pages 300–311, 2001.
[25] C. B. M.-A. D. Storey and J. Michaud. Shrimp views: An interactive and customizable environment for software ex-ploration. In Proceedings of International Workshop on
Pro-gram Comprehension (IWPC ’2001), 2001.
[26] H. A. M¨uller. Rigi - A Model for Software System
Construc-tion, IntegraConstruc-tion, and Evaluation based on Module Interface Specifications. PhD thesis, Rice University, 1986.
[27] B. A. Price, R. M. Baecker, and I. S. Small. A principled taxonomy of software visualization. Journal of Visual
Lan-guages and Computing, 4(3):211–266, 1993.
[28] J. Raskin. The Humane Interface. Addison Wesley, 2000. [29] C. Riva. Visualizing software release histories: The use of
color and third dimension. Master’s thesis, Politecnico di Milano, Milan, 1998.
[30] D. Schweizer. Navigation in object-oriented reverse engi-neering. Diploma thesis, University of Bern, June 2002. [31] J. Stasko, J. Domingue, M. H. Brown, and B. A. Price,
edi-tors. Software Visualization - Programming as a Multimedia
Experience. The MIT Press, 1998.
[32] M.-A. D. Storey. A Cognitive Framework for Describing and
Evaluating Software Exploration Tools. PhD thesis, Simon
Fraser University, dec 1998.
[33] M.-A. D. Storey, F. D. Fracchia, and H. A. M¨uller. Cogni-tive design elements to support the construction of a mental model during software exploration. Journal of Software
Sys-tems, 44:171–185, 1999.
[34] S. Tichelaar. Modeling Object-Oriented Software for
Re-verse Engineering and Refactoring. PhD thesis, University
of Berne, Dec. 2001.
[35] E. R. Tufte. Envisioning Information. Graphics Press, 1990. [36] E. R. Tufte. Visual Explanations. Graphics Press, 1997. [37] E. R. Tufte. The Visual Display of Quantitative Information.
Graphics Press, 2nd edition, 2001.
[38] C. Ware. Information Visualization. Morgan Kaufmann, 2000.