Improving hospital bed occupancy and resource utilization through
queuing modeling and evolutionary computation
Smaranda Belciug
a, Florin Gorunescu
b,⇑ aDepartment of Computer Science, University of Craiova, Craiova 200585, Romania b
Department of Biostatistics and Informatics, University of Medicine and Pharmacy of Craiova, Craiova 200349, Romania
a r t i c l e
i n f o
Article history:
Received 21 July 2014 Accepted 18 November 2014 Available online 26 November 2014
Keywords:
Queuing system Compartmental model Genetic algorithm Bed allocation optimization Resource utilization optimization What-if analysis
a b s t r a c t
Scarce healthcare resources require carefully made policies ensuring optimal bed allocation, quality healthcare service, and adequate financial support. This paper proposes a complex analysis of the resource allocation in a hospital department by integrating in the same framework a queuing system, a compartmental model, and an evolutionary-based optimization. The queuing system shapes the flow of patients through the hospital, the compartmental model offers a feasible structure of the hospital department in accordance to the queuing characteristics, and the evolutionary paradigm provides the means to optimize the bed-occupancy management and the resource utilization using a genetic algo-rithm approach. The paper also focuses on a ‘‘What-if analysis’’ providing a flexible tool to explore the effects on the outcomes of the queuing system and resource utilization through systematic changes in the input parameters. The methodology was illustrated using a simulation based on real data collected from a geriatric department of a hospital from London, UK. In addition, the paper explores the possibility of adapting the methodology to different medical departments (surgery, stroke, and mental illness). Moreover, the paper also focuses on the practical use of the model from the healthcare point of view, by presenting a simulated application.
Ó2014 Elsevier Inc. All rights reserved.
1. Introduction
A hospital department may face the situation when patients are turned away because all beds are occupied, and the corresponding healthcare service is thus postponed due to the insufficient num-ber of available beds. An insufficient financial support or a poor resource management often causes this situation. On the other hand, an over-provision of hospital beds or an unrealistic health service time is a waste of the already limited resources. Accord-ingly, there is need for a complex involvement bringing together under the same umbrella advanced analytical methods and machine learning techniques to help make better decisions regard-ing the allocation and use of hospital beds in order to improve patient care and save money.
A wide range of different techniques have been used and reported in the literature.[1]presents a model of the cost of treat-ing stroke patients within a healthcare facility ustreat-ing a mixture of
Coxian phase type model with multiple absorbing states. A non-homogeneous discrete time Markov chain incorporating time-dependent covariates is developed in[2]to model the patient flow in a cost or capacity constrained healthcare system. A multi-objec-tive comprehensive learning particle swarm optimization with a representation scheme based on binary search for bed allocation problem in general hospital is presented in [3].[4] developed a semi-closed migration network to capture patient flow into the clinic, and between the clinic and hospital.
Although queuing models are widely used in industry to improve customer service, the number of applications in health-care, however, is relatively small. This is probably due to the differ-ent nature of the two domains, the clidiffer-ent-patidiffer-ent equivalence being however difficult to be generally accepted. Previous works [5,6] have introduced M/PH/c and M/PH/c/N queuing models in order to optimize the use of hospital resources both in a loss model and in an extended model providing an extra waiting room. A multi-objective decision aiding model based on queuing theory and goal programming is introduced in[7]for allocation of beds in a hospital. A queuing approach based on non-homogeneous arri-val patterns, non-exponential service time distributions, and mul-tiple patient types along with a spreadsheet implementation of the resulting queuing equations is used in[8]to increase the capacity
http://dx.doi.org/10.1016/j.jbi.2014.11.010
1532-0464/Ó2014 Elsevier Inc. All rights reserved.
⇑ Corresponding author at: Department of Biostatistics and Informatics, Univer-sity of Medicine and Pharmacy of Craiova, 2 Petru Rares Str., Craiova 200349, Romania. Fax: +40 251 412 673.
E-mail addresses:[email protected](S. Belciug),[email protected],
[email protected],fl[email protected](F. Gorunescu).
Contents lists available atScienceDirect
Journal of Biomedical Informatics
of an Emergency Department. In [9] a decision support system based on the Erlang loss model is developed to evaluate the size of nursing units.
Compartmental models have previously been shown to provide a suitable description of the patient flow through a hospital depart-ment, especially for geriatric medicine. Starting with a determinis-tic two-compartment mathemadeterminis-tical model [10], further progress occurred when stochastic models along with mixed exponential distributions, continuous-time Markov model and Bayesian belief networks have been proposed[11–14].
This paper proposes a flexible strategy to improve the hospital management regarding its two main aspects: (a) bed allocation pol-icy, and (b) financial resource utilization. First, it uses results from queuing theory to model the patient flow, where a Poisson process describes the patients’ arrivals, hospital beds are servers, and the length of stay is modeled using a phase-type distribution. Second, in conjunction with the queuing system, a compartmental model describes the hospital department. Finally and most importantly, the previous approach has been enriched with the support of the evolutionary paradigm used to optimize both the bed allocation policy and the resource utilization. In addition, a ‘‘What-if’’ analysis has been performed to explore in depth the various possible options available for the hospital management. The main contributions of the paper are twofold: first, the evolutionary-based optimization of the hospital management, and, secondly, the ‘‘What-if’’ analysis allowing the evaluation of different available options.
2. Materials and methods 2.1. The queuing model
The theoretical model refers to a M/PH/c queuing system in which M denotes Poisson (Markov) arrivals, the service distribu-tion is phase-type[15], the number of servers isc, and no queue is allowed. In such aloss modelin which the customers that find all the servers busy are lost for the system,krepresents the Poisson arrival rate, and the phase-type service has the probability density function given by:
fðtÞ ¼X
l
i¼1
a
iq
ieait; ð1Þ
with the corresponding mean
s
¼Pli¼1q
i=a
i, wherelrepresents thenumber of phases/compartments,
a
isthe mixing proportions, andthe
q
isthe transition rates withPli¼1q
i¼1.The parameters defining the above queuing model,k,
s
, andcare considered as variable entities being subject to an optimization process enabling the improvement of the bed occupancy and resource utilization.
The average number of arrivals occurring during a time interval of lengthtis given bykt; thereby, theoffered loadof the system, i.e., the average numberaof arrivals during an average length of stay
s
isa¼ks
. Since the probability of havingjoccupied servers is given by: Pj¼ aj=j! Pc k¼0ak=k! ; ð2Þthe probability that all thecservers are occupied is given by: Pc¼Bðc;aÞ ¼
ac=c!
Pc k¼0ak=k!
ðErlang’s loss formulaÞ ð3Þ
In other words,B(c,a) represents the fraction of customers that is lost by the system[16,17]. Note that the above results apply when the system is in statistical equilibrium, i.e., after a sufficiently long period of time,Pjbeing referred as steady-state or statistical
equilib-rium probabilities.
2.2. Fundamental queuing characteristics
Basically, there are three fundamental quantities of interest for queuing models:
L– the average number of customers in system.
W– the average time spent in system by an arbitrary customer.
q
– the server occupancy.Among useful relationships between the above characteristics, we mention:
The carried load L=a[1B(c,a)], representing the average number of customers in system, also known asLittle’s formula. The average time spent in system by an arbitrary customer
W=
s
[1B(c,a)]. The server occupancyq
¼Lc(with
q
61 for steady-state).One of the two main goals of this study is an evolutionary-based optimization of the bed occupancy management by estimating the model’s parametersc,kand
s
, in order to obtain:An acceptable threshold for the delay probabilityB(c,a), seen as the suitable proportion of refused patients which the system is prepared to tolerate.
The corresponding average time spent in system.
The corresponding average number of customers in system.
2.3. The associated cost model
A main concern in proposing a model to solve real-world issues, especially in healthcare, is to provide the best service to customers with minimum costs by using the maximum utilization of existing resources. In queuing models, this could be ‘‘translated’’ by main-taining the lost requests (lost potential customers) at a minimum level with minimum costs. Following [5], a base-stock policy approach[18]is used to set up an associated cost model to balance the fraction of customers that is lost by the system against the ser-vice costs.
As it was stated above, the model’s parametersc,kand
s
are supposed to be variable. This study focuses on finding their (near) optimal values providing a trade-off between serving costs and penalty costs corresponding to unsatisfied demands.In order to define the associated cost model, let us consider that the numberc of servers comprises both the number of occupied beds and the number of idle beds, ready to be used in emergencies. In a similar fashion to the newsvendor model [18], the cost model envisages the two following parameters:
Aholding costofhunits per day per empty (non used) server. A fixedpenalty costof
p
units per unsatisfied orders.With the aim of improving servers occupancy and resource uti-lization in the long-run department activity, the cost per day under the base-stock policy with server levelc can be expressed as a function of the queuing system parametersc, k,
s
, and the cost model parametersh,p
, by:gðc;k;
s
;h;pÞ ¼
p
kBðc;ksÞ þ
h fcks ½1
Bðc;ksÞg
ð4ÞBased on the cost functiong(c,k,
s
,h,p
), the issue of optimizing the inventory level, in other words, the resource utilization, is equivalent to a minimization problem, i.e., to findc,k,s
,h, andp
in order to minimize the cost (fitness) functiong.A controversial method still in use in healthcare to measure the inpatients activity is based on the turnover per allocated bed per
year, given by the ratio between the number of admissions per year and the number of allocated beds per year. Thus, the average turnoverT is given byT¼365k=c admissions/patients per bed [19]. The cost function along with the average turnover represent the main economic parameters measuring the efficiency of the resources utilization.
2.4. Patient flow modeling – the compartmental model
One of the ideas to bear on patient flow modeling is to consider compartmental models, which have been shown to provide an effi-cient proven description of patient dynamics at least for geriatric medicine[10]. Briefly, patients are admitted to the first compart-ment (e.g., acute care). Some are successfully treated and dis-charged, and, unfortunately, some die. A third group may need additional treatment, and thus, these patients are transferred to another section (e.g., rehabilitation); patients may be discharged from this compartment, or die there. This process may continue, depending on the specific case, three to six compartments being considered[12,20,21]. The situation describing the simplest but the most common case, a classical two-compartment model, is depicted inFig. 1.
The admission policy envisages the situation where admissions occur at random (i.e., Poisson arrivals), such an assumption being reasonable for a stable hospital system.
Regarding the service time distribution, such compartmental models, either discrete-time deterministic or continuous-time sto-chastic, may be regarded as phase-type[15]with the number of components equaling the number of compartments. These distri-butions describe the time to absorption of a finite Markov chain in continuous time, when there is a single absorbing state and the stochastic process starts in a transient state.
2.5. Optimization through evolutionary computation
Computer-based patient modeling sounds well and represents a major concern in patient management. The optimization method chosen in this case involves the use of genetic algorithms (GAs) to estimate an acceptable threshold for the delay probabilityB(c,
a), and to minimize the cost functiong(c).
GAs are natural computing algorithms consisting of the follow-ing components: populations of chromosomes, selection accordfollow-ing to fitness, crossover to produce new offspring, and random muta-tion of new offspring. The algorithm consists of the following steps [22,23]: (Step0) – the data are encoded in a vector form and the recombination and mutation rates are picked; (Step1) – the popula-tion, consisting of a certain numbernof chromosomes, is chosen; (Step2) – the fitness function is computed for each chromosome; (Step 3) – the iteration takes place through the following steps (selection, crossover and mutation) untilnchromosomes have been generated; (Step4) – replacing the current population by the new
one, and (Step5) – using the termination criterion to stop the evolu-tionary process.
We present below the corresponding evolutionary algorithm.
GA algorithm
1. A population consisting of a certain numbernof chromosomes is randomly chosen from an appropriate interval.
2. Using the tournament selection operator, n chromosomes are chosen for reproduction; one chromosome can appear several times in the newly formed population.
3. Using the recombination probability,mparents are chosen for reproduction.
4. The newly formed offspring replace themparents.
5. The new population is formed by the (n–m) chromosomes that were not chosen for reproduction plus the newly formed m offspring.
6. Using the mutation probability pm, the normally distributed
mutation operator is applied on the whole population. If the ness of the mutant is better than the original chromosome’s fit-ness, then the mutant replaces the original in the population. 7. The cycle is repeated until the termination criterion is reached.
2.5.1. Remarks
1. A problem related to the convergence speed of a GA is the appropriate choice of the population size n. Using a heuristic evaluation, with population sizes ranging from 50 to 150 chro-mosomes, the best performance has been obtained forn= 100 chromosomes.
2. Another problem that arises in the use of GAs is the appropriate choice of the parameters defining the variations operators. We considered the parameter tuning, using the whole (total) arith-metic recombination with the crossover rate pc= 0.35 and
parameter
a
= 0.3, and the non-uniform (normally distributed) mutation with mutation ratepm= 0.4.3. Using a heuristic evaluation, with the number of generations ranging from 50 to 150, the manual inspection of the values of the fitness functions (eitherBorg), combined with different thresholds indicated that 100 is the (near) optimal value. 4. Since the distribution of data is not always normal (Poisson
arrivals, phase-type service), the appropriate intervals (search space) for the corresponding chromosomes were estimated as <mean ± 1.96SD>, seen as substitutes of the 95% confidence intervals (95% CI) for the mean of each parameter.
2.6. Evolutionary-based optimization of bed-occupancy and resource utilization
The management of hospital beds is an important nowadays task, and various models have been proposed, mostly based on operations research techniques (e.g., stochastic processes, queuing theory, etc.) [1,2,5–7,12,13,21]. This approach involve the con-struction of the corresponding mathematical model, which is time and resources consuming, due to the computational and statistical nature of most of these techniques. An attractive and effective alternative to this classical approach is represented by the use of GAs. Some of the reasons to use GAs are: (a) they can solve any optimization problem described with chromosome encoding, (b) the method is very easy to understand and implement without deep mathematical knowledge, (c) the number of parameters can be very large, and (d) there are no major constraints for the fitness function. Due to their efficacy, computation speed and wide range of applicability, we have chosen to use GAs as optimization tech-nique for hospital bed occupancy and resource utilization.
2.6.1. Optimization of bed-occupancy management
The first task of this research is to optimize the bed-occupancy management by estimating the sufficient number of beds in order to maintain at a tolerable level the number of rejected requests.
When using the GA approach, a chromosome is represented by a vector (c,k,
s
), with the genesc,kands
belonging to specified domains (95% CI) matching real-world medical data. The corre-sponding fitness measure is given by the delay probabilityB(c,a). Since, in this context, the main task is maintaining the rejection probability level as low as possible, the objective (fitness) functionB(c,a) has to be minimized, depending on different thresholds.
2.6.2. Optimization of resource utilization
The second aim of the study is to estimate the optimal model parameters enabling the best healthcare service to patients with maximum resources utilization, in other words, to find the optimal balance between holding costs and penalty costs.
Technically, a chromosome is represented this time by the vec-tor (c,k,
s
,h,p
), the fitness function being now represented by the corresponding cost functiong.In the end, health professionals can use the model to answer several questions regarding the management of hospital depart-ments (arrival policy, average length of stay, optimum bed occu-pancy, costs, etc.) enabling them to anticipate hospital bed allocation and expected healthcare costs.
2.7. What-if analysis
‘‘What-if analysis’’ has been finally performed with the purpose of exploring the effects on the outcomes of the queuing system and resource utilization through systematic changes in the input parameters. Given an input change (parametersc,k,
s
,h, andp
), this sensitivity analysis detects how the two main models’ perfor-mance measures: (a) the delay probabilityB, and (b) the cost func-tiongare affected by this change, and how could they be tuned to respond to the management optimization issue.2.8. Department of geriatric medicine model
The methodology presented above is illustrated using bed-occupancy data collected at the Department of Geriatric Medicine – St. George’s Hospital, London (1969–1984) [19], and January 2000[24]. The healthcare assistance consisted of acute, rehabilita-tive and long-stay medical service.
During these years, different admission policies and inpatient management were considered. Admission experienced annual changes, with periodic increases and decreases due to both man-agement policies and seasonal events (Christmas, Easter, influenza epidemic, etc.).
Three different styles were adopted for the inpatient manage-ment: (a) one-compartment model (combined acute, rehabilitative and long-stay) in 22% of cases, (b) two-compartment model (com-bined acute and rehabilitative wards, with separate long-stay) in 38% of cases, and (c) three-compartment model (separate acute, rehabilitative and long-stay wards) in 25% of cases. As it can be seen, the two-compartment case, depicted in Fig. 1, is the most prevalent.
As inventory policy, the department allocated, on average, 186 beds per year. Whatever the case, a mean arrival rate equaling k= 5.9 patients per day and a mean length of stay equaling
s
= 24.9 days were found to be well described by the data[5].Regarding the associated cost model, since the data came from the National Health Service (NHS), the profit was assumed zero. Taking into account the general practice in those times, the cost parameters were estimated as follows[5]:
The total cost per patient per day is £168 (£50 are incurred with respect to the bed, and £118 with respect to the treatment). The holding cost ish= £50 per day.
The penalty cost
p
is computed as follows. Considering that the total cost of turning away a patient may equal the cost per day multiplied by the expected length of stay, and the penalty cost represents 25% of the total cost of turning away a patient, we can estimate the penalty costp
= 16824.90.25 = £1046. It is worth noting that this assumption is only indicative, esti-mating the lowest approximation for cost based on the assumption that penalty may be broadly regarded as lost revenue incurred when a patient is turned away due to no empty beds available.2.9. Extending the methodology to different medical departments
Unlike the usual patients, geriatric patients have to face differ-ent healthcare experiences regarding hospitals, rehabilitation facil-ities, nursing homes, long-term care, assisted living, etc., resulting in different flow patterns (admission, length of stay), compartmen-tal type, and costs. In this regard, when adapting the model from geriatrics to other medical departments, although the underlying paradigm can be kept, the practitioners have to anticipate a more dynamic patient flow, with different values of the corresponding parameters, and the cost function components[19].
Theoretically, changing policies might lead to a reduction in length of stay (or indeed arrival rate). When hospital administra-tors seek to improve the patient management, whatever the department specialty, they find the difficulty to implement the change. This is true especially when recommended changes directly affect the patient quality of healthcare (e.g., length of stay). On the other hand, the arrival rate is influenced by external factors, and cannot be directly controlled by healthcare professionals. Accordingly, in addition to the difficulty of such an approach regarding possible changing policies, the lack of confidence in the success of proposed changes puts a serious obstacle on continuous improvement efforts.
2.9.1. Surgical data
According to the American Hospital Association (AHA) Annual Survey of Hospitals[25], the corresponding parameters referring to surgery were estimated as k= 16.14 patients per day,
s
= 5.5 days, andc= 150 beds -community hospitals (one-compart-ment system).2.9.2. Stroke data
The data originates from the UK’s Hospital Episode Statistics (HES) database and concerns stroke patients[26,27]. The corre-sponding parameters were estimated as k= 286.2 patients per day,
s
= 14.29 days, andc= 5587 beds -three-compartment system.2.9.3. Mental health data
The data originate from the Center for Mental Health Policy and Services Research (CMHPSR), Department of Psychiatry, School of Medicine, University of Pennsylvania (Medicaid)[28]. The corre-sponding parameters were estimated as k= 1.907 patients per day,
s
= 1151 days, andc= 562 beds -three-compartment system.2.9.4. Associated costs
The inpatient hospital costs represent the largest component of healthcare expenditures in most developed countries nowadays. The inpatient costs are far from being uniformly and undoubtedly assessed. According to [29,30], the average hospital adjusted expenses per inpatient day was $1730 throughout USA, and £225 in UK. Consequently, the actual inpatient costs are estimated by each hospital. While the cost functiongmay be used as it is, the
parametershand
p
may be adjusted by each user following the same paradigm as in the geriatric model.3. Results
In what follows, the evolutionary based optimization is used to provide an efficacious management of bed occupancy and resources utilization, enabling thus the hospital manager to bal-ance the beds inventory against the cost of refusing patients’ access to healthcare facilities and service.
3.1. Bed-occupancy optimization
In this subsection, the experimental results envisaged the use of the proposed GA to estimate the near optimum values of the parametersc,kand
s
to maintain at a tolerable level the probabil-ity of lost demandsB(c,a). In this regard, the aim is to minimize the objective (fitness) function B, taking into account different straints (thresholds) regarding its range of values. There is no con-sensus among practitioners regarding what qualifies a certain percentage of lost demands as a tolerable level in geriatric medi-cine, but it suggests that running with percentage occupancy above eighties leads to significant increases in rejection of patients[31]. We consider the highest threshold equaling 10% as a maximum rejection tolerable level, with the corresponding percentage occu-pancy ranging between 88% and 95%.The corresponding search spaces for the chromosomes encoding the queuing model parame-ters are the following:Number of allocated bedsc2[120, 170]. Arrival ratek2[5, 7].
Length of stay
s
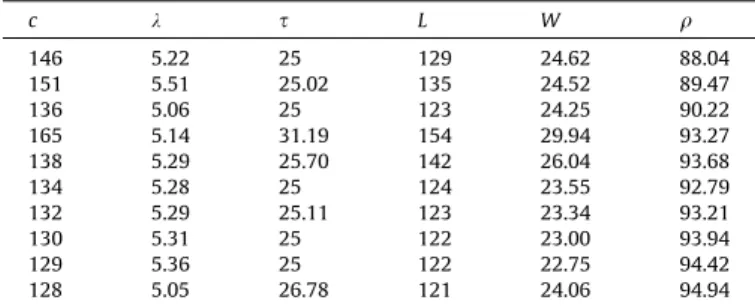
2[24.5, 25.5].Table 1 illustrates the GA approach to optimize the queuing model by presenting some values of the rejection/delay probability
B(c,a) in ascending order as function of different values of the queuing system parametersc,k, and
s
, and different thresholds.The GA approach has revealed that the minimum rejection probability (1.5% of patients being turned away) can be achieved with 146 beds, arrival rate around 5.22 patient/day, and an average service time (length of stay) equaling 25 days, figures close to the standard of a geriatric department. It is worth noting that this potential managing performance was obtained using the GA approach for 146 beds only, much lower than the standard 186 beds. Moreover, it is worth noting that, from the evolutionary experiment, it resulted that the queuing system is extremely flex-ible since the same rejection probability of 5% can be achieved either with 138 beds or 164 beds, but depending on different arri-val rates and service time (5.29/25.7 vs. 5.18/31.04). Taking into account this observation, the manager can juggle the number of beds according to the given situation.
Next,Table 2presents some values of the models’ performance measuresL,W, and
q
as functions ofc,k, ands
.The first row displays the system characteristics corresponding to the minimum proportion of refused patients, obtained using GA. In addition, we can see from this table that the bed occupancy is not directly related to the number of allocated beds, in the sense that, as we would expect, the greater the number of beds, the lower the bed occupancy. For instance, the same bed occupancy equaling around 93% is obtained both with 132 beds and with 165 beds, the other parameters playing, naturally, a significant role. Irrespective of different values ofc,k, and
s
, comparable with the common practice, the average time spent by a patient is close to the average value (24.61 vs. 24.9), while the average number of patients varies noticeably (from 121 to 154). It follows that, given the framework complexity, it is difficult to manage the bed allocation without the aid of computer simulation and optimization.3.2. Resource utilization optimization
In what follows, we illustrate the evolutionary-based optimiza-tion of the corresponding healthcare costs, thus facilitating an effi-cient access to medical service. The experimental results envisaged the use of the proposed GA to estimate the near optimum values of the parametersc,k,
s
,handp
in order to maintain at a min-imum feasible level the cost functiong, but with a reasonable pro-portion of patients turned away. In this context, the goal is to minimize the objective (fitness) functiong. In addition to the cost minimization, the corresponding average turnover per allocated bed per year (T) is also computed.Table 3presents some values of the cost functiongin ascending order, and the corresponding turn-over per allocated bed, as functions of different values of the queu-ing system parametersc,k,s
, and the associated costshandp
. Since the chromosomes may be initialized in searching spaces where optimal solutions are likely to be found, we considered the penalty cost ranging between £1046 and £2050[5], the starting value equal-ing the default estimation (the lowest approximation for the pen-alty cost).The evolutionary approach has revealed that the minimum healthcare cost (£610.91) can be achieved with 149 beds, arrival rate around 5.51 patient/day, an average service time (length of stay) equaling 25 days, a holding costh= £30, and a penalty cost
p
= £1250. These figures are close to the standard of a geriatric department, excepting the number of allocated beds (149), much lower than the yearly average (186), and the holding cost ratiop
/h= 41.67 better than the optimal one reported in literature[5], equaling 40.The model we have developed, based on the strengths of the GAs, can be used as supporting tool to efficiently improve the stock policy of a geriatric department, by simultaneously using all the parameters defining the system. It can be extended without major difficulties to different medical departments.
Table 1
The values ofB(c,a) for different queuing system parameters.
c k s B(%) q(%) 146 5.22 25 1.5 88.04 151 5.51 25.02 2 89.47 136 5.06 25 3 90.22 165 5.14 31.19 4 93.27 138 5.29 25.70 5 93.68 134 5.28 25 6 92.79 132 5.29 25.11 7 93.21 130 5.31 25 8 93.94 129 5.36 25 9 94.42 128 5.05 26.78 10 94.94 Table 2
The fundamental characteristicsL,W, andqfor different parameters’ values.
c k s L W q 146 5.22 25 129 24.62 88.04 151 5.51 25.02 135 24.52 89.47 136 5.06 25 123 24.25 90.22 165 5.14 31.19 154 29.94 93.27 138 5.29 25.70 142 26.04 93.68 134 5.28 25 124 23.55 92.79 132 5.29 25.11 123 23.34 93.21 130 5.31 25 122 23.00 93.94 129 5.36 25 122 22.75 94.42 128 5.05 26.78 121 24.06 94.94
3.3. What-if analysis
We envisaged a ‘‘What-if analysis’’ using 35 simulated data in the following context:c2[125, 165] (avg. 141 beds),k2[5.05, 6] (avg. 5.31 patient/day);
s
2[24.9, 31.2] (avg. 25.54 days),h2[30, 105] (avg. £64);p
2[1046, 2050] (avg. £1534).The purpose of this sensitivity analysis is twofold:
(a) First, to explore how the delay probabilityBis affected by changing the number of beds, the arrival, and the mean ser-vice time. Two scenarios have been considered in this respect: (a) evaluating B(c,
s
) for constant avg. k= 5.31 patient/day, and (b) evaluatingB(k,s
), for avg.c= 141 beds. The first scenario enables simulated experiments with dif-ferent number of beds and mean medical service time for a fixed arrival ratek= 5.31 patient/day, which is close to the customary case. These changes are feasible for the hospital management, as long as it cannot change, practically, the arrival rate. The second scenario enables the exploration of the influence of the balance between the arrival rate and the mean service time upon the delay probability for a fixed number ofc= 141 beds (inventory frequently encountered in reality).(b) Second, to investigate the change of the cost per day under the base-stock policyg depending on the changes of both the department facilities/policy (number of beds and mean service time) and the cost model parametershand
p
. Two scenarios have been considered in this respect: (a) evaluat-ing g(c,s
) for constant avg.p
= £1534, h= £64, k= 5.31 patient/day, and (b) evaluating g(p
, h), for constant avg. c = 141 beds,k= 5.31 patient/day, ands
= 25.54 days. Inspired by theindifference curvesparadigm[32]and by the pre-vious work[5], we can analyze under what conditions we are indif-ferent between neighboring values of the control variables (c,s
), (k,s
), and (p
,h), regarding both the delay probability and cost function. Extrapolating the level/contour curves concept, the underlying equations involved in this approach are:B(c,s
) =B(c+Dc,s
+Ds
),B(k,
s
) =B(k+Dk,s
+Ds
), g(c,s
) =g(c+Dc,s
+Ds
), and g(p
,h) =g(
p
+Dp
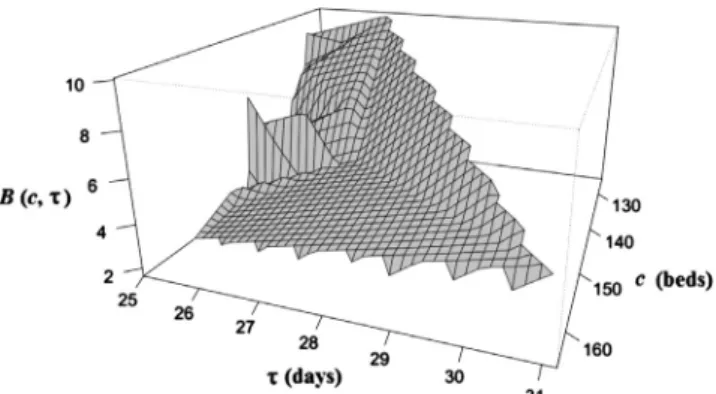
,h+Dh), where Drepresents the increasing factor.Geometrically, it is about ‘‘plateaus’’ with some possible ‘‘peaks’’ and ‘‘ravines’’, illustrating the relative ‘‘flatness’’ of the response variables Band g. We have illustrated the indifference surfaces through 3D graphics obtained with the freely available R program-ming language. R is widely used in Statistics and Data Mining, has extensive documentation and active online community support, being a very good environment for statistical computing and graphics.
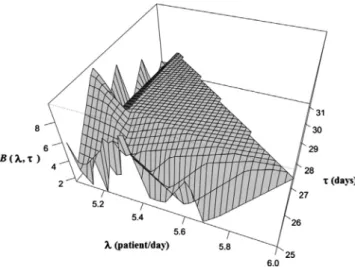
The results corresponding to the first two scenarios described in (a) are illustrated inFigs. 2 and 3.
The graph and the corresponding data suggest that we may be indifferent to the delay probabilityBif:
The number of beds ranges from 130 to 164 (Dc= 34) and the
mean service time is 25 days (D
s
= 0.02), thus yielding avg.B= 2.02%, SD = 0.38%.
The number of beds ranges from 132 to 142 (Dc= 10) and the
mean service time is 25.36 (D
s
= 1.78), thus yielding avg.B= 8.88%, SD = 0.83%.
Accordingly, the hospital manager may choose to keep a num-ber of beds equaling 130 for an expected lost demand percentage not exceeding, on average, 2% and assuming a mean service time equaling 25 days. On the other hand, 132 beds are sufficient to keep the lost demand percentage around 9%, supposing an increase of the mean service time up to 25.36 days. It is worth noting that the significant increase of the lost demand was affected by a rela-tive small increase of the mean service time. These observations are consistent with the analysis based on the indifference surfaces that highlights the two ‘‘plateaus’’ of the graph ofB.
The graph and corresponding data, along with the indifference surfaces analysis, suggest that we may be indifferent to the delay probabilityBif:
The arrival rate ranges from 5.15 to 5.68 (Dk= 0.53) and the mean service time is 25 (D
s
= 0.02), thus yielding avg.B= 1.96%, SD = 0.36%.
The arrival rate ranges from 5.05 to 6 (Dk= 0.95), the mean ser-vice time is 25.35 (D
s
= 1.78), thus yielding avg. B= 8.88%, SD = 0.82%.These results are consistent with the previous ones. Thus, for a mean service time equaling 25 days, the average lost demand per-centage is around 1.96%, increasing to 8.88% for a mean service time equaling 25.35 days, insignificantly depending on the arrival rate.
In both above scenarios, the hospital manager can control the delay probability mainly through the mean service time. Note that the arrival rate is naturally governed by randomness and cannot be directly controlled. From the above results, it follows that the delay probability is mainly sensitive to the change of the mean service time and is not significantly affected by the relative changes of the number of beds and arrival rate. This fact is also confirmed byTable 2, regarding the influence ofc andk upon the average number of patients in hospital.
The results corresponding to the second two scenarios described in (b) are illustrated inFigs. 4 and 5.
Table 3
The values of the costgand average turnoverTfor different model’s parameter.
c k s h p g T 149 5.51 25.00 30 1250 610.91 13.49 151 5.51 25.02 30 1550 649.93 13.31 138 5.22 25.00 30 2050 665.27 13.99 144 6 25.00 104.6 1046 887.78 15.20 143 5.08 27.01 52 1450 904.23 12.96 165 5.14 31.90 52 1550 954.63 11.37 136 5.06 25.00 52 2050 997.34 13.58 133 5.29 25.20 105 1550 1463.37 14.51 139 5.23 26.67 105 1750 1537.02 13.73 142 5.61 25.00 105 1850 1614.93 14.42
The graph and corresponding data, along with the indifference surfaces analysis, suggest that we may be indifferent to the cost functiongif:
The number of beds ranges from 130 to 164 (Dc= 34) and the
mean service time is 25 (D
s
= 0.2), thus yielding avg.g= £632.15, SD = £14.62.
The number of beds ranges from 125 to 142 (Dc= 17) and the
mean service time ranges from 25 to 25.67 (D
s
= 0.67), thus yielding avg.g= £1513.11, SD = £92.83.As evidenced by the fist scenario, a balanced policy regarding the number of beds and the mean service time, with emphasis on the latter one, may lead to a lower lost demand percentage, with corresponding lower penalty cost. Analogously, a bed alloca-tion equaling 130 and a mean service time no more than 25 days may lead to minimum lost demands and minimum costs for the hospital.
This graph and corresponding data, along with the indifference surfaces analysis, suggest that we may be indifferent to the cost functiongif:
The penalty cost ranges from £1046 to £1650 (avg.
p
= £1332, SD = £205) and the holding costs are £30, thus yielding avg.g= £629.19, SD = £13.53.
The penalty cost ranges from £1450 to £2050 (avg.
p
= £1750, SD = £216) and the holding costs is £105, thus yielding avg.g= £1530.95, SD = £84.17.
Consequently, the hospital manager may choose to keep the holding costs equaling £30 for an expected average cost function
g= £629.19, irrespective of the penalty cost no more than £1650. On the other hand, the holding costs above £105 may lead to an increase of the function cost up to £1614.93 (avg.g= £1530.95) if penalties increase up to £2050.
As an overall conclusion, the substantial difference between the holding cost and the penalty cost makes the weight of the rejected applicationsBto significantly surpass the weight of the number of empty beds, as revealed by formula (4). Under these circum-stances, the hospital manager can choose the adequate minimum number of beds and a suitable mean service time, in order to min-imize the costs and maintain a proper medical care, by keeping at a low level the percentage of the lost demands.
Note that the penalty cost is just indicative, being based on the assumption that penalty may be regarded in some sense as lost revenue incurred when a patient is turned away (no empty beds available).
Unlike the previous approach focused on queuing techniques only, the methodology proposed in this paper inherits the versatil-ity and efficiency of the evolutionary computation, encoding in a complete and unitary manner by means of the chromosome, the whole information provided by both the queuing side (c, k,
s
) and cost side (h,p
). Instead of providing partial results regarding the optimization of the inventory or of the costs, by considering as control variables just the number of beds and the penalty to holding cost ratio, we considered all the five parameters defining the degrees of freedom for the model, providing solutions for opti-mum inventory and costs, and potential valuable suggestions resulting from the ‘‘What-if’’ analysis.4. Applying the strategy to patient management. Example
Different approaches originating in the machine learning tech-niques and operations research brought a significant contribution to providing practical ways of managing patients in a more effi-cient manner [33]. An effective patient flow can reduce the unwanted and potentially harmful case of rejected patients, the overcrowding of hospital departments, inefficient beds allocation, increasing the healthcare quality and providing a patient-friendly environment.
Fig. 3.Graph of the delay probabilityB(k,s).
Fig. 4.Graph of the cost functiong(c,s).
From a theoretical point of view, the people involved in the hos-pitals management need to: (a) understand and evaluate the patient flow parameters, the available inventory and financial resources, (b) identify the actual possibilities of amending the deci-sion parameters (e.g., length of stay, availability of unstaffed beds, costs per occupied/unstaffed bed, penalty costs, etc.), (c) estimate/ forecast changes in the government healthcare philosophy regard-ing bed stock and financial support, and (d) analyze and estimate how the calendar and time of day affect admissions.
The implementation of the model should encompass the follow-ing steps: (a) analysis of the data records regarding the patient flow in order to estimate the queuing model parameters and the corresponding searching space (GA implementation), (b) analysis of the bed allocation history (constrains in bed stock, bed closure, bed crisis, etc.) allowing the use of different scenarios regarding the bed inventory (‘‘What-if analysis’’), (c) analysis of the changes in the hospital management philosophy regarding the allocated budget in order to estimate an appropriate mean service time
s
, affordable number of occupied/unstaffed beds, affordable average cost for inpatient day, and (d) analysis of the time series regarding the pattern of hospital admissions in order to identify its principal components (trend, cyclical, seasonal, and irregular) allowing to forecast its behavior and to propose optimal future costs policies. There are, generally, two kinds of parameters defining the underlying queuing model. Thus, there are parameters the health-care professional cannot change, such as the arrival rate or the mean service time (length of stay). We consider these parameters as ‘‘objective’’ parameters. It is noteworthy that even these objec-tive parameters may change in some circumstances. For instance, the arrivals can vary due to external factors (e.g. demographics, epidemiology, or perceptions). On the other hand, even for partic-ular procedures, the lengths of stays for two different patients were seen to differ by more than one week[34]. The other parameter type that can be changed by the healthcare professionals in some circumstances is seen as ‘‘subjective’’ parameter.For the evolutionary-based optimization, we implemented a standard GA[35]in Java. The model described in the paper can be implemented using freely available software (e.g., Java, R pro-gramming language, ECJ (ECLab-George Mason University (http:// cs.gmu.edu/~eclab/projects/ecj/), etc.), or a classical software pack-age (e.g., MATLAB/Genetic Algorithm Solver). It is worth mention-ing that one can use, for instance, the movmention-ing average forecast to estimate a certain parameter at timeT, as average of the lastm
observations, wheremis the moving average interval chosen by the user, if the mean does not change dramatically. MS Excel pro-vides an easy way to calculate the moving average of a time series. To illustrate the above considerations, we present a fictitious example consisting in three different bed allocation policies. Imag-ine a steady-state geriatric department with the ‘‘objective’’
parameters k5.22 patients per day and length of stay
s
25 days, and the ‘‘subjective’’ parameter c within the range 120–170. The penalty costp
equals the default value of £1046 [5]. Applying the mix queuing/GA model, we simulated three dif-ferent scenarios regarding the choice of the control (‘‘subjective’’) parameters c ands
, along with the corresponding rejection proba-bilityB, carried loadL(average number of inpatients), and incurred costs, computed as: (a) total costs TC = £168L(cost per patient per day multiplied by the average number of inpatients); (b) pen-alty cost PC corresponding to the fraction of lost patients computed as PC =p
B; (c) costs of unstaffed beds UBC = £50ec (cost per bed multiplied by the number of unstaffed bedsec). The results are displayed inTable 4.In order to reduce the healthcare costs, which are a current sub-ject of political debates, the managers commonly seek to allocate the minimum possible number of beds (adding extra beds, if nec-essary), although the opposite situation can also be imagined.
Assume that in this case the default number of beds is c= 132. Using the optimization model, they may face the following alternatives:
–Scenario#1: Choosing the smallest number of bedc= 132. The drawbacks of such a choice consist of the largest fraction of rejected patients (B= 5.7%), with possible negative conse-quences regarding the public perception, and the largest costs (TC = £20,674, PC = £59.62); UBC = £0.
–Scenario#2: Adding 11 extra beds (c= 143 allocated beds). The corresponding advantages of this choice consist of a 2.6 times smaller fraction of rejected patients (B= 2.2%), and reduction of associated costs (minus £817 for TC, and minus £73 for PC). On the other hand, the cost per unstaffed beds increased by £550.
–Scenario #3: Adding 14 extra beds (c= 146 allocated beds). Although the difference towards the above scenario regarding the number of beds (plus three beds) might seem insignificant, the benefits related to costs are notable. TC increased by £104, while PC decreased by £7.32. The cost per unstaffed beds increased by £150. Compared to the first case, TC decreased by £921, and PC also decreased by £44; the cost per unstaffed beds increased by £700. The most consistent advantage is that the fraction of rejected patients decreased by approximately four times. In addition, if we assign, for instance, a penalty cost
p
1= £1950 in the first scenarios,p
2= £1450 in the second one, andp
3= £2050 in the third one, respectively, then the corre-sponding cost functions g’s are estimated as g1= £1596.51, g2= £621.22, andg3= £681.96. Comparing the first and the last models (the largest difference of beds, 14), one can see that a difference of £100 regarding the penalty cost results in a decrease of about £915 of the corresponding function cost even though the number of beds increased by 14. To conclude, this simple example highlights the importance of considering the associated function cost to any patient model.5. Discussion
In this paper, we explore the feasibility of using a mix Opera-tions Research and Artificial Intelligence approach to support the hospital bed occupancy and resource utilization. The goal is to pro-vide healthcare professionals a supporting computer-aided tool to decide what policies could be introduced at greatest effect. It is noteworthy to mention that such an approach is far to be directly used by hospital administrators, its main role being to offer a sup-port decision-making.
The paper focused on three goals. First, starting from a standard M/PH/c queuing model for bed-occupancy in hospitals, a novel evolutionary-based approach is proposed to optimize the hospital management by providing an efficient way to estimate the system control parameters in order to obtain:
A suitable proportion of refused patients which we are prepared to tolerate.
The corresponding average time spent in hospital. The corresponding average number of patients in hospital. The bed occupancy.
Table 4
Results of three different bed allocation policies.
k s c B
5.22 25.00 132 5.7
143 2.2
Secondly, by considering a base-stock policy often used in inventory systems of expensive and slow-moving items, and assuming the non-profit practice common to the National Health Service, we provided a way to optimize the resource utilization based on the evolutionary paradigm. Taking into account both the queuing model features and the cost model characteristics, encoded in a chromosome vector form, we have provided the hos-pital manager the means to estimate the appropriate parameters for optimal resource utilization. Thus, juggling with the bed inven-tory, arrival rate, mean service time, holding and penalty costs, it is possible in such a way to make a hospital department more effective.
Finally, we proposed a ‘‘What-if’’ analysis that enables the hos-pital manager to simulate several scenarios, so that, depending on the circumstances, to make the (near) best decision.
We illustrated the methodology using bed-occupancy data based on the practice of the Department of Geriatric Medicine of St. George’s Hospital, London, UK. The cost model was inspired by a previous study[5], this approach being meant to be indicative, actual costs depending only on the concerned hospital.
The idea of using the evolutionary paradigm to optimize the hospital inventory and corresponding healthcare is advantageous and handy in several aspects:
It encodes in the chromosome the whole information provided by both the queuing system and the cost model.
The GA approach is transparently presented.
The corresponding algorithm is easy to understand and
implement.
The optimization process is straightforward and is based on the use of the whole information at one dash.
This methodology can be adapted to a wide variety of situations of this type.
6. Conclusion
The use of queuing models is widely widespread in healthcare systems to improve the patient management. On the other hand, GAs are natural computing algorithms, mostly used in optimiza-tion problems, due to their efficiency and relative comprehensibil-ity and easy-to-use. The effectiveness of the novel approach, which brought together the queuing models and the evolutionary para-digm, was proved on the task of optimizing the patient manage-ment and healthcare costs. The model has been applied to a real-world-like situation, inspired by a geriatric department of a hospi-tal in London, UK.Future research may lie in:
The use of an extended queuing system of M/PH/c/N type, allowing a fixed N >c maximum capacity, which avoids the straight patient rejection when all beds are occupied. Such a system allows the existence of a (N–c) waiting room.
The setup of the corresponding cost model.
The evolutionary-based optimization of the extended model.
Acknowledgments
This work was supported by the strategic Grant POSDRU/159/ 1.5/S/133255, Project ID 133255 (2014), co-financed by the Euro-pean Social Fund within the Sectorial Operational Program Human Resources Development 2007–2013.
References
[1]Gillespie J, McClean S, Scotney B, et al. Costing hospital resources for stroke patients using phase-type models. Health Care Manage Sci 2011;14(3):279–91.
[2]Garg L, McClean S, Meenan B, Millard P. A non-homogeneous discrete time Markov model for admission scheduling and resource planning in a cost or capacity constrained healthcare system. Health Care Manage Sci 2010;13(2):155–69.
[3] Gong Y-j, Zhang J, Fan Z. A multi-objective comprehensive learning particle swarm optimization with a binary search-based representation scheme for bed allocation problem in general hospital. In: Proc IEEE international conference on systems, man and cybernetics, Istanbul, Turkey; 10–13 October 2010. p. 1083–88.
[4]Lee D, Zenios S. Optimal capacity overbooking for the regular treatment of chronic conditions. Oper Res 2009;57:852–65.
[5]Gorunescu F, McClean SI, Millard PH. A queueing model for bed-occupancy management and planning of hospitals. J Oper Res Soc 2002;53(1):19–24. [6]Gorunescu F, McClean SI, Millard PH. Using a queuing model to help plan bed
allocation in a department of geriatric medicine. Health Care Manage Sci 2002;5:307–12.
[7]Li X, Beullens P, Jones D, Tamiz M. An integrated queuing and multi-objective bed allocation model with application to a hospital in China. J Oper Res Soc 2009;60:330–8.
[8]Cochran J, Roche K. A multi-class queuing network analysis methodology for improving hospital emergency department performance. Comput Oper Res 2009;36(5):1497–512.
[9]Bruin AM, Bekker R, Zanten L, Koole GM. Dimensioning hospital wards using the Erlang loss model. Ann Oper Res 2010;178:23–43.
[10] Harrison GW, Millard PH. Balancing acute and long-term care; the mathematics of throughput in departments of geriatric medicine. Methods Inf Med 1991;30:221–8.
[11]McClean SI, Millard PH. Patterns of length of stay after admission in geriatric medicine; an event history approach. Statistician 1993;42:263–74. [12]Taylor G, McClean S, Millard PH. Continuous-time Markov models for geriatric
patient behaviour. Appl Stochastic Models Data Anal 1998;13:315–23. [13]Marshall AH, McClean SI, Shapcott CM. Developing a Bayesian belief network
for the management of geriatric hospital care. Health Care Manage Sci 2001;4:23–30.
[14]Faddy MJ, McClean SI. Using a multi-state model to enhance understanding of geriatric patient care. Aust Health Rev 2007;31:91–7.
[15]Faddy M. Examples of fitting structured phase-type distributions. Appl Stoch Models Data Anal 1994;10:247–55.
[16]Cooper R. Introduction to queueing theory. 2nd ed. New York: Elsevier North-Holland; 1981.
[17]Ross S. Introduction to probability theory. 6th ed. Academic Press; 1997. [18]Stevenson W. Operations management. 10th ed. McGraw-Hill Higher
Education; 2009.
[19]Millard PH, Rae B, Busby W. Why nosokinetics? Measuring and modelling the process. In: McClean S, Millard P, El-Darzi E, Nugent C, editors. Intelligent patient management (studies in computational intelligence 189), Part I: intelligent patient management. Springer; 2009. p. 3–23.
[20] Taylor G, McClean S, Millard P. Geriatric patient flow-rate modelling. IMA J Math Appl Med Biol 1996;13:297–307.
[21]Taylor G, McClean S, Millard P. Stochastic models of geriatric patient bed occupancy behaviour. JRSS Ser A 2000;163:39–48.
[22]Eiben AE, Smith JE. Introduction to evolutionary computing. Berlin, Heidelberg: Springer-Verlag; 2003.
[23] Gorunescu F. Data mining, concepts, models and techniques. Berlin, Heidelberg: Springer-Verlag; 2011/2013.
[24] Vinicchayakul R. Costing care in geriatric medicine. MSc dissertation. University of London; 2000.
[25] Hospital statistics, 1976, 1981, 1991–2010 editions. Chicago, IL. (Copyrights 1976, 1981, 1991–2010). <http://www.cdc.gov/nchs/data/hus/2010/104.pdf>, <http://www.cdc.gov/nchs/data/hus/2010/113.pdf>.
[26]Vasilakis C, Marshall AH. Modelling nationwide hospital length of stay: opening the black box. J Oper Res Soc 2005;56:862–9.
[27] Vasilakis C, El-Darzi E, Chountas P. A decision support system for measuring the multi-phase nature of patient flow in hospitals (studies in computational intelligence 109). In: McClean S, Millard P, Nugent C, editors. Intelligent techniques and tools for novel system architectures.
[28]Koizumi N, Kuno E, Smith T. A queuing network model with blocking: analysis of congested patient flows in mental health systems. Health Care Manage Sci 2005;8:49–60.
[29] Henry J. Kaiser family foundation, state health facts. <http://kff.org/other/ state-indicator/expenses-per-inpatient-day/>.
[30] National Health Service (NHS) Institute for Innovation and Improvement. <http://www.institute.nhs.uk/>.
[31]Horrocks P. The components of a comprehensive district health service for elderly people: a personal view. Age Ageing 1986;15:321–42.
[32]Silver EA, Smith SA. A graphical aid for determining optimal inventories in a unit inventory replenishment system. Mngt Sci 1977;24:358–9.
[33]McClean S, Millard P, El-Darzi E, Nugent C, editors. Intelligent patient management (studies in computational intelligence 189). Springer; 2009. [34]Currie C, Lu L. Optimal scheduling using length-of-stay data for diverse routine
procedures. In: McClean S, Millard P, El-Darzi E, Nugent C, editors. Intelligent patient management (studies in computational intelligence 189), Part III: intelligent clinical support. Springer; 2009. p. 193–205.
[35]Stoean C, Stoean R. Support vector machines and evolutionary algorithms for classification. Berlin, Heidelberg: Springer-Verlag; 2014.