Permission to make digital or hard copies of all or part of this work for personal or classroom use is granted without fee provided that copies are not made or distributed for profit or commercial advantage and that copies bear this notice and the full citation on the first page. To copy otherwise, or republish, to post on servers or to redistribute to lists, requires prior specific permission and/or a fee.
WOSP’08, June 24—26, 2008, Princeton, New Jersey, USA. Copyright 2008 ACM 978-1-59593-873-2/08/06...$5.00.
Controlled Dynamic Performance Analysis
Steven P. Reiss
Department of Computer Science
Brown University
Providence, RI. 02912
[email protected]
ABSTRACT
We are interested in obtaining detailed performance information on-the-fly from long-running systems without adversely affecting the performance of the systems. We have developed a methodology consisting of a framework, DYPER, and a number of specialized agents called proflets each of which analyzes a different performance aspect. DYPER gathers performance information with a guaranteed maximum overhead that is dynamically settable by the programmer using priorities set by the proflets. Moreover, the type of information that the system can provide is generally only available for tools that generally have too much overhead to be usable in production or long-running systems. DYPER includes the ability to control and display performance data as the program is run.
Categories and Subject Descriptors
B.8.2 [Performance and Reliability]: Performance Analysis and Design Aids.
General Terms
Performance, Measurement.Keywords
Performance analysis, profiling, statistical analysis, instrumentation.
1. INTRODUCTION
Programmers often want to know about the dynamic behavior of their program. They want to know about performance anomalies and how they can eliminate them. They want to know where the program is spending its time or what it is allocating or why they are not getting expected performance out of multiple threads. They want to know the how long it takes to respond to an event. They want to know about potential bottlenecks and memory leaks.
While a large number of tools have been developed to address these issues [51], most of these tools do not address modern
software systems. Today’s systems are typically much more complex than previous ones and thus much harder to understand. They typically involve multiple threads that can interact in non-obvious ways. They typically involve significantly more code, often millions of lines of source when libraries are considered. Moreover, they are often long running systems, often even servers that are designed to run continuously and forever.
Traditional profiling tools are inadequate. They typically involve slowing the program down significantly, often by 25%-100% or more, in order to get the necessary information.They often provide only postmortem analysis which is not that helpful when one needs to consider a program that never terminates or when one is interested in a particular time slice of the execution rather than the overall execution. They are also generally limited in domain, concentrating on one aspect of performance or another, and not attempting to address all aspects simultaneously.
Our goal has been to provide a performance analysis tool that will work with modern software systems. This led to several requirements:
• The tool must offer a guarantee on overhead. The tool should let the programmer decide what the allowable overhead for performance monitoring should be, be it 10%, 1%, or even 0.1%, and the tool should ensure that it works within the given bound.
• The tool should provide on-the-fly analysis. The programmer needs to know what the program is doing now. • The tool should give the programmer control of the
performance analysis, allowing it to be reset and turned on and off either by programmer control or automatically based on conditions in the program.
• The tool should consider multiple domains of performance analysis, addressing cpu usage, memory, thread behavior, etc. Moreover, new analyses, even ones specific to a particular application, should be easy to incorporate. • The tool should be flexible enough to be used to identify
transient performance issues.
• The tool should deal with multiple threads and multiple processes.
• The tool should be applicable to a wide range of applications.
• The tool should have a flexible interface that provides the programmer with an overview of what is happening, details where they are important, as well as control of the analysis. In this paper we describe the DYPER framework we have created to meet these requirements. The framework treats
performance analysis as a resource allocation problem, doing the necessary instrumentation at and for intervals that are dependent on the estimated priorities of the different analyses, on the allowable overhead, and on the costs associated with the analysis. The framework provides multiple performance analysis agents we call proflets, handles multiple processes, and offers a web-based front end that gives the programmer control over the performance analysis tasks as well as on-line feedback on what is currently happening.
The next section goes over some of the related work and similar systems. Section 3 then describes the overall architecture of DYPER. Section 4 then describes the dynamic control of the instrumentation based on resources. The subsequent section describes the current set of proflets. Section 6 describes the user interface. Finally, we conclude with a discussion of the tools effectiveness and our proposed future work.
2. RELATED WORK
Performance analysis or profiling has been around for a long time. Perhaps the best known tools are UNIX prof and gprof [20]. These use system facilities to sample the program counter periodically (originally every 60th of a second, more recently every 100th or 1000th of a second) to identify what routine is currently executing and instrument the start of every function to get execution counts of either that function (prof) or of that function and its caller (gprof). This approach, combining statistical sampling with some instrumentation is the basis of most of the performance analysis tools that have been produced.
Prof and gprof are not perfect. They required separate compilation to do the instrumenting and had a significant overhead that was generally greater than 25%. Moreover, they only provided information about cpu utilization at the function level, provide only postmortem information, and did not deal nicely with multiple threads. Most newer tools, ours included, are aimed at dealing with these deficiencies.
Dealing with separate compilation involved developing tools that instrument the binary file directly. Pixie did instrumentation at the basic block level on binary files [53]. Tools such as EEL [26]provide a general framework that was used for developing profiling tools [4]. Today there are a variety of instrumentation tools such as BCEL [16] and JikesBT [25] which we use for Java as well as Vulcan for .Net [52]. JRat provides an instrumentation framework for Java geared more toward profiling [50]. Alternative approaches is to use aspect-oriented programming tools such as Aspect/J to do the instrumentation [40], or provide a user-level instrumentation language [48].
Dealing with the overhead has been more difficult. Sampling is relatively inexpensive because it occurs relatively infrequently and can provide a lot of information [1,27]. However, some of the information a programmer wants for performance analysis cannot be obtained in this way. For example, it is very difficult to get counts, even approximate counts, of the number of times a routine is called since sampling cannot distinguish one long call from many smaller ones. However, sampling-only tools have been used effectively for special purpose applications such as providing the input needed to an optimizing compiler [59]. Our tools use samples to get as much of their information as possible, and then, like the compilation tools, use this data to help dynamically determine performance issues and
priorities.Our current overhead measurements concentrate on CPU time, but a broader interpretation considering other resources such as that of ROCC is possible [58].
An alternative approach, used by JFluid [17] is to do selective instrumentation of known performance bottlenecks, concentrating on cpu usage through dynamic call graphs. JFluid has the ability to dynamically instrument and uninstrument code so as to obtain statistical information about performance with a relatively small overhead (1% to 2000% depending on the application and the percentage of time the program was instrumented). Our approach makes use of similar techniques to achieve much of its performance. InsECTJ provides an alternative framework, letting the user create run time information that is then made available through Eclipse [49].
Another approach is to do efficient instrumentation and to cut down the amount of data that is collected. Techniques such as path profiling [5], selectively instrumenting libraries [35], and restricting the raw data by doing some initial analysis can all reduce the profiling overhead. Using additional available processors, something that is becoming more common today with multicore architectures, is another approach [2]. Our previous work on visualizing dynamic program behavior made use of some of these techniques [44,45]. Another approach here is that of Vetter and Reed where a variety of performance metrics are gathered initially and then statistical techniques are used to limit instrumentation to those metrics that will be of interest [56].
Another approach is illustrated by DTrace, Sun’s dynamic tracing facility [12]. This uses a combination of hooks and buffers inside the operating system, user-controlled instrumentation that can be enabled and disabled dynamically, interactive displays, and programmable instrumentation facilities to facilitate instrumenting production systems. DTrace is notable both for its flexibility and for the many modules that incorporate it in Solaris. For example, there are DTrace hooks for most of the facilities of JVMTI available in Java 6 [31]. While we share many of the goals of DTrace and we could build our system in part on top of its facilities, we go beyond this by providing automatic control of the instrumentation, the ability to trace across the Internet, specialized agents, and Internet-based displays.
CA Wily’s Introscope uses agents that monitor interactions among web processes to identify bottlenecks and other performance problems in web applications with very low overhead [54]. It can identify problems at a high level, but not delve into the internals of any component. KOJAK is another monitoring tool, this time specialized toward parallel programs using hardware performance counter support within MPI [60]. Dealing with on-the-fly statistics involves developing tools that can dynamically control and monitor the profiling. This was done with gprof in FIELD [42] and in Sun Microsystems programming tools
[32].
More sophisticated techniques such as allowing dynamic triggering of trace collection based on program events has also been tried, for example in JinSight [39].Prof and gprof relied on UNIX facilities to interrupt the program for profiling purposes at given intervals. Modern platforms such as Java now offer a variety of facilities as a basis for profiling. For example, Java offers the JVMTI tool interface [30] which superseded the original JVMPI profiling interfaces [57]. JVMTI provides facilities for access stacks,
monitor thread states, analyzing the heap, looking at garbage collection, monitoring locks, and trapping method entry and exit. It is the basis of most current profiling tools such as TPTP in Eclipse [18] and the OpenJDK package JConsole [14]. However, when used extensively, JVMTI can introduce significant overhead to an application, mainly due to Java treating the JVMTI callbacks as native code. It is also non-selective; you can trap all method calls, but trapping only selected calls or allocations requires using debugging facilities such as the setting and handling of breakpoints.
More recently, in Java 5, Sun introduced the Java monitoring and management interfaces [15]. This interface provides is more efficient, utilizing native Java hooks into the virtual machine and offers some of the capabilities of the JVMTI with much less overhead. Its facilities include the ability to sample stacks, to monitor threads, to look at memory usage and garbage collection, and to get timings for execution and blocking. Our tool makes use of this both JVMTI and the management interfaces, using the former for information not available from the latter such as a detailed analysis of the heap, and using the management interface to minimize overhead. Both JVMTI and the management interface also provide the ability to dynamically instrument and modify Java binary files, a feature used earlier in tools such as CC4J [24] and which our tool uses as well.
Performance analysis tools offer a variety of different analyses. Memory analysis has been available separately in profiling tools for some time [28,43,61]. The extensible Java profiler [55] also offers a programmatic interface for controlling profiling, but is geared more to obtaining precise execution time information. Jinsight provides a variety of different analyses through a visual framework, relying on trace data collection and analysis [36-38]. J-SEAL2 uses performance instrumentation to ensure that processes or threads don’t overuse system resources, using byte code instrumentation to monitor memory and CPU utilization [7-9]. The Komorium system uses instrumentation to count byte codes executed as an alternative to time-based sampling [10] in order to provide more reproducible results from profiling. The system also is capable of dynamically tuning the sampling rate to trade-off accuracy and overhead. Our tools in part use similar tuning techniques to achieve a fixed overhead.
Another approach is adaptive statistical sampling from Microsoft [13]. This approach builds on a tracing infrastructure that instruments the code so that there is a profiled version and an unprofiled version and the program can switch between them on the fly [21]. Adaptive sampling traces code at rates that are inversely proportional to their frequency. This is useful for using sampling for detecting programming problems where coverage is important but more detailed sampling of hot points is not. However, the approach does yield useful information with small overhead, reportedly about 5%. We use a similar approach but with very different tracing technology to accommodate production systems and using adaptation to investigate different problems and to other relevant statistics.
The effort that is closest to our work is Paradyn from U. Wisconsin and its extensions [33]. Paradyn, while specialized for scientific applications, includes many of the features that we require in a performance architecture. It provides on-the-fly analysis that can be controlled by the programmer; it provides information for multiple aspects of program performances,
including CPU, locking, and I/O; it offers multiple interfaces including useful visualizations; and it allows the programmer to limit the overhead.
One interesting aspect of Paradyn is that it uses an intelligent approach to adding instrumentation, looking for routines that use significant CPU time and then recursively instrumenting the routines they call. This minimizes the amount of instrumentation while providing accurate results [6,11]. Crosswalk extends this approach to work being done in the kernel [34]. These ideas have been integrated into various tools. STAT analyzes stack traces from large numbers of processes to build a statistical model of what the processes are doing and then cluster these according to their behavior, thereby reducing the problem space for performance debugging [3]. Paradyn uses the callgraph-based search to detect CPU-based bottlenecks with independent bottleneck search agents that are part of the monitor [47]. These agents can make use of historical performance data from previous runs [23]
The approach we are taking, while similar in many respects to that of Paradyn, differs in that we have a broader target domain of applications, that we are attempting to make it easier to add new proflets to handle different types of performance including being able to do application-specific performance analysis and analysis of transient problems, and in our approach to controlling the overhead. Paradyn doesn’t vary the sampling rate and maintains an ordered queue of instrumentation tasks and just ignores tasks that would exceed the overhead limit, eventually getting to them if other tasks find no problems and are thus eliminated [22]. A later extension uses the same approach locally, but incorporates a more sophisticated scheduler to resolve global and local conflicts in distributed performance analysis [46]. Our approach lets agents set relative priorities and then computes a schedule for instrumentation based on those priorities and the overhead. It does not discard or ignore requests, but instead either delays them or uses their priority to delay other requests.
3. DYPER ARCHITECTURE
Our goal is to create a flexible performance analysis environment that provides a variety of types of information within a fixed overhead. To achieve this we use adaptive techniques and dynamic control of that adaptation.
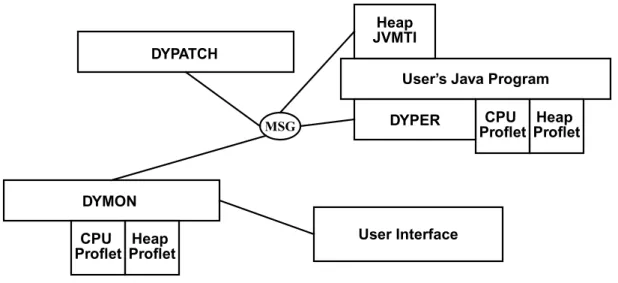
The basic idea behind the architecture is that we want to use sampling techniques to get a coarse view of performance, and then to use dynamic instrumentation to get finer levels of detail. In order to guarantee a fixed overhead, we vary the time between samples and do detailed instrumentation only for relatively short periods of time. For example, if we want to estimate the number times a routine is called over the run, we would create a patched version of the class containing the routine that counted entries, swap this instrumented version in for ten seconds, and then project the counts we obtained to the overall run. By changing the sampling interval and the frequency and duration of the instrumentation appropriately, we can provide guaranteed limits on the overhead while offering statistically significant performance information. The framework we use consists of four separate components connected using a messaging framework (MSG) based on that of FIELD [41]. The framework allows arbitrary performance-specific agents we call proflets to be attached to the
components. This is illustrated in Figure 1 for the case where there are only two proflets.
The main control is handled by the monitoring component DYMON. Its jobs is to control the instrumentation, to coordinate performance monitoring proflets, and to communicate with the user interface as necessary. DYMON is in charge of coordinating proflets and the user interface and of managing the various timings involved in limiting the overhead.
The DYPATCH component handles byte code instrumentation, providing a facility that makes it easy for proflets to specify what to patch and how.
The DYPER component consists of a Java Management proflet that is dynamically attached to the user process. This component handles communication with DYMON and sets up a monitoring thread inside the process. At whatever intervals DYMON determines, this component gets a snapshot of the stacks of all active threads and passes this to each of the proflets to do appropriate processing. When requested, it creates a report containing sampling information as well as data from each of the proflets. It also provides the facilities used by DYMON and DYPATCH to insert and remove dynamic instrumentation.
The system supports multiple performance analysis proflets. Each proflet consists of a class inside DYMON that is in charge of processing and analyzing the appropriate data. Proflets can also include an object that is dynamically loaded into the user process and attached to DYPER. This object will be called to accumulate data while sampling by DYPER and to report that data to DYMON when requested. It can also provide entry points that can be called from dynamically instrumented code. When needed, a performance analysis proflet can also include a JVMTI agent.
Finally, the system supports multiple user interfaces that can connect directly to DYMON. We currently are using a dynamic Web-based interface that does dynamic updating and a Swing-based interface that emphasizes minimizing display space.
4. DYNAMIC CONTROL
The DYMON monitor is charged with ensuring that the overhead of performance analysis is within whatever bounds the user sets. It does this by allocating time appropriately to DYPER for stack monitoring and reporting, and to each of the DYPER proflets for detailed analysis.
In order to determine how to allocate time, DYMON needs information about the costs involved. As DYPER does stack monitoring and reporting, it determines the total time that it and the various proflets take to do stack monitoring and the total time needed for reporting. These times are reported to DYMON. Each proflet, p, provides DYMON with four pieces of information:
• OVHD(p): The fixed overhead (in milliseconds) associated with its detailed analysis.
• SLOW(p): The factor by which the application is slowed when the proflet is doing detailed analysis.
• ITVL(p): The length of time (in milliseconds) that detailed analysis should be done.
• PRTY(p): A priority that indicates the importance of doing detailed analysis based on the type of analysis and what the application is doing. This is a value between zero and one, with zero indicating that the proflet needs no detailing and one indicating the highest priority.
From these values for each proflet, DYMON computes:
and
Here COST(p) represents the estimated cost of doing a detailed analysis using this proflet. This is a function of the
CPU
Proflet
DYPATCH
User’s Java Program
DYPER
Heap
JVMTI
User Interface
Figure 1. The DYPER Architecture.
DYMON
Heap
Proflet
CPU
Proflet
Heap
Proflet
MSGCOST p( ) OVHD p( ) SLOW p( ) 1+SLOW p( )
---ITVL p( )) +
=
fixed overhead and the slowdown over the interval when detailing will be done.
The second value, TPRI(p), is more complex. It is meant to represent a time-biased priority for the proflet. This is an attempt to handle proflets that have widely divergent overheads. For example, doing a detailed memory profile has a slowdown of which is about three orders of magnitude larger than the overhead associated with computing thread timings. DYMON works by assuming it has a given fraction of the programs clock time to allocate to performance analysis. This fraction is set by the user based on the amount of overhead to allow. It then dynamically determines what fraction of this overhead should be allocated to stack monitoring, reporting, and to detailing for each proflet.
DYMON first apportions the time for stack monitoring and reporting. It starts by determining the average priority, P, of all active proflets. It then determines the fraction of time to allocate to stack monitoring and reporting using:
This function yields 1.0 (100%) when the average priority is zero, 0.5 (50%) when the average priority if one-half, and 0.25 (25%) when the average priority is one. This fraction is further broken up to provide 10% of the time to reporting results and the remaining 90% of the time to stack monitoring. DYMON next takes this fraction of the time along with the costs of stack monitoring and of reporting as returned from DYPER and determines the frequency with which each should be done in order to stay within this bound. Finally, it makes sure that the resultant values are reasonable, assuming a minimum delay for stack monitoring and that reporting should be less frequent than monitoring, and sends the computed timings to DYPER. DYPER uses these values to set a time-based delay between stack monitorings and to check if it should, after a monitoring report the result. In order to avoid having the time delays synchronize with the application, it actually delays for a gaussian random value whose mean is the value given by DYMON.
Next DYMON allocates the remaining time to the various proflets. It does this using the time-biased priorities given by the proflets, providing each proflet with a share which is in proportion to its TPRI value versus the total of the TPRI values. Then, given that the proflet is allowed to use this amount of time, DYMON computes how often it should do detailing. This computation takes into account the fixed overhead of the proflet, that is the cost to set up detailing, and the slowdown factor times the amount of time that detailing will occur which provides the dynamic overhead. This value is translated into a delay that is then used to schedule detailing for the proflet at an appropriate time.
This allocation of proflet detailing time is where the exact form of the TPRI function becomes important. If the TPRI function were equal to PRTY, then each proflet would be given a fraction of time based solely on its priority. For proflets that had significant overhead, this would mean that detailing for that proflet would rarely be done. On the other hand, if TPRI were the simple product of PRTY and COST, then the scheduler would be “fair”, in that two proflets with the same priority would run with the same frequency. This however,
causes proflets with large overheads to significantly reduce the frequency of detailing for all proflets. The function we chose, using the square root of COST, is meant to be a compromise between these two extremes, providing relatively fair access to all proflets without having any one hinder the others. This choice was based on our experiences in using the system and seems to work quite well.
Finally, DYMON provides a queueing service for proflet detailing that ensures that proflets don’t interfere with one another and that proflets can take into account their own overhead to adjust their results if they need to. This service allows each proflet to specify whether which if any other proflets can do detailing at the same time as this proflet. It also ensures that proflets that need to patch class files to do detailing do not have conflicting patches. This flexibility is useful because some proflets, such as timing, have very little effect on others, while others, such as basic block counting can affect the behavior of other proflets.
Given all this, the cost of performance analysis should fall inside the limits specified by the user. Because much of the analysis (e.g. the stack monitoring and reporting) is done in a separate thread, the analysis is almost free if there are available processors on the target architecture, but the above analysis is not that optimistic. The analysis can be wrong if the proflets provide bad estimates of their overhead or if suddenly stack analysis takes significantly longer than it used to, but generally it should be within the proper limits.
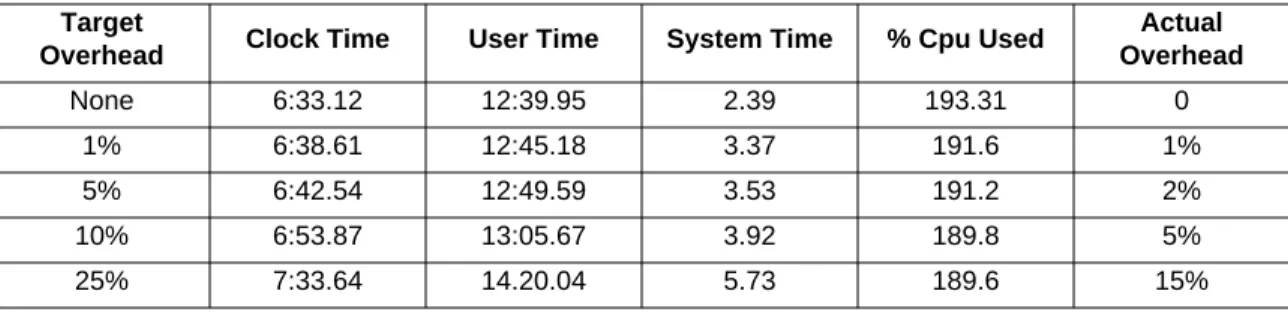
This can be seen in Figure 2 that shows the results of running an application with different overhead settings. The application in this case was a multiple particle gravity simulation with 10,000 objects that ran for a fixed amount of simulated time and provided 3D graphical output. It used most of the two processors that were available on the machine in doing so that performance analysis should not be free. Each of the values represents the average of ten runs. We note that even with ten runs, these results are still approximate, with the standard deviation being about 5 seconds. The results for 5, 10, and 25 percent overhead show that the actual overhead grows appropriately and is well within the specified limits. The result for 1% overhead is again proportional, but is proportionally slightly higher. Some of the variance here is due to the pessimistic assumptions made in computing the overhead and slowdown for proflet detailing, and noting that such detailing occurs more often with higher overhead.
The fact that the overhead used can be significantly less than the overhead allowed provides our system with additional opportunities. Currently, we do not make use of the available overhead, instead preferring to run the underlying application as fast as possible. Ideally, one would like to adjust the various parameters dynamically to get better statistics within the user’s limits. While this seems possible, we note that the system would have to estimate the various overheads and many of the costs of instrumentation (for example JITing the modified code) can be quite variable and are out of our control. This is a good candidate for future work.
5. PROFLETS
Our framework uses proflets to provide a flexible means for incorporating different analyses. Each proflet is in charge of collecting the appropriate high-level data based on stack samplings, collecting more detailed data if appropriate, determining the priority for that detailed data, and specifying FRACT P( ) 1 2 ---P2 5 4 ---P – +1 =
the overhead and duration of any detailed analysis. In addition each proflet is required to output is results in an XML format for the user interface.
We currently provide six different proflets, one for looking at where execution occurs, one for analyzing the heap, one for I/O behavior, one for thread behavior, one for looking at allocations, and one for timings.
5.1 CPU Proflet
The CPU proflet is responsible for determining where the program is executing. It provides information both about what percentage of CPU time is spent in each routine and at each line of the code and how many times each line is executed. Because it is statistical in nature, it restricts itself to routines and lines that are used more that 0.5% of the time.
The basic analysis is done via stack sampling as in prof or
gprof
. This record the number of times that when a stack sample was taken a particular routine or line was being executed. This information is translated into the percentage of CPU utilized by that line. The proflet tracks both what is currently executing and the locations of calls to that routine. Moreover, it can be set to attribute costs associated with system libraries to the location that called that library. Detailed analysis is needed to determine how many times a give line or routine is executed. This is done by determining which routines are candidates for such analysis using the basic analysis and then instrumenting just these routines by inserting counters at the start of each routine and each basic block. The instrumented routines are then run for some period of time (currently 15 seconds), and the results extrapolated to the overall execution. As this detailing occurs multiple times over a run, the results become more statistically significant. The CPU proflet determines the priority for doing detailing by looking both at the number of candidate routines and at how cpu-bound the application is.We note that the analysis done here could be extended to include gprof-like call information using techniques proposed in [19].
5.2 I/O Proflet
The I/O proflet provides information about how much time the application spends doing I/O, broken down by thread and by what application routine is invoking the input or output operation.
The basic analysis for I/O is done by looking at the stack samples. The I/O proflet starts by knowing which methods in the Java system libraries correspond to I/O operations. This information is defined in a resource file that is passed from DYMON and can be adapted to each particular application. When it finds that a thread is executing in one of these routines, it tracks that routine and the application routine that called it. The counts here provide the statistical data needed to allocation I/O percentages.
The proflet does detailed analysis by instrumenting those I/O routines that are used most frequently and getting counts of the number of times these are invoked during the detailing interval. The priority for such detailing is dependent on the amount of I/O that is detected as well as the number of different I/O routines.
5.3 Memory Proflet
The memory proflet determines how many objects of each type are allocated as well as the total amount of memory used and the number of garbage collections.
The basic analysis uses the Java management facilities to get information about memory utilization and garbage collection each time the stacks are sampled.
Detailed analysis is done by instrumenting the constructor of the base class java.lang.Object with a routine that gets the actual class of the allocated object and counts the number of instances. This approach is more efficient than using JVMTI to trap allocations, but has the disadvantage that we do not get to count allocations of arrays. The detailing is done for ten second intervals and the results are extrapolated to the overall run.
The priority of doing detailing here is determined by looking at how the number of garbage collections and the size of memory change over the last fifty reports, figuring that the more these change the more likely we are to need to understand memory behavior.
This proflet provides two detailing modes, one which just looks at the class of the allocated object and one that looks at the stack at the point of allocation to determine the line in the user’s code that causes the allocation. The latter mode has significantly greater overhead than the former. However, both modes are accommodated having the scheduler treat them as separate proflets and thus schedule both. Because the source mode has a significant overhead, the scheduler causes it to be run less frequently.
Target
Overhead Clock Time User Time System Time % Cpu Used
Actual Overhead None 6:33.12 12:39.95 2.39 193.31 0 1% 6:38.61 12:45.18 3.37 191.6 1% 5% 6:42.54 12:49.59 3.53 191.2 2% 10% 6:53.87 13:05.67 3.92 189.8 5% 25% 7:33.64 14.20.04 5.73 189.6 15%
5.4 Heap Proflet
The heap proflet tracks the current contents of the heap, identifying the number and size of objects of each allocated type.
This proflet is different in that it is implemented as a JVMTI plugin rather than as a class that interacts with the DYPER monitor. The proflet does no basic analysis. When it gets a chance to do detailed analysis, it sends a message to the JVMTI proflet. The proflet then uses the JVMTI facilities to scan the heap and count the number and size of the objects there based on their type. This information is reported back and tracked in the DYMON heap proflet.
The difficulty with this proflet is that execution effectively stops when the heap is scanned and the scanning time depends on the number of objects on the heap. To account for the overhead appropriately, the JVMTI agent tracks the amount of time each heap scan takes and returns the worst case time to the heap proflet. This time plus some delta is then used as the approximate overhead involved with the detailed analysis.
5.5 Thread Proflet
The thread proflet determines what threads are blocking on other threads, estimating counts of who is blocking whom. It also tracks the amount of time each thread spends running, blocking, waiting, sleeping, or doing input or output, providing a profile of thread behavior.
The basic analysis looks at each thread and determines its state. Most of this information is available directly, but the information returned by Java is incomplete. We determine if a thread is doing I/O by checking if it is running in an I/O related method or if it is blocked in a windows-related method. We determine if the thread is sleeping by seeing if it is inside a call to Thread.sleep. In addition, if the thread is blocked, we use the information provided by Java to determine which thread is blocking it.
Counting the number of times each thread is in each state when we sample the stacks provides an approximation to the amount of time the threads are actually in that state. The proflet uses detailing to get more accurate information by turning on contention monitoring to force the JVM to compute the amount of time each thread spends waiting and blocking. This incurs a small overhead (which we account for), but can provide more accurate results.
5.6 Timing Proflet
The timing proflet provides information about the actual CPU time spent by a thread as well as general information about the number of active threads.
The basic analysis records the number of active threads in each stack sample. It computes the average number and the standard deviation of these values as well as the number of available processors.
The detailed analysis enables the JVM feature that computes per-thread CPU time. Again, using this incurs some overhead. The proflet then looks at the actual CPU time spent during the detailing interval and extrapolates the actual time used from there.
This information is designed to complement the timings accumulated by the thread proflet. In particular, if there are more threads available to run than processors available to run
them, the thread proflet will show that the threads were running, but the timing proflet will show that they were effectively blocked.
6. DYPER USER INTERFACE
The DYMON monitor provides an application interface based on XML over a socket. It is designed so that one or more front end applications can attach to the monitor, control the monitoring process, and obtain the information they need to display information to the user.
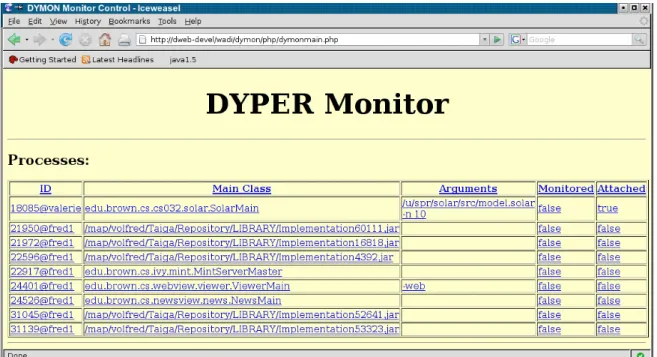
Our initial user interface implementation uses a web-based front end implemented using FlapJAX [29] for dynamic web update based on XML, Javascript for handling user commands, and PHP to interface between DYMON and the web server. The basic interface, shown if Figure 3, shows the user the current set of processes that can or are being monitored. The interface lets the user control whether a process is attached to DYMON (i.e. has the DYPER libraries installed) and whether it is currently being monitored or not.
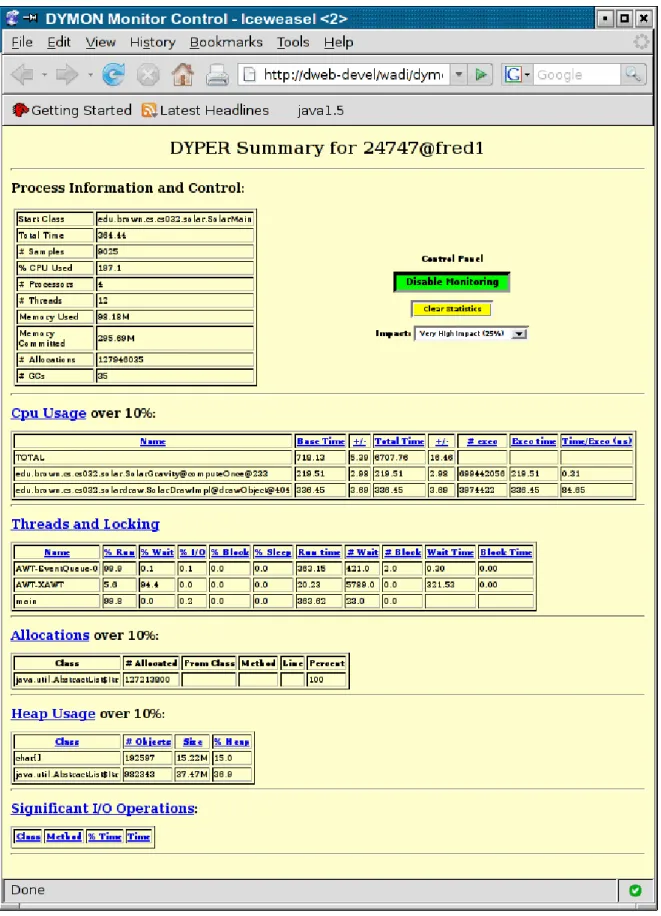
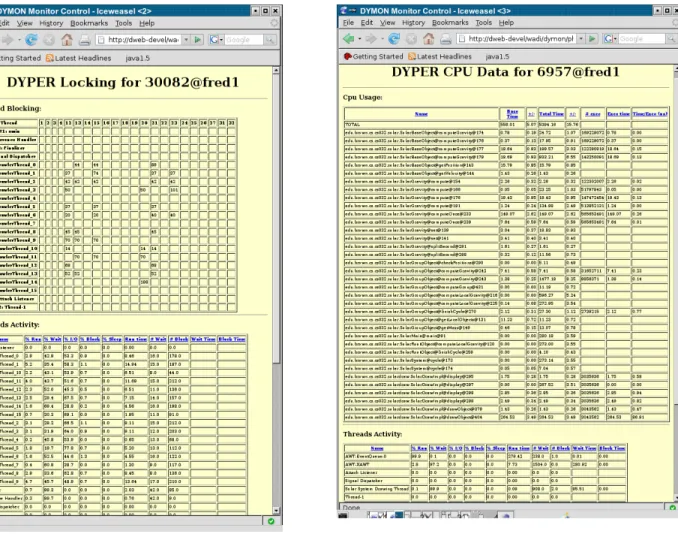
Clicking on the process itself brings up a summary window that shows detailed information about the process, lets the user control monitoring, and displays performance information that is noteworthy. A view of this can be seen in Figure 4. Clicking on any of the headers in this view provides a detailed view of all the relevant information concerning that aspect of performance. For example, Figure 5 shows detailed views of thread and cpu statistics.
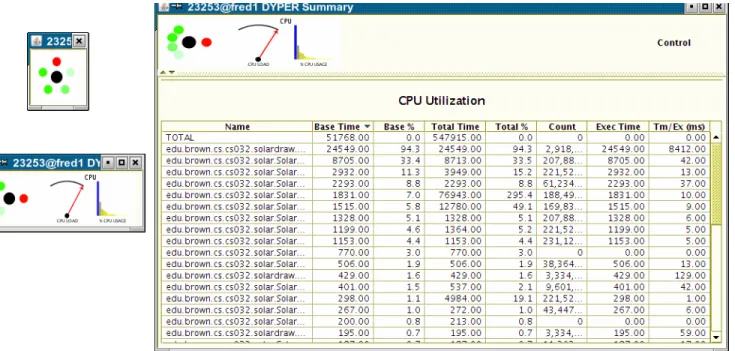
The second interface we developed is shown in Figure 6. The view at the upper left shows the status of the different proflets, with hue encoding whether the proflet thinks there might be a problem and brightness encoding the confidence the proflet has in that assessment. This view is quite compact so that it is unobtrusive and so that significant numbers of such visualizations can be effectively displayed at one time. Clicking on the red dot for CPU time in the first view brings up the second view, shown below the first, which shows summary information from the CPU proflet. Tool tips are used in this view to provide additional details on the meter and the bar graph. Finally, clicking again brings up the third view which shows the detailed performance information. All views are continually updated as the process runs.
7. EXPERIENCE
We have used DYPER to analyze the performance of several of our longer-running systems. In addition to the multiple particle gravity simulation described earlier, these include a set of experiments where we use different learning techniques to learn the coding style of a corpus of code, a peer-to-peer application that supports distributed programming and that is running on fifty different nodes at Brown, a 3D pinball program, and a web crawler.
The system provides reasonably accurate statistics that match our prior knowledge of what each of these programs are doing. In particular, it was able to rapidly highlight a previous known performance bottleneck in the web crawler related to accessing robots.txt, a problem that had taken us several weeks to track down with standard tools. Moreover, the statistics seem to be stable, not changing significantly from one detailing to another, an indicator that the values returned by the detailings are reasonably accurate.
For the most part, using the system does not seem to adversely affect the run time or behavior of the applications being monitored. Especially with the lower overhead settings, we did not notice any appreciable slowdown in any of the applications. The major problem here is a bug in Java that causes a monitored program to randomly abort, generally after being monitored for an extended length of time. While we are attempting to track this problem down, we have been hesitant to publicize the system outside Brown because of it.
The other problem that we observed in running the system is that it often takes several minutes of running the profiled system before one has meaningful statistics. Originally, this was especially true for proflets that had high overhead since they were not run often. This is what led us to define the time-based priority function and use it for scheduling. The current system still takes several minutes, but typically reports the more relevant statistics, the ones that are assigned higher priority, within a minute or two.
8. RESULTS AND FUTURE WORK
DYPER provides a powerful framework for analyzing and presenting performance data from long-running, production applications within fixed overhead bounds that are settable by the user. The framework is easily extensible both in terms of what is monitored and how it is presented. Moreover the data analysis can be customized per application.
It is relatively easy to add proflets to the framework, with most current proflets consisting of a total of 1000 lines of source generally split evenly between their DYPER library and the DYMON controller. We are looking at additional proflets to monitor use of Java collections classes, for handling events and callbacks, for detecting memory leaks, for tracking performance history rather than summaries, that make use of DTrace information, and for message processing.
It is also possible to write custom proflets for particular applications.This can be used both to analyze information specific to an application and to define proflets that automatically trigger detailed or high-frequency sampling when they detect an anomalous event. The framework is also designed to monitor multiple processes and proflets can work with the simultaneous data from these processes simultaneously. This should allow the creation of proflets to model generic and application-specific interprocess coordination.
The code for the framework is available as part of wadi at ftp://ftp.cs.brown.edu/u/spr/wadi.tar.gz.
9. ACKNOWLEDGEMENTS
This work is supported by the National Science Foundation through grant CCR0613162. Shriram Krishnamurthi and Jacob Baskin provided help with FlapJAX.
10. REFERENCES
1. Jennifer M. Anderson, Lance M. Berc, Jeffrey Dean, Sanjay Ghemawat, Monika R. Henzinger, Shun-Tak A. Leung, Richarc L. Sites, Mark T. Vandevoorde, Carl A.
Waldspurger, and William E. Weihl, “Continuous profiliing: where have all the cycles gone?,” ACM Trans. on Computer
Systems Vol. 15(4) pp. 357-390 (November 1997).
2. Ziya Aral and Ilya Gertner, “Non-intrusive and interactive profiling in Parasight,” Proc. ACM/SIGPLAN Conf. on
Parallel Programming, pp. 21-30 (January 1998).
3. Dorian C. Arnold, Dong H. Ahn, Bronis R. de Supinski, Gregory Lee, Barton P. Miller, and Martin Schulz, “Stack trace analysis for large scale debugging,” Proc. IPDPS 2007, pp. 1-10 (March 2007).
4. Thomas Ball and James R. Larus, “Optimally profiling and tracing programs,” 19th ACM Symp. on Principles of
Programming Languages, pp. 59-70 (January 1992).
5. Thomas Ball and James R. Larus, “Efficient path profiling,”
Proc 29th ACM/IEEE Symp. on Microarchitecture, pp. 46-57
(1996).
6. Andrew R. Bernat and Barton P. Miller, “Incremental call-path profiling,” Concurrency and Computation: Practice and
Experience Vol. 19(11) pp. 1533-1547 (August 2007).
7. Walter Binder, Jarle G. Hulaas, and Alex Villazon, “Portable resource control in Java: The J-SEAL2 Approach,” Proc.
OOPSLA 2001, pp. 139-155 (October 2001).
8. Walter Binder and Jarle Hulaas, “Java bytecode transformations for efficient portable CPU accounting,”
Electronic Notes in Theoretical Computer Science Vol. 141
pp. 53-73 (2005).
9. Walter Binder and Jarle Hulaas, “Using bytecode instruction counting as portable CPU consumption metric,” Electronic
Notes in Theoretical Computer Science Vol. 153 pp. 57-77
(2006).
10. Walter Binder, “Portable and accurate sampling profiling for Java,” Software Practice and Experience Vol. 36(6) pp. 615-650 (May 2006).
11. Harold W. Cain, Barton P. Miller, and Brian J. N. Wylie, “A callgraph-based search strategy for automated performance diagnosis,” Euro-Par 2000, (August 2000).
12. Bryan M. Cantrill, Michael W. Shapiro, and Adam H. Leventhal, “Dynamic instrumentation of production systems,” USENIX ’04, (June 2004).
13. Trishul M. Chilimbi and Matthias Hauswirth, “Low-overhead memory leak detection using adaptive statistical profiling,”
ASPLOS ’04, pp. 156-164 (October 2004).
14. Mandy Chung, “Using JConsole to monitor appliocations,”
Sun Microsystems,
http://java.sun.com/developer/techicalArticals/j2se/jconsole. html, (December 2004).
15. Grzegorz Czajkowski, Stephen Hahn, Glenn Skinner, Pete Soper, and Ciaran Bryce, “A resource management interface for the Java platform,” Sun Microsystems TR-2003-124, (May 2003).
16. Markus Dahm, “Byte code engineering,” Java Infromations
Tage ’99, pp. 267-277 (1999). Figure 5. Detailed statistical views of threads and locking and CPU utilization.
17. Mikhali Dmitriev, “Design of JFluid: A profiling technology and tool based on dynamic bytecode instrumentation,” Sun
Microsystems Report TR_2003-125, (November 2003).
18. The Eclipse Foundation, “Eclipse test and performance tools platform project,” http://www.eclipse.org/tptp/index.php, (August 2007).
19. Nathan Froyd, John Mellor-Crummey, and Rob Fowler, “Low-overhead call path profiling of unmodified, optimized code.,” Proc. ICS ’05, pp. 81-90 (2005).
20. Susan L. Graham, Peter B. Kessler, and Marshall K. McKusick, “gprof: A call graph execution profiler,”
SIGPLAN Notices Vol. 17(6) pp. 120-126 (June 1982).
21. Martin Hirzel and Trishul M. Chilimbi, “Bursty tracing: a framework for low-overhead temporal profiling,” 4th
Workshop on Feedback-Directed and Dynamic Optimization,
(December 2001).
22. Jeffrey K. Hollingsworth and Barton P. Miller, “An adaptive cost system for parallel program instrumentation,” Proc.
Euro-Par ’96 Parallel Processing, pp. 88-97 (1996).
23. Karen L. Karavanic, Barton P. Miller, and Improving online performance diagnosis by the use of historical performance data, IEEE Conf. on Supercomputing, (1999).
24. Gunter Kniesel and Pascal Costanza, “JMangler: a framework for load-time transformation of Java class files,” SCAM 2001, pp. 100-110 (November 2001).
25. Chris Laffra, Doug Lorch, Dave Streeter, Frank Tip, and John Field, “What is Jikes Bytecode Toolkit,”
http://www.alphaworks.ibm.com/tech/jikesbt, (March 2000).
26. James R. Larus, “EEL guts: Using the EEL executable editing library,” University of Wisconsin-Madison Computer Science Department (November 1996).
27. Ben Liblit, Alex Aiken, Alice X. Zheng, and Michael I. Jordan, “Bug isolation via remote program sampling,” PDLI ’03, pp. 141-154 (June 2003).
28. Babak Mahdavi and Karel Driesen, “Heap hot spot
visualization in Java,” McGill U. CS Tech report SOCS-01.8, (May 2001).
29. Leo Meyerovich, Michael Greenberg, Gregory Cooper, Aleks Bromfield, and Shriram Krishnamurthi, “FlapJax,”
http://www.flapjax-lang.org, (2007).
30. Sun Microsystems, “JVM tool interface version 1.0,”
http://java.sun.com/j2se/1.5.0/docs/guide/jvmti/jvmti.html,
(November 2004).
31. Sun Microsystems, “Dynamic tracing support in the Java HotSpot virtual machine,”
http://ava.sun.com/j2se/reference/whitepapers/java-dtrace-whitepaper.pdf, (2005).
32. Sun Microsystems, “Performance Analyzier, Sun Studio 11,”
Sun Microsystems Manual, (November 2005).
33. Barton P. Miller, Mark D. Callaghan, Jonathan M. Cargille, Jeffrey K. Hollingsworth, R. Bruce Irvin, Karen L.
Karavanic, Krishna Kunchithapadam, and Tia Newhall, “The paradyn parallel performance measurement tools,” IEEE
Computer Vol. 28(11) pp. 37-46 (1995).
34. Alexander V. Mirgorodskiy and Barton P. Miller, “Crosswalk: a tool for performance profiling across the user-kernel boundary,” Parallel Computing Conference, (2003). 35. Alessandro Orso, “Selective capture and reply of program
executions,” WODA 2005, (okscrpe).
36. Wim De Pauw, David Lorenz, John Vlissides, and Mark Wegman, “Execution patterns in object-oriented
visualization,” Proc. Conf. On Object-Oriented Technologies
and Systems, pp. 219-234 (1998). Figure 6. Three views provided
37. Wim De Pauw, Doug Kimelman, and John Vlissides, “Visualizing object- oriented software execution,” pp. 329-346 in Software Visualization: Programming as a Multimedia
Experience, ed. Blaine A. Price,MIT Press (1998).
38. Wim De Pauw and Gary Sevitsky, “Visualizing reference patterns for solving memory leaks in Java,” in Proceedings of
the ECOOP ’99 European Conference on Object-oriented Programming, (1999).
39. Wim De Pauw, Nick Mitchell, Martin Robillard, Gary Sevitsky, and Harini Srinivasan, “Drive-by analysis of running programs,” Proc. ICSE Workshop of Software
Visualization, (May 2001).
40. David J. Pearce, Matthew Webster, Robert Berry, and Paul H. J. Kelly, “Profiling with AspectJ,” Software Practice and
Experience Vol. 37(7) pp. 747-777 (June 2007).
41. Steven P. Reiss, “Connecting tools using message passing in the FIELD environment,” IEEE Software Vol. 7(4) pp. 57-67 (July 1990).
42. Steven P. Reiss, FIELD: A Friendly Integrated Environment
for Learning and Development, Kluwer (1994).
43. Steven P. Reiss, “Visualization for software engineering --programming environments,” in Software Visualization:
Programming as a Multimedia Experience, ed. Blaine
Price,MIT Press (1997).
44. Steven P. Reiss, “JIVE: visualizing Java in action,” Proc.
ICSE 2003, pp. 820-821 (May 2003).
45. Steven P. Reiss and Manos Renieris, “JOVE: Java as it happens,” Proc. SoftVis ’05, pp. 115-124 (May 2005). 46. Philip Charles Roth, “Scalable On-Line Automated
Performance Diagnosis,” U. Wisconsin-Madison Ph.D.
Dissertation, (2005).
47. Philip C. Roth and Barton P. Miller, “On-line automated performance diagnosis on thousands of processes,” Proc.
Principles and Practice of Parallel Programming, pp. 69-80
(2006).
48. Titos Saridakis, Christos Nikolaou, Maria Karavassili, Evangelos Markatos, Apostolos Zarras, and Catherine
Houstis, “ArrayTracer: a parallel performance analysis tool,”
U. Ioannina Tech. Report LYDIA/WP2/T.2.2/D4(b), (1996).
49. Arjan Seesing and Alessandro Orso, “InsECTJ: a generic instrumentation framewok for collecting dynamic
information within Eclipse,” Eclipse ’05, pp. 45-49 (October 2005).
50. ShiftOne, “JRat: the Java runtime analysis toolkit,”
http://jrat.sourceforge.net, (May 2005).
51. Margaret Simmons and Rebecca Koskela, Performance
Instrumentation and Visualization, ACM Press (1990).
52. A. Srivastava, A. Edwards, and H. Vo, “Vulcan: binary transformation in a distributed environment,” Microsoft
Research Tech Report MSR-TR-2001-50, (2001).
53. MIPS Computer Systems, Inc., RISCompiler Languages
Programmer’s Guide. December 1988.
54. Wily Technology, “Introscope and IBM Tivoli,” CA Wily
White Paper, (2006).
55. Sebastien Vauclair, Extensible Java Profiler, Diploma Thesis, EPFL (2002).
56. Jeffrey S. Vetter and Daniel A. Reed, “Managing performance analysis with dynamic statisticsl projection pursuit,” Proc SC
99, (November 1999).
57. D. Viswanathan and S. Liang, “Java virtual machine profiler interface,” IBM Systems Journal Vol. 39(1) pp. 82-95 (2000). 58. Abdul Waheed, Herman D. Hughes, and Diane T. Rover, “A
resource occupancy model for evaluating instrumentation system overheads,” Michigan State U. Dept. of EE Report
TR-MSU-EE-SCSL-023-95, (May 1995).
59. John Whaley, “A portable sampling-based profiler for Java virtual machines,” Proc. Java Grande 2000, pp. 78-87 (2000).
60. Brian J. N. Wylie, Bernd Mohr, and Felix Wolf, “Holistic hardware counter performance analysis of parallel programs,”
Proc. ParCo, (September 2005).
61. Benjamin Zorn and Paul Hilfinger, “A memory allocation profiler for C and Lisp programs,” Proc. Summer 1988