UCLA
UCLA Electronic Theses and Dissertations
TitleLearning-Based Techniques for Energy-Efficient and Secure Computation on the Edge Permalink https://escholarship.org/uc/item/6wt1q363 Author Guo, Jia Publication Date 2019 Peer reviewed|Thesis/dissertation
UNIVERSITY OF CALIFORNIA Los Angeles
Learning-Based Techniques
for Energy-Efficient and Secure Computation on the Edge
A dissertation submitted in partial satisfaction of the requirements for the degree
Doctor of Philosophy in Computer Science
by
Jia Guo
c
Copyright by Jia Guo
ABSTRACT OF THE DISSERTATION
Learning-Based Techniques
for Energy-Efficient and Secure Computation on the Edge
by
Jia Guo
Doctor of Philosophy in Computer Science
University of California, Los Angeles, 2019 Professor Miodrag Potkonjak, Chair
In the paradigm ofInternet-of-Things(IoT), smart devices will proliferate our living and working spaces. The recent decade has already witnessed an explosive growth of smartphones and wearable
devices. A plethora of newer and even more powerful systems are emerging. IoT will enable more fluid human-computer interaction and immersive experiences in smart homes. IoT will facilitate
rich sensing and actuating in intelligent warehousing and manufacturing. IoT will also empower fast and accurate perception and decision making in autonomous vehicles. The paradigm has
el-evated the role of the devices that constitute the edge of the network. Because of the sensitive nature and the sheer volume of the data generated by those devices, edge computing becomes a
more effective and efficient option. While it brings better privacy protection and latency reduction in applications, edge computing is associated with various constraints. For the sizable list of
de-vices that are operating on batteries, their sustainable operation usually calls for extremely efficient and judicious use of energy. Further, the inherent vulnerability accompanying the deployment in
unsafe environments requires extra layers of security.
In this dissertation, we study the energy and security problems of edge computing in the con-text of machine learning. We present various learning-based techniques for improving energy
efficiency. In contrast to the traditional resource allocation mechanisms that typically adopt hand-crafted rules and heuristics, we adopt a framework where we use machine learning learn to create
online resource allocation strategies from optimal offline solutions. We demonstrate the effective-ness of the framework in applications and scenarios including DVFS, computation offloading and
sensor networks. Our machine learning enabled strategies have approximated optimal solutions with an average of 2% error and achieved 40% in energy savings. In an increasing number of edge
computing applications, machine learning algorithms themselves constitute the core and the major workload. Many of those applications have high energy consumption and are vulnerable to
secu-rity issues such as intellectual property theft. To solve the problems, we derive techniques directly from the machine learning processes. We present computer vision-oriented adaptive subsampling strategies for image sensors, deep neural network pruning and customization, and deep neural
net-work watermarking for intellectual property protection. With little to no loss in the performance, we improve the energy efficiency and security machine learning systems.
The dissertation of Jia Guo is approved.
Miloˇs D. Ercegovac
Jens Palsberg
Gregory J. Pottie
Miodrag Potkonjak, Committee Chair
University of California, Los Angeles
TABLE OF CONTENTS
1 Introduction. . . 1
1.1 Internet of Things and Edge Computing . . . 1
1.2 Challenges and Motivation . . . 3
1.3 Contributions and Organization . . . 5
2 Learning-Based Code Offloading under Cloud Resource Constraints . . . 8
2.1 Preliminaries . . . 12
2.1.1 System Model . . . 12
2.1.2 Generating System Parameters . . . 15
2.1.3 Problem Formulation . . . 19 2.2 Method . . . 19 2.2.1 Offline Scheduling . . . 20 2.2.2 Classification . . . 23 2.2.3 Fairness . . . 26 2.2.4 Online Scheduling . . . 29 2.3 Evaulation . . . 29 2.3.1 Preliminaries . . . 29 2.3.2 Performance . . . 31 2.3.3 Discussion on Performance . . . 35 2.3.4 Fairness . . . 38 2.4 Conclusion . . . 42
3 Learning-Based DVFS for Video Decoding . . . 43
3.1.1 DVFS on Edge Devices . . . 46
3.1.2 Energy Management for Video Decoding . . . 46
3.2 Preliminaries . . . 47
3.3 Method . . . 49
3.3.1 Workload Estimation . . . 49
3.3.2 Offline Frequency Assignment . . . 51
3.3.3 Frequency Prediction . . . 53
3.3.4 Online . . . 55
3.4 Evaluation . . . 55
3.4.1 Experimental Setup . . . 56
3.4.2 Optimal Frequency Assignment . . . 56
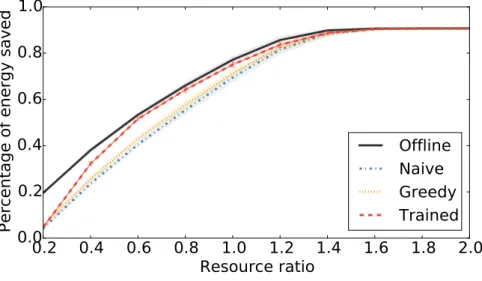
3.4.3 Diminishing Returns . . . 57
3.4.4 Frequency Assignment Prediction . . . 58
3.4.5 Online Results . . . 58
3.4.6 Case Studies . . . 59
3.5 Conclusion . . . 61
4 Sustainable Operation of Environmentally-Powered WSNs . . . 63
4.1 Related Work . . . 65
4.1.1 Energy Harvesting . . . 65
4.1.2 Self-sustainable Sensor Networks . . . 66
4.1.3 Dynamic Routing for Sensor Networks . . . 66
4.2 Overview . . . 67
4.3 System Model . . . 67
4.3.2 Energy Model . . . 68 4.3.3 Dataset . . . 70 4.4 Segment Partition . . . 71 4.5 Routing Algorithm . . . 72 4.6 System Configuration . . . 77 4.6.1 Route Selection . . . 77
4.6.2 Sampling Frequency Selection . . . 78
4.7 Evaluation . . . 79
4.7.1 Routing Algorithms . . . 79
4.7.2 Training . . . 80
4.7.3 Testing . . . 80
4.8 Conclusion . . . 82
5 Adaptive Image Sensor Subsampling for Computer Vision . . . 83
5.1 Related Work . . . 85
5.2 CMOS Image Sensors . . . 86
5.2.1 Architecture and Operation . . . 86
5.2.2 Energy Model . . . 87
5.3 Problems with Subsampling . . . 87
5.4 Proposed Method . . . 90
5.4.1 Two-Step Subsampling . . . 90
5.4.2 AdaSkip . . . 91
5.4.3 AdaSkip Hardware Extension . . . 93
5.5 Experimental Setup . . . 93
5.6.1 Two-Step Subsampling . . . 95
5.6.2 AdaSkip Subsampling . . . 96
5.7 Conclusion . . . 99
6 Customized On-Device Deep Neural Networks Pruning . . . 100
6.1 Related Work . . . 102
6.2 Preliminaries . . . 103
6.3 Pruning Filters . . . 105
6.3.1 Filter Sensitivity Analysis . . . 105
6.3.2 Selecting Which Filters to Prune . . . 106
6.4 Compensation . . . 107
6.4.1 Compensation with Mean . . . 107
6.4.2 Compensation with Correlated Filters . . . 107
6.4.3 Compensating with Linear Combination of Filters . . . 109
6.5 Implementation . . . 109
6.5.1 Pruning . . . 111
6.5.2 Compensation . . . 111
6.5.3 Compensation with Linear Combination of Filters . . . 112
6.5.4 Deployment and Computation Reduction . . . 112
6.6 Evaluation . . . 115
6.6.1 Case Study . . . 115
6.6.2 Classification Accuracy . . . 117
6.6.3 Energy Consumption and Latency . . . 121
6.6.4 Different Pruning Criteria . . . 121
7 Watermarking Deep Neural Networks for IP Protection . . . 124
7.1 Related Work . . . 126
7.1.1 Multimedia Watermarking . . . 126
7.1.2 Circuit, Software, and Algorithm Watermarking . . . 126
7.1.3 DNN Watermarking . . . 127
7.2 The General Method . . . 128
7.2.1 Watermark Embedding and Detection . . . 128
7.2.2 Criteria for Evaluation . . . 130
7.2.3 Security and Threat Model . . . 131
7.2.4 Notation . . . 132
7.2.5 Proof of Ownership . . . 133
7.3 Watermarking using Imperceptible Trigger Patterns . . . 134
7.3.1 Workflow . . . 135
7.3.2 Trigger Pattern Creation . . . 136
7.3.3 Optimal Trigger Pattern Magnitude . . . 136
7.3.4 Training Model . . . 139
7.4 Improving the Trigger Patterns . . . 139
7.4.1 Motivation . . . 139
7.4.2 Problem Definition . . . 140
7.4.3 Differential Evolution . . . 141
7.4.4 Optimization for DE . . . 143
7.5 Evaluation . . . 143
7.5.1 Imperceptible Trigger Patterns . . . 145
7.5.2 Improved Trigger Patterns . . . 150
8 Concluding Remarks . . . 158
LIST OF FIGURES
2.1 System workflow of code offloading . . . 11
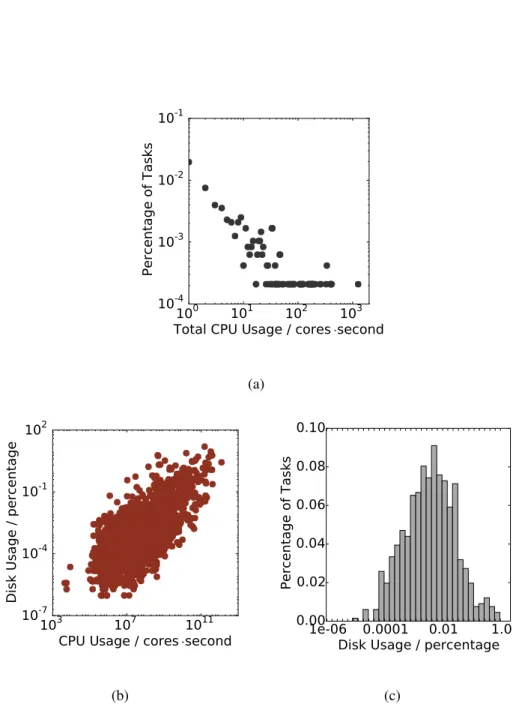
2.2 Characteristics of Google cluster traces: (a) shows the distribution of CPU usage; (b) shows the distribution of disk usage against the distribution of CPU usage; (c) shows distribution of disk usage of tasks with CPU usage between a small range . . . 17
2.3 Sample of cellular network usage traces . . . 18
2.4 Distribution of network traffic of users . . . 19
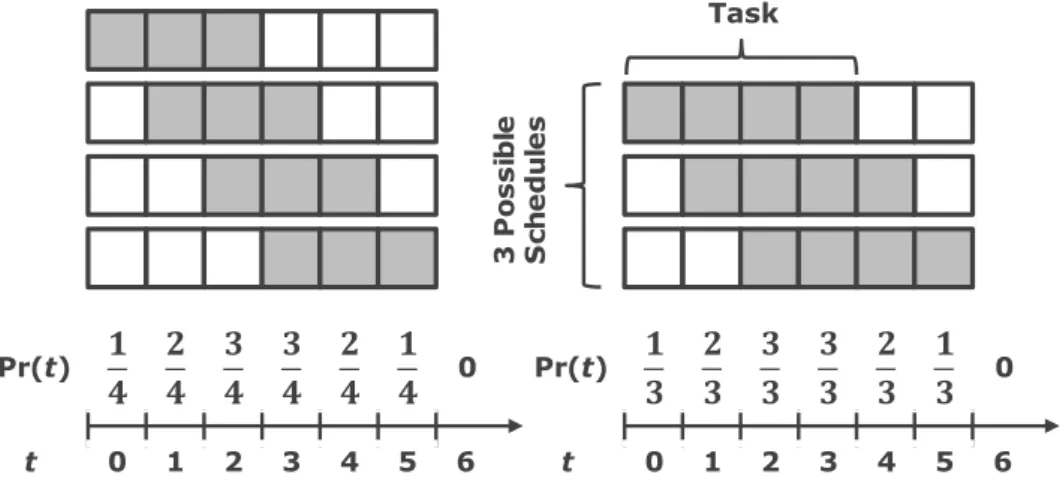
2.5 The probabilistic distribution of two example offloading tasks . . . 23
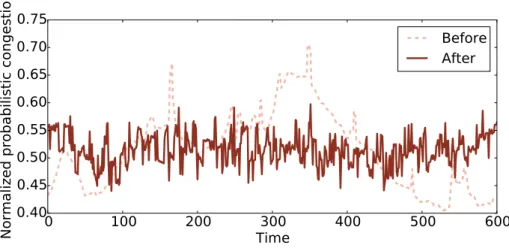
2.6 Demonstration of the probabilistic scheduling algorithm . . . 24
2.7 Characteristics of logistic regression for code offloading decision: (a) shows the dis-tribution of probability produced by logistic regression; (b) shows the online perfor-mance with different threshold for the logistic regression classifier . . . 34
2.8 Performance with different data center resource ratios . . . 35
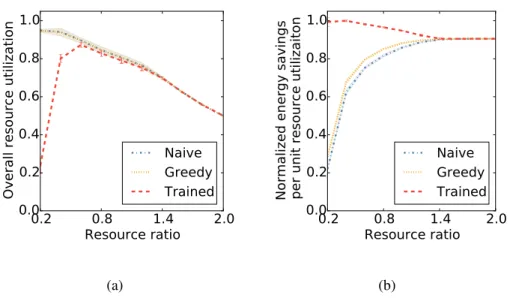
2.9 Details on the performance with different data center resource ratios: (a) shows the utilization of data center (b) shows the efficiency of the data center, defined by energy savings per machine . . . 36
2.10 Performance with various code offloading system parameters: (a) shows performance with different granularity of training; (b) shows performance with differentαin power law distribution; (c) shows performance when tasks are have different slacks. *The shaded areas represent the confidence intervals of baseline algorithms, while the error bars represent that of the targets of study. . . 37
2.11 Comparison between the algorithms for max-min fairness and proportional fairness with randomly assigned tasks: (a) shows energy savings of two algorithms with dif-ferent number of tasks per user; (b) shows the corresponding measurement of Jain’s fairness index . . . 40
2.12 Performance and fairness trade-off with randomly assigned tasks: (a) shows Jain’s fair-ness index obtained with different probabilityPrdirectto offload without classification;
(b) plots the energy savings against different Jain’s fairness indices . . . 41
2.13 Performance and fairness trade-off with tasks assigned in power law distribution: (a) plots the energy savings against different probabilityPrdirectto offload directly without classification; (b) shows the percentage of demand satisfied of different user groups. Groups are created by equally dividing users ranked from high to low according to their demand . . . 42
3.1 Video playback system model. . . 48
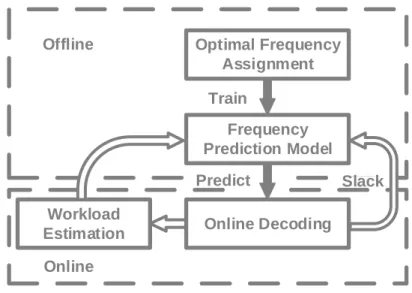
3.2 System workflow of learning-based DVFS for video decoding. . . 49
3.3 Examples of video segment decoding workload. . . 50
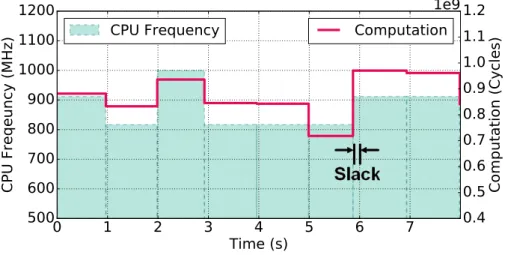
3.4 Sample optimal CPU frequency assignment and the corresponding decoding process. . 53
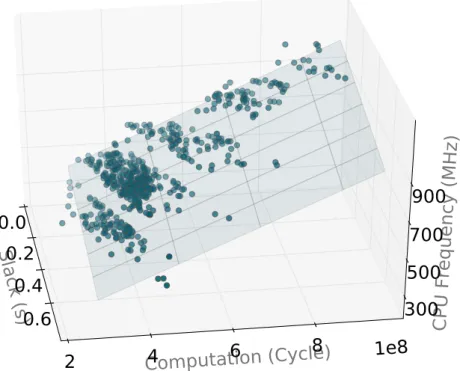
3.5 Relationship between the decoding progress, the computational workload and the op-timal CPU frequency assignment of the next segment. Points with darker colors are closer to the reader and those with lighter colors are further away. . . 54
3.6 Normalized energy consumption of video decoding using optimal frequency assign-ment with different segassign-ment lengths. . . 57
3.7 Figures showing the offline (optimal) and the online (predicted) CPU frequency as-signment to segments in the test video 3.7(a)carphone; 3.7(b)waterfall; 3.7(c) tempete; 3.7(d)pamphlet. . . 62
4.1 System workflow of the sustainable operation of the solar powered sensor network. . . 68
4.2 An example network model with 10 sensors. Arrows represent paths from nodes to the sink node. Intermediate nodes are responsible for their own data as well as that of other nodes farther away. . . 69
4.3 The 54 sensors placement of Intel Berkeley Lab [1]. . . 71
4.5 The greedy and optimal sampling frequencies derived in training. . . 80
4.6 Sampling frequencies and corresponding segment sustainability in testing. . . 81
5.1 CMOS image sensor operation with rolling shutter. . . 85
5.2 Errors caused by subsampling. (a) The original image of a bus; (b) 32×32 resam-pled image using bilinear kernel; (c) visualized source of errorIin channel “R”. Red dots are pixels that increase loss, and blue dots are those that decrease loss. The less transparent the color, the larger impact a pixel has; (d)32×32smoothed subsampled image. . . 89
5.3 Visualization of AdaSkip-based subsampling. (a) The original512×512 image; (b) the output of the AdaSkip algorithm, where the greyscale parts are rows sampled with sl = 8and the colored part are rows sampled withsh = 4; (c)32×32output images from two-step subsampling withs = 4and bilinear resampling; (d) 32×32images obtained by bilinear resampling the output in (b). . . 97
5.4 Energy accuracy trade-offs using AdaSkip. (a)32×32classifiers withsl= 8, sh = 4; (b)48×48classifiers withsl = 4, sh = 2 . . . 98
6.1 Once the neural network models are trained and shipped to users, each user will run a local program to prune the model according to their needs. . . 101
6.2 Demonstration of the unrolled convolution operation. . . 103
6.3 System workflow of our customized DNN pruning method. . . 104
6.4 Implementation of pruning and compensation for convolution N. . . 110
6.5 Performance evaluations of the method using NIN on CIFAR-10 dataset with different percentage of filters pruned1. . . 120
6.6 Comparison among different pruning criteria. . . 122
7.2 Overview of the proposed example watermarking technique on DNN based image classifiers. . . 134
7.3 Classification accuracy drop of a regular VGG16 model when trigger patterns of dif-ferent lengths and magnitudes are added to the CIFAR10 training set. . . 137
7.4 Examples of trigger inputs. (a) a random out-of-distrbution image [2], (b) a regular image with a logo [3], (c) a regular image with a color-coded key not perceptible by the eye [4]. . . 139
7.5 Best fitness of the population across the generations. . . 145
7.6 Probability of passing the ownership test with different test sizes and margins of error. 148
7.7 Output of our DE algorithm. (a) TheKeytrigger pattern on CIFAR-10, (b) theLogo
trigger pattern on CIFAR-10, (c) theKeytrigger pattern on MNIST, (d) a sample using the trigger pattern in (a), (e) a sample using the trigger pattern in (b), (f) a sample using the trigger pattern in (c). . . 151
7.8 False positive rates of different CIFAR-10 trigger sets. It is the probability of a non-watermarked DNN getting falsely triggered. The lower the false positive rate the better. 154
7.9 Normalized probability of a regular model passing the ownership test (∆ = 5, N =
LIST OF TABLES
1.1 Major contributions and organization of the dissertation. . . 5
2.1 Code offloading task parameters . . . 14
2.2 Overview of the scheduling algorithms for offloaded tasks . . . 20
2.3 Feature selection for logistic regression . . . 26
2.4 Statistical properties of the synthetic workload . . . 32
2.5 Offline performance compared with upper bounds . . . 32
2.6 Evaluation of logistic regression classifier . . . 33
2.7 Overall performance of offline and online algorithms . . . 34
3.1 CPU voltage and frequency table [5] . . . 56
3.2 Offline normalized energy consumption . . . 56
3.3 CPU frequency assignment prediction . . . 58
3.4 Normalized online energy consumption . . . 59
3.5 Decoding deadline miss rate . . . 59
4.1 Comparison of system sampling frequency with different routing strategies. . . 79
5.1 Effects of direct subsampling on 10-class classifiers with different input sizes . . . 88
5.2 Classifiers used in our experiments . . . 94
5.3 Accuracy loss caused by two-step subsampling with different step sizes on different classifiers . . . 94
6.1 Comparison between the original 10-Class NIN model and pruned 5-class NIN models that on average achieves 91.2% classification accuracy, 38.5% in energy savings and 19.5% in latency improvements. . . 116
7.1 Criteria for evaluating DNN watermarks. . . 130
7.2 Performance of the example watermarking method on different models and datasets.
The classification results are obtained from regular training set (Dtrain), test set (Dtest)
and training set embedded with trigger pattern (Dtrain
αm ). . . 146
7.3 Confidence intervals of classification accuracy of watermarked VGG16 models on CIFAR-10 obtained from 5 watermarking experiments. . . 147
7.4 Classification accuracy of VGG models on CIFAR-10 training sets embedded with
dif-ferent trigger patterns. The model VGGWMK
#k is trained on the training set embedded withmk. . . 149
7.5 Classification accuracy of watermarked models on test sets and trigger tests. The trig-ger sets are derived from the test sets using theKey/Logomethod. . . 153 7.6 Classification accuracy of watermarked models on corresponding CIFAR-10 trigger
ACKNOWLEDGMENTS
First and foremost, I would like to thank my adviser and committee chair, Professor Miodrag
Potkonjak, for his support and guidance through all of my years at UCLA. I would not have become a graduate student in computer science without his help in the first place. I would not have grasped
the art and craft of scientific research without his instructions. Not only have I benefited from the invaluable insights and advice on that he offered on my career and life, but I have also been inspired tremendously by his perseverance and optimism in the face of unimaginable hardship.
To my doctoral committee members, Professors Miloˇs D. Ercegovac, Jens Palsberg, Gregory J. Pottie, and the late Professor Mario Gerla, thank you for your insightful comments and advice on
my prospectus, dissertation, and final defense, and for aiding me in the completion of my graduate studies.
I would like to thank my professors in UCLA, my professors at Zhejiang University and my mentors at MSRA for not only providing me with a solid foundation in science and engineering
but also giving me the passion to learn, research and build. I would also like to thank my hosts and mentors at Baidu, InferVision, and Google for offering me the opportunities to be exposed to the
latest technological trends and gain valuable industry experiences.
Many thanks to my collaborators and colleagues at UCLA: James B. Wendt, Teng Xu, Hongx-iang Gu, and Moustafa Alzantot, who discussed research ideas with me, worked together with me
on research projects, and offered me a great deal of help in carrying out experiments and in writing. I would like to thank James B. Wendt for helping me kick off my research at UCLA with the work
in Chapter 2. I would like to thank Teng Xu for being my Ph.D. mentor and supporting the work in Chapter 4. I would like to extend a huge thank you to Hongxiang Gu not only for assisting me
with the work in Chapter 5, but also for being a generous sharer of knowledge and ideas, an artic-ulate critic, and the only lab mate for an extended period of time. Special thanks go to Professor
Potkonjak who oversaw and co-authored all of the research work that constituted the chapters in this thesis.
And finally, I would like to thank my family and friends who have supported me throughout my
motivating my academic pursuits, and providing me with the means and confidence to dream big. And to Daxiao for always being there to give her unwavering support and encouragement, despite
VITA
2010–2014 B.Eng. (Electronic and Information Engineering) Zhejiang University.
2014–2018 M.S. (Computer Science)
University of California, Los Angeles.
PUBLICATIONS
J. Guo, and M. Potkonjak, Evolutionary Trigger Set Generation for DNN Watermarking,submitted,
Feb. 2019.
J. Guo, and M. Potkonjak, Watermarking Deep Neural Networks for Embedded Systems,IEEE/ACM
International Conference on Computer Aided Design (ICCAD), pp. 133, Nov. 2018.
J. Guo, H. Gu, and M. Potkonjak, Efficient Image Sensor Subsampling for DNN-Based Im-age Classification, IEEE/ACM International Symposium on Low Power Electronics and Design
(ISLPED), Jul. 2018.
J. Guo, and M. Potkonjak, Pruning ConvNets Online for Efficient Specialist Models,IEEE
Confer-ence on Computer Vision and Pattern Recognition Workshops (CVPRW), pp. 430-437, Jul. 2017.
J. Guo, and M. Potkonjak, Pruning Filters and Classes: Towards On-Device Customization of Convolutional Neural Networks, International Workshop on Deep Learning for Mobile Systems
J. Guo, and M. Potkonjak, Coarse-Grained Learning-Based Dynamic Voltage Frequency Scaling for Video Decoding,International Symposium on Power And Timing Modeling, Optimization and
Simulation (PATMOS), Sep. 2016.
J. Guo, T. Xu, T. Stavrinos, and M. Potkonjak, Enabling environmentally-powered indoor sensor networks with dynamic routing and operation, International Symposium on Power And Timing
Modeling, Optimization and Simulation (PATMOS), Sep. 2016.
J. Guo, J.B. Wendt, and M. Potkonjak, Learning-Based Localized Offloading with
Resource-Constrained Data Centers, IEEE International Conference on Cloud and Autonomic Computing (ICCAC), Sep. 2015.
CHAPTER 1
Introduction
1.1
Internet of Things and Edge Computing
Since its conception at the turn of the century [6], Internet of Things (IoT) has gained
tremen-dous traction in both the academia and the industry. As its name suggests, the paradigm of IoT is established upon the prevalence and interconnectedness of smart agents or “things”. Through
communication, sensing and actuating, they collectively undertake ambitious tasks. The concept has been adapted and applied to a wide range of industries, including manufacturing,
transporta-tion, surveillance, healthcare, environment, and home automation. It is estimated that there will be over 75 billion connected devices worldwide by 2025 [7], and by then the market is expected to
reach $ 1.1 trillion [8]. IoT constitutes an even larger ecosystem if we take into consideration the trillion-dollar PC and smartphone industries, both of which are crucial parts of the paradigm. The
paradigm of IoT promises to enable applications that transform business and people’s lives.
IoT systems run a diverse range of workloads. To begin with, communication is the funda-mental need of IoT systems. The ability to seamlessly integrate with smartphones over low power
Bluetooth make wearable devices best-selling gadgets. The ad hoc communication channels allow massive sensor networks to be deployed in the field [9]. Secondly, sensing is one of the most
important components. Systems that require sensing range from surveillance cameras in smart homes, to automated production line in smart factories. The sensing task can be as simple as
read-ing a temperature sensor. It can also be as complex as encodread-ing and decodread-ing videos [10]. Lastly, recent advances in artificial intelligence have also pushed the boundaries of IoT systems. Machine
learning (ML), in particular, stands out as a practical and effective method to supply IoT devices with autonomy and machine intelligence. Machine learning has been applied to infer activity from
smartphone sensor data [11] [12]. ML-based speech recognition has allowed smooth and natu-ral conversations with smart home devices [13]. Autonomous vehicles heavily rely on computer
vision algorithms that are based on deep convolutional neural networks [14]. Executing machine learning models have become a unique type of workload on modern IoT devices.
To accommodate the workload, edge computing has emerged as the preferred computation model in the paradigm of IoT [15]. As opposed to cloud computing, where computation occurs in
the centralized cloud servers, edge computing defines a framework where computation is carried out on the edge of the network. The edge can refer to a gateway or a cloudlet with computing capabilities. More often, it refers to the “things” themselves. The motivations for adopting edge
computing are manifold. Most importantly, with their growing sensing capabilities, the edge will generate an increasingly large amount of data. In many applications, edge devices can process
data with much better energy efficiency. Fitted with engines that carry 5000 sensors, a single Bombardier C Series jetliner generates 844 TB of data during a 12-hour flight [16]. Consumer
electronics are also equipped with ever-evolving sensing capabilities. One second of a raw 30 FPS 4K video, which many of today’s smartphone cameras are capable of producing [17], amounts to
over 600 MB of data. Uploading such a large amount of data to the cloud for processing is ex-tremely inefficient, if not infeasible. Secondly, edge computing safeguards users’ privacy. Smart
home devices such as the Amazon Echo series [18] and the Google Home/Nest series [19], have gradually found their way into households. Due to their ability to collect data through microphones and cameras, they have been under strict public scrutiny [20]. Companies have established rules to
ban the compromising act of transferring sensitive data to the cloud. As a result, edge computing remains the only viable option for data processing. Finally, edge computing induces much lower
latency compared to cloud-based solutions. Applications such autonomous vehicles require data to be processed in real time. Today’s mobile network on average takes over 100 ms for a round trip
from the device to the cloud [21], and it is far from satisfying latency requirements of those appli-cations. Only computing on the edge will be able to satisfy the stringent requirements in latency. It
has become clear that IoT devices are transforming from data consumers to data producers. Edge computing is going to play a more important role as the devices undergo the transition.
1.2
Challenges and Motivation
The realization of the IoT and edge computing vision is subject to a different set of constraints comparing to those from the PC and internet era. In particular, energy and security are among the
most important constraints.
Many IoT devices are battery-powered and face energy constraints. The most relatable
ex-ample might be the various wearable devices that people today carry in their daily lives [22]. Smartphones are also an integral part of the loop by serving as a central information hub connect-ing the devices. Without an exception, the devices mentioned above are all powered by batteries.
Although various energy-saving features have been built in, the battery life is still extremely lim-ited, in some cases as low as an hour [23]. Autonomous vehicles are also powerful moving IoT
nodes that are powered by batteries. While vehicles are using the batteries of a much higher cal-iber than those of wearable devices, energy efficiency remains an important issue for them. The
intensive computation required for the perception and control components makes the autonomous vehicles extremely power hungry. It is reported that sensing and computation consume around
2500 watts of power [24], at which rate the commercial electric car batteries will be drained in hours even without the user driving it [25]. In addition, IoT has brought automation to what used
to be labor-intensive industries such as farming and environmental monitoring. For example, agri-culture technology companies are using battery-powered drones to monitor crop growth [26]. Even
in remote areas where no infrastructure exists to provide with electric power, IoT is playing a role. Researchers have long envisioned the large scale deployment of environmentally powered sensor networks [27]. The initiative is slowly coming into fruition with the commercialization efforts
such as the deployment of solar-powered devices in the ocean [28]. We are convinced that energy efficiency is a crucial requirement of the IoT systems. Reducing the energy consumption of such
systems is thus widely recognized as an active research field.
Another important desideratum of IoT systems is security. Tasked with connecting the
physi-cal world, such systems are bound to encounter diverse operating environments. Unlike PCs and servers, which are safely harbored in offices or data centers, edge devices are exposed to attacks
one incident, an attacker was able to control other connected devices through a hack that involves physical access to a Nest thermostat [29]. Many other incidents involve cameras being attacked
remotely over the internet [30]. The complexity of the security issues with IoT is not only reflected by the diverse ways of attack, but also the target of the attack. Information from both the user and
the developer may be compromised. One critical type of attacks that target developers is intellec-tual property (IP) theft. With physical access to compromised devices, it is easier for attackers to
steal proprietary data and conduct software piracy than in the cloud or web-based setting. IP is usually considered one of the most important competitive advantage of a tech company. IP theft will incur a considerable loss to the developers and harm the health of the ecosystem.
To improve the energy efficiency and security of different types of workloads in IoT systems, we adopt different strategies. The communication and sensing workload in IoT systems sometimes
depend on the external factors. Congestion on the Internet, like many other things in the world that adhere to our society’s schedule, follows a periodic pattern. It is only wise for IoT systems to
avoid busy periods in order to save resources. As another example, the amount of computation needed to process data, e.g. decode a video, can be dependent on the data itself. It is unclear
how much computational power to allocate in order to process the data timely and efficiently. All of the examples above more or less involve a prediction problem. We need to predict how much
resources we need before we allocate them efficiently. Simple heuristics often fail to capture the complex nature of the situations. This is when we need the help of machine learning. There are challenges associated with using machine learning to solve the prediction problem. To begin with,
we usually don’t have the labeled data which is crucial to training a machine learning model. In addition, it is never easy to design lightweight models that are able to predict with high accuracy.
But if we are able to create models with high performance, the potential benefits we can bring to the systems are huge.
The third type of workload is machine learning. While we could treat the machine learning models as black boxes as any other workloads, it is not the most effective approach. Many machine
learning models are complex non-linear functions. Methods that improve the energy efficiency and security of machine learning applications should align with, if not be part of, the optimization
Non-ML Applications ML Applications
Energy
Efficiency
• Code Offloading with Resource-Constrained Cloud (Ch. 2)
• Learning-Based DVFS (Ch. 3)
• Sustainable Operation of Environ-mentally Powered WSN (Ch. 4)
• Adaptive Image Sensor Subsampling for Computer Vision (Ch. 5)
• Customized On-Device DNN Pruning (Ch. 6)
Security
• Secure DNN Watermarking for IP Protection (Ch. 7)
• DNN Watermarking with Improved Robustness (Ch. 7)
Table 1.1: Major contributions and organization of the dissertation.
algorithms. The neurons in the model are the result of a fragile co-adaptation [31]. As a result, any subtle changes in the weights may have huge effects on the inference results. If we should
like to reduce the model size or modify the model to incorporate security features, we will need a method to negate such effects. Finding a proper method is a challenge, especially given the unique constraints posed by different scenarios. In addition, many peripheral components that
are interdependent with machine learning models should also be treated in a similar manner. For instance, any changes to the sensor that provides data to machine learning models should be made
in such a way that minimizes the impact on the models. In summary, we need to design a method that can be integrated with the machine learning process in order to make it more energy efficient
and secure.
1.3
Contributions and Organization
This thesis addresses the energy and security issues of edge computing systems by examining a
handful of popular applications. Table 1.1 summarizes the contributions and the organization of the thesis. As different workloads require different methods, we categorize the applications into
Chapter 7 fall into the ML-based category. Chapter 2, Chapter 4, and Chapter 3 describe learning-based techniques designed for various non-ML applications.
We begin the thesis by presenting methods to improve energy consumption for mobile of-floading, dynamic voltage and frequency scaling (DVFS), and environmentally powered sensor
networks. Code offloading refers to the frameworks where parts of the program are migrated from the IoT devices to the cloud in order to reduce energy consumption. When the cloud does not have
an infinite amount of resources, it should prioritize programs that are most effective in bringing energy savings. In Chapter 2, we propose scheduling techniques and a machine learning-based offloading algorithm to further to address the issue. In Chapter 3, we focus on the energy
manage-ment technique called dynamic voltage and frequency scaling (DVFS). The power consumption of a circuit is proportional to the square of the operation voltage. DVFS saves energy consumption
by assigning a lower CPU voltage and lowering the frequency and slowing the execution when there is a smaller workload. Without application-level semantic information, it is inherently hard
to find a suitable CPU frequency. Using video decoding as an example, we propose to use machine learning for CPU frequency prediction and improve the effectiveness of DVFS. Chapter 4 offers
a case study of an environmentally powered sensor network. We analyze the energy harvested by each sensing and message forwarding node and propose a routing and operation schedule that
maximizes the lifetime of the entire sensor network. The chapters follow a unified procedure. We first design offline algorithms that find optimal or near-optimal solutions. Then we learn to approximate such solutions and derive our online learning-based strategies.
Next, we introduce a set of techniques to improve the energy efficiency of programs that center around machine learning. In Chapter 5, we aim to bridge the gap between the ultra-high resolution
of commercial image sensors and the low resolution needed for computer vision algorithms. In-stead of sampling the entire pixel array of the image sensor, which is extremely inefficient in terms
of energy, we propose an adaptive subsampling strategy that reduces the number of pixels needed to create an image. The strategy is designed to maintain the performance of computer vision
al-gorithms when the sampled images are used as inputs. Modern computer vision pipelines usually include stages that range from image sensing to inference using machine learning. Following
models in Chapter 6. In particular, we prune channels from convolution neural networks to create faster, energy efficient and customized models. The approaches we introduce are closely coupled
with the intrinsic characteristics of the machine learning models and provide unique insights into their respective problems.
Finally, we discuss techniques to improve the security of IoT systems. In Chapter 7, we focus on the problem of IP protection in the wake of massive commercialization of deep neural networks.
The problem is especially prominent when attackers have complete access to the IoT devices and may be able to steal the intellectual property with various attacks. In order to protect the IP right of the model owners, we propose to embed watermarks in the deep neural network models to
en-able identification and proof of ownership. We first layout a method where we place the owner’s signature onto regular inputs to create the “trigger set”, a type of inputs used to trigger a specific
behavior of the neural network. By showing the disproportionally low probability of such behavior occurring naturally, the owner identifies and proves his ownership. After that, we describe an
evo-lutionary algorithm-based technique to improve the robustness of the method against fine-tuning attacks. We integrate the proposed framework in the training processing of the neural network in
CHAPTER 2
Learning-Based Code Offloading under Cloud Resource
Constraints
Energy is one of the biggest constraints for the development of edge computing. In recent years,
researchers have proposed various frameworks that enable offloading applications to the cloud as a way of saving energy. Cuervoet al.[32] introduced MAUI in 2010, a code offloading framework
that makes fine-grained offloading decisions at run time. Chunet al.[33] also approach the same problem with a VM based offloading framework, where an image of the mobile system is set up in the cloud so that minimal effort is needed to modify the original program. Kostaet al.[34] takes
the same approach a step further by enabling scalable parallel execution in the cloud. Even though these systems are in the early stages of development, we believe that offloading can be a viable
solution to the energy problem.
Though researchers have usedmobile cloud computingto denote the new paradigm [35], there
are key differences between offloading in edge computing systems and traditional cloud computing systems. First, the location of execution(i.e. locally or in the cloud) is flexible. A task can be
executed in the cloud if in such way energy can be saved. Or the task can be executed locally if the offloading overhead outweighs the benefit. Traditional cloud computing systems put heavy
emphasis on reliability and availability because of the all-or-nothing style service they offer. When a web server is down, the website cannot be accessed until the outage is over. Similarly, users of EC2 would not expect the service to be unavailable and prepare a ready-to-run local version. In
the offloading settings, however, tasks always have the option to be executed locally. Therefore, a better definition for offloading is a cloud-based augmentation [36]. It is intrinsically a bonus
feature that enhances user experience. Second, offloading frameworks provide accurate profiling of tasks. The profiling is usually done as part of the run-time optimization engine. In MAUI,
for example, program profiles consist of software states and data, CPU cycles and execution time [32]. The MAUI solver takes into account network condition and program profile and solves for a
program partitioning strategy that minimizes the smart phone’s energy consumption under latency constraints. Such fine-grained profiling of programs provides prior knowledge of heterogeneous
tasks, which is not accessible in the traditional cloud computing environment. This allows for fine-grained task scheduling in the data center. It also enables the evaluation of tasks in terms of their
efficiency in saving energy.
Those characteristics provide new opportunities for data centers as well. The data center nowa-days is characterized by over-provisioning. A typical data center uses only 10-50% of its
com-puting power for most of the time [37]. Given poor energy-proportionality [38], a large cost is incurred not only by the one-time purchase of hardware but also by the energy consumption of the
under-utilized node. Sophisticated load prediction techniques [39] [40] may be able to alleviate the overhead. However, such cost is intrinsically caused by the availability requirement of the cloud,
or requirement that cloud service beingon-demand self-service[41]. The problem can only be al-leviated rather than solved. A data center targeting offloading applications, on the other hand, has
the potential to change the picture. We envision a cost-aware data center that provides constrained resources for offloading. In the face of resource shortage, the data center becomes selective in
scheduling tasks such that the maximum amount of energy is saved globally. The fine-grained task profiles enable the selection of tasks. The flexibility of offloading frameworks allows some tasks to be executed locally. The efficiency of energy saving and the low cost will justify the system design
as a service. Overall, we believe such data center design is well justified and suited for offloading scenarios.
The difficulty in designing such systems mainly involves solving an optimization problem: given data center resource constraints, how can we schedule tasks such that the global energy
savings are maximized. The key is to design a solution that solves the optimization problem with low overhead. In particular, the system is desired to be localized, i.e., an optimal offloading
decision should be made by mobile devices without communicating with the data center to avoid unnecessary energy overhead. Another aspect to consider is the fairness of the shared system.
Only a few frameworks have been proposed that seek to optimally allocate resources when mul-tiple users offload simultaneously. Shuet al. modeled the system as a queuing network, and studied
the global energy consumption and delay tradeoff [42]. Yet the system is not localized as they as-sume tasks are from a single mobile client. Barbarossaet al.targeted multiple users collocated at a
small cell base station, and proposed an algorithm that jointly optimizes the computation resources and radio power through the formulation of a convex function [43]. The algorithm again requires a
centralized system, and wireless channel contention in their problem might not be valid in a more general setting. In the same collocated mobile clients problem setting, Chen proposed localized game theory based solution under wireless communication channel resource constraints [44]. In
conclusion, existing works on resource allocation either a) target specific scenarios and lack gen-erality, or b) rely on centralized schemes, which increase communication overhead. In addition,
no work has considered the fairness issue yet.
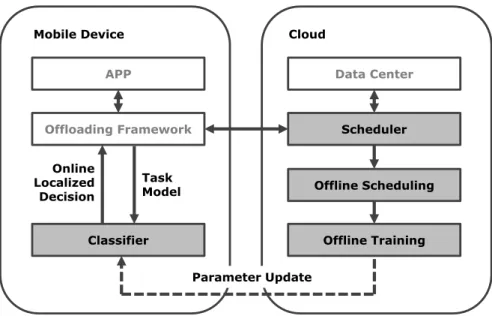
Our solution is a framework where the system learns online localized decisions from offline
centralized solutions. In the offline phase, all task information is given as prior knowledge, and the data center needs to obtain a near-optimal solution that maximizes energy savings. We formulate
the offline problem as a scheduling problem and obtain upper bounds through Linear Programming (LP). We propose a probability-based algorithm that is able to obtain an approximate solution in
polynomial time. The results are then used to train a logistic regression classifier. In the online phase, mobile clients use the classifier to make localized real-time decisions on offloading, thereby avoiding sending out inefficient tasks. When considering fairness, the users allows a probability for
the tasks to be offloaded without going through decision making by the classifier. The data center uses a proportional fair scheduler and achieves fairness among offloaded tasks while maintaining
relatively high performance. The system workflow is shown in Figure 2.1. Based on simulation using real-life workload traces, we observe that our offline algorithm produces a near-optimal
solu-tion, and the classifier-based online approach yields result close to the offline while outperforming baselines by a large margin.
Our contributions are multi-fold. First, to the best of our knowledge, we are the first to pro-pose a learning-based localized solution to the resource allocation problem in offloading systems.
APP Offloading Framework Classifier Data Center Scheduler Offline Training Task Model Online Localized Decision Parameter Update Offline Scheduling
Mobile Device Cloud
Figure 2.1: System workflow of code offloading
derived upper bounds, achieves near-optimal results. Third, we are the first to consider the fairness
of the data center resource allocation problem in the offloading scenario. Lastly, we use real-life work load traces to build realistic simulation of the offloading system.
The rest of the chapter is organized as follows. Section 2.1 analyzes real-life traces, introduces the models we use for simulation and formulates the problem. Section 2.2 introduces the details
of each parts of the framework: Section 2.2.1 covers offline scheduling problem and our approxi-mation algorithm, Section 2.2.2 describes classifier and feature selection, Section 2.2.3 introduces
fairness and proposes mechanisms for fairness in the framework, and Section 2.2.4 shows how the system work in simulation. Section 2.3 evaluates the system: Section 2.3.1 introduces the
simu-lation setup and analyzes the synthetic workload to provide background knowledge, Section 2.3.2 evaluates the performance of the offline scheduling algorithm, classification, as well as overall per-formance in energy saving, Section 2.3.3 shows the effect of various system parameters have on
2.1
Preliminaries
Consider a scenario where various mobile clients offload tasks to the cloud for remote execution. The mobile clients neither communicate nor interfere with each other. The tasks have a release time
as well as a deadline and are also characterized by a set of parameters derived from computation, network, and energy models. The tasks can either run locally or be executed remotely in the cloud.
2.1.1 System Model
In this subsection, we define the model we use for the chapter. We describe various parameters
of the tasks in terms of computation and network, from which we derive per task-based energy models.
2.1.1.1 Computation
Letfl represent the CPU frequency of the mobile device, andfc the CPU frequency of the data
center1. If the task runs in the data center, there’s an additional speedup ratio ofrdue to additional memory [45]. Consider a taskT that takescclock cycles to run, requiringτl = c/fl seconds to
execute locally. The time required to execute the task in the cloud isτc =τl·fl/(rfc). We assume the data center has a fixed number of machines, represented by the capacity,C, each can only run
one task at a time. We assume that tasks can be executed immediately after it arrives. In addition, the scheduling of tasks is non-preemptive, i.e. once the data center makes the commitment to
schedule a task, the execution of the task cannot be interrupted and resume later.
2.1.1.2 Network
The mobile network is intrinsically unpredictable and hard to model. We resort to a simple model where the mobile client knows the average bandwidth ofnbof its network. Assume that taskT has
a data size ofndbytes, then it takesτt=nd/nbseconds to transmit the data over to the data center.
1We use superscripts to denote the ”type” of a variable so that subscripts can be reserved for the numbering of
We assume that the data center has sufficient network bandwidth. Thus the offloading processes will not experience any bottleneck in data transmission.
2.1.1.3 Energy
We adopt a simple energy model where the mobile device operates in one of the three states:
computing state with powerPc, transmitting state with power Ptr, and idle state with powerPi
[45]. The energy for local execution isPcτl, the energy for transmission isPtrτt, and the energy
spent waiting for remote execution results isPiτw, whereτw ≥τcis the waiting time. Notice that the waiting time can be longer than the time of execution.
One interesting fact reported by the authors of [33] is that the benefit from offloading grows more than linearly as computation size increases. It is due to the fact that larger energy savings will
amortize the fixed ”start-up” cost of various components triggered by the code migrating process. For example, there are costs associated to power up the radio, to save program states, etc., which
are a roughly fixed cost and do not grow with program sizes. We accommodate this aspect in our model by adopting a fixed term in the calculation of migration energy cost.
Tasks will be in one of the three states: successfully offloaded and executed in the cloud,
offloaded yet not scheduled due to resource limits, and locally executed (without being offloaded). We denote the states by remote, offloaded, and local, respectively. The energy savings
∆Eof different states are:
∆E = El−Ec ifremote −Ec ifoffloaded 0 iflocal (2.1) 2.1.1.4 Task
The final task model is listed in Table 2.1. We choose to consolidate the task parameters into a simpler abstraction consisting of two categories, time and energy. The table also shows how the
Parameter Explanation Derivation
τl Local exec. time c/fl
τc Cloud exec. time τlfl/(rfc)
τt Transmission time nd/nb
El Local exec. energy Pcτl
Ec Offload energy overhead Ptrτt+Piτw
tr Release time
td Deadline
Table 2.1: Code offloading task parameters
section) are generated with reference to real-life models. Notice that for convenience we define
tr to be the time when tasks can start execution in the cloud. The actual offload decision is made
earlier. We further define a few variables that are useful in our algorithms and discussion. Benefit,
b refers to the efficiency of energy saving of a task, i.e. b = ∆E0/τc. Since∆E is not known in
advance, we use the estimated energy savings,∆E0 =El−Ec. Slack defined bytd−tr −τc, is
the period that a task can afford to wait before its deadline is reached. We test our model in the
simulation and it shows accordance with experimental results from the offloading frameworks [33] [34].
In building the system model, we carefully seek a balance between simplicity and fidelity
of the model. The scheduling problem lies on an extremely simple abstraction, where only a single type of resources is studied. On the other hand, the model for data center often involves
sophisticated modeling of CPU, memory, I/O, network, etc. [46]. To resolve the conflict, we rely on the following observations. First, tasks in offloading are more computation intensive than
data-intensive, as demonstrated in the typical applications like a chess game, face recognition, etc [32]. Given the limited network bandwidth of cellular networks and energy constraints, only a relatively
small amount of data can be offloaded (as compared to generic cloud applications). Thus CPU is more likely to be the single bottleneck in resource allocation. Second, task execution is not
distributed among multiple machines. Researchers have shown that parallel execution does not improve the performance linearly with an increasing number of machines used [34]. Thus we
assume tasks will be running only in a single container (physical machine or VM, denoted by
machinefor the rest of the chapter). Thus unlike the situation for modeling MapReduce tasks, the
I/O bandwidth of machines in our case is not of much concern. Those observations justify our approach to attribute execution time cost only to computation and using the abstraction that each
task runs on a single machine.
2.1.2 Generating System Parameters
Since no offloading systems exist in full production, there is currently limited available real usage data. We can only assume the similarity between some aspects of existing systems that target
mo-bile computing systems and the offloading scenario. The answer to the following three questions are of particular importance to our study:
1. what is the distribution of computation resource usage of offloading tasks;
2. how can we characterize the arrival of requests;
3. how the usage is distributed among users.
To answer the first question, we examined the traces of Google computing clusters [47], with the assumption that the distribution of computational resource usage of tasks in the generic cloud
computing environment is similar to that in the mobile cloud computing environment. To answer the second question, we use the cellular network access traces of a cellular network provider in
the US, with the assumption that the network access data reflects the behavior of mobile users, especially in terms of usage as a function of time. We found that the CPU usage follows a power law distribution while the disk usage follows a log-normal distribution. The generation of the rest
of the parameters is described in Section 2.3.1.1. To answer the third question, which is critical for the study of fairness, we use mobile network usage data. The network usage reflects different
users’ frequency and habits of using mobile internet. We assume that it bears a similarity with the frequency of offloading with different users.
2.1.2.1 Distribution of CPU and Data Size
The Google cluster traces provide a month-long workloads traces of 12,000 machines. Researchers
have studied the characteristic traces [48] and some even proposed ways to synthesize data center workload based on these traces [49]. In our project, we are only interested in the high-level
dis-tribution of task sizes. Typically the tasks we use are MapReduce type tasks. We aggregated the CPU usage overall jobs that belong to one task to obtain per-task total CPU usage. The distribution
of CPU usage is shown in Figure 2.2(a). The linearity in the logarithmic scale implies that distri-bution follows a power law distridistri-bution. The distridistri-bution of disk usage as a function of CPU usage
is shown in Figure 2.2(b). Figure 2.2(c) extracts tasks with CPU usage in a small range and plot their disk usage. We observe that the distribution of disk usage is log-normal to the corresponding CPU usage of the task.
Along with the observation, we generate the number of CPU cyclescfrom a power-law distri-bution, and data sizendin a corresponding log-normal distribution.
2.1.2.2 Arrival Model
Workload prediction of data centers has been a difficult research problem. In this chapter, we hold
the assumption that the workload of offloading bears similarity with that of mobile phone users visiting the Internet. We believe the variance and unpredictability of the offloading workload can
be characterized by the fluctuation of cellular network record.
It’s long been shown that Internet traffic is ”bursty” at all time scales or self-similar [50]. Recently, Han et al. also showed that the requests arrival process in the cloud is self-similar
[40]. Self-similarity is characterized by a series X having the same correlation function with its ”aggregated” versionX(m). The aggregated series is defined by the following equation
X(m)(t) = 1 m tm X i=(t−1)m+1 X(i)
The autocorrelation function over the series, r(k) = E((X(t)−µ)(X(t+k)−µ))/σ2, exhibits a power law decay over a long range: r(k)k−β ask → ∞. This is calledlong-range dependence.
10
010
110
210
3Total CPU Usage / cores
·second
10
-410
-310
-210
-1Percentage of Tasks
(a)10
310
710
11CPU Usage / cores
·second
10
-710
-410
-110
2Disk Usage / percentage
(b)
1e-06 0.0001 0.01
1.0
Disk Usage / percentage
0.00
0.02
0.04
0.06
0.08
0.10
Percentage of Tasks
(c)Figure 2.2: Characteristics of Google cluster traces: (a) shows the distribution of CPU usage; (b) shows the distribution of disk usage against the distribution of CPU usage; (c) shows distribution
Figure 2.3: Sample of cellular network usage traces
also used as an indicator of the degree of self-independence. Basically, self-similarity implies the fact that bursts and spikes on the second’s scale also exist in tens of seconds or minutes scale. Thus
such an arrival process is intrinsically hard to predict.
Self-similarity alone is not enough for the arrival model. In addition to burstiness, traffic also
contains a cyclic element that characterizes the change in people’s activities. Many researchers have observed workloads daily, weekly, and seasonal cyclic patterns in data center [37] [39].
We conclude that it is both easier and more convincing to use realistic traces. We thereby turn
to real life traces of cellular network, which contains both cyclic and bursty behavior, as shown in Figure 2.3. Notice usage in the sample is measured in sessions, which is defined as a period
of semi-continuous network activity of a single user over a span of time. To utilize the traces, we define our model in discrete time slots (e.g. 10 seconds). The number of tasks that arrive at a
particular time slot will be scaled from the number of sessions in the corresponding time slot in the traces.
2.1.2.3 Distribution of Usage
Figure 2.4 shows the distribution of network traffic of different users in bytes. Both axes are in log
10
010
110
210
310
4Total Bytes of Network Traffic
10
-410
-310
-210
-110
0Percentage of Users
Figure 2.4: Distribution of network traffic of users
2.1.3 Problem Formulation
Now that the system model has been described, we proceed to formulate our problem. Define
Dl
i(t) ∈ {1,0} to be the local decision on whether taskTi is offloaded to the cloud at time slot t, andDc
i(t)to be whether the data center executesTi at time slott. Under data center resources
constraints, some of the tasks may be offloaded and others may not be. Among the offloaded tasks,
only part of them may be executed in the cloud. The energy savings ofTi,∆Ei, will then be either
of the three cases described in Section 2.1.1.3 depending on whether the task is offloaded and whether it is executed in the data center. Our goal is to find an online localized decision process
forDli(t)andDci(t)such that the overall energy savingsP
i∆Ei is near-maximal.
2.2
Method
To solve the optimization problem, we first examine it in an offline environment. We formulated our problem as a scheduling problem and showed upper bounds of the solution to the problem.
We then proposed a probabilistic algorithm that is able to achieve near-optimal results. The infor-mation from offline scheduling is extracted by classification, where features are selected through regularization. We introduce the classification to local mobile clients, which enable them to make
introduced in this section. An overview of the algorithms we used is listed in Table 2.2.
2.2.1 Offline Scheduling
The offline phase aims at finding a near-optimal solution to the assignment of tasks, by assuming centralized control and the knowledge of all the tasks. Despite the complicated models and
proce-dures, the core task of the offline phase is equivalent of the following: we want to decide which tasks to be scheduled locally and which in the cloud, such that the energy is maximized. Thus
offline problem can be simplified to a scheduling problem described in the following sections. The solution of the scheduling problem represents an ideal state of the execution of all the tasks. The
tasks should all be in statelocalor stateremote, and it should not matter whatDl
i(t)andDic(t)
is as long as there’s one final conclusion for each task on whether and when it’s executed in the
data center, denoted by Di(t). For simplicity, we also ignore the cost of waiting. It remains an
open question on how to solve the scheduling problem when the weight is varying.
Offline Alg. Summary
Upper bound Relax the problem to a linear program and obtain an optimal solution
Baseline: deadline Schedule the task with earlies deadline first
Baseline: greedy Schedule the task with highest benefit (of all tasks) first
Probabilistic The proposed approximation algorithm
Online Alg. Summary
Baseline: FCFS The First-Come-First-Serve scheduling
Baseline: greedy Schedule tasks with highest benefit (in the queue) first
Proportional fair Schedule the user with the highest task benefit divided cumulative energy savings
2.2.1.1 The Scheduling Problem
Scheduling problems have been exhaustively studied in the past. According to the survey [51], our
problem falls in the category of minimizing the number of weighted tardy jobs,P||P
wU. In the
problem representation,P stands foridentical parallel machines, where the number of machines
corresponds to data center resourcesC in our model;wstands for theweight, which corresponds to the energy savings∆E ;U stands for theunit penalty, whereU = 1if the task is not scheduled
within deadline (referred to as tardy job), and 0 otherwise. By minimizing the energy savings ”lost” with unscheduled tasks, i.e. P
wU, it is effectively achieving our goal to maximize energy
savings of scheduled tasks.
The aforementioned scheduling problem is NP-hard [51]. There exists a dynamic programming based pseudo polynomial solution [52] [53], but it takesO(mn(maxj{dj})m to solve, wherenis
the number of tasks, dj is the deadline and m is the number of machines [51]. It is apparently
not feasible to obtain the optimal results even in the offline settings. Bar-Noy et al. proposed an
approximation algorithm using relaxation from a linear programming upper bound [54]. Yet the linear programming problem is time-consuming to solve. Therefore, we propose a polynomial
near-optimal algorithm to tackle the problem.
2.2.1.2 Bounds and Baselines
Bar-Noy et al. provided an non-preemptive upper bound which was claimed to be the best possible upper bound achievable [54]. Yet in our problem, their approach proved too time-consuming.
We thus provide a running-time optimized linear programming (LP) based upper bound. The LP relaxes the problem by a) allowing preemptive scheduling; and b) allowing a fraction of a task to
be scheduled in such time slots. For any task, the sum of the fractions should be no more than the original execution time. At any time slot, the sum of all fractions should not exceed the number of
machines. We thereby definexitto be the fraction for each taskTiat each time slott. Note thatxit
maximize xit N X i=1 td i−1 X t=tr i bi·xit subject to td i−1 X t=tr i xit ≤τic, for eachi N X i=0 xit≤C, for eacht 0≤xit≤1
We compare the two upper bounds in Table 2.5.
We use two baseline algorithms: schedule by the earliest deadline and a greedy algorithm. The earliest deadline algorithm is proved to be optimal in unweighted scheduling problems. The greedy
algorithm schedules orders tasks according to their benefitband schedules each task at the earliest time slot available. The results of algorithm performance are shown in Table 2.7.
2.2.1.3 The Probabilistic Approach
The proposed offline algorithm builds upon the greedy algorithm, which seeks to schedule as many high benefit tasks as possible, but it takes a step further by first “shifting” the tasks to the less congested area so as to schedule as many tasks as possible. The difficulty encountered when
shifting a task, however, is that we have to consider the probability of another task being shifted to the same slot later. We thus come up with the method of shifting based on a probabilistic
profile, where each task has a probability to be in all the time slots available to it. With the probabilistic profile, we can achieve the goal of reducing congestion by shifting each task just
once, thus achieving linear complexity.
Now we define our approach in more details. Let nbe the number of possible schedules for a
taskT, wheren = td−tr−τc+ 1, thus each schedule takes probability1/n. The probability of
the task at a particular time slot is the sum of the probabilities of all the schedules that cover that
Pr(t) 𝟏 𝟒 𝟐 𝟒 𝟑 𝟒 𝟑 𝟒 𝟐 𝟒 𝟏 𝟒 0 t 0 1 2 3 4 5 6 Pr(t) 𝟏 𝟑 𝟐 𝟑 𝟑 𝟑 𝟑 𝟑 𝟐 𝟑 𝟏 𝟑 0 t 0 1 2 3 4 5 6 Task 3 Po ss ib le S ch ed u les
Figure 2.5: The probabilistic distribution of two example offloading tasks
andtd= 6, whileτcequals 3 and 4 respectively. Consider the first task, where one schedule covers
slot 0, thus yielding a probability of 1/4; two schedules cover slot 2, thus yielding a probability of
2/4, etc. Lettt= min(tr+τc−1, td−τc). The probability can be defined by Equation 2.2.
Pr(t) = t−tr+1 n ift r ≤t < tt min(n,τc) n ift t ≤t < td−τc td−t n ift d−τc≤t < td 0 otherwise (2.2)
Algorithm 1 describes the procedure of probabilistic shifting. The algorithm iteratively finds the least congested slot and shifts a task in the slot to a position with the minimum average
proba-bilistic congestion. With boundedtd
i −tdr, the algorithm execute inO(N)time. After the shifting,
we then apply the greedy scheduling algorithm to obtain the final offline results. Figure 2.6 shows a demo of our algorithm. In the figure, the load at the middle congested region is successfully
shifted to the side.
2.2.2 Classification
In the classification phase, we train local offload decisionDil(t)based on the offline solutionDi(t).
0
100
200
300
400
500
600
Time
0.40
0.45
0.50
0.55
0.60
0.65
0.70
0.75
Normalized probabilistic congestion
Before
After
Figure 2.6: Demonstration of the probabilistic scheduling algorithm
Algorithm 1Probabilistic Shifting Algorithm
1: pc(t)←probabilistic congestion at time slott 2: whilenot alltmarked exploreddo
3: tmin ←argmin t
pc(t)
4: T={Ti|tri ≤tmin < tdi, Ti is not explored}
5: ifT==∅then
6: marktminas explored
7: else 8: selectTi ∈T 9: removeTi frompc 10: tri0 ←argmin tri0 1 td i−t r0 i td i P t=tr0 i pc(t) +τc i ·1 ! 11: markTias explored 12: updatepc(t)wheret∈[tr0 i , tdi) 13: end if 14: end while
offloading inefficient tasks that are unlikely to be scheduled by the data center. In short, if a similar
2.2.2.1 Selecting Classifier
We use L1 regularized Logistic Regression classifier for classification. The reason for choosing
logistic regression are as follows. First, we favor classifiers that are simple in terms of represen-tation. We envision that in an actual system, the data center will occasionally (e.g. every month)
update parameters sets wof the model. It is beneficial for the update to contain as little data as possible, and thus our requirement to use classifiers that are ”lightweight”. Thereby we rule out
instance-based approaches. Second, the regression model fits more conceptually with the prob-lem. The underlying relationships between features are continuous, and that no causal relationship
exists between any of the features. Thus we do not consider the choice of rule-based or Bayesian approaches. We thus choose logistic regression, which is a viable and simple method.
2.2.2.2 Selecting Features
Table 2.3 shows the list of features and the performance with different strengths of regularization
(λ). The+/−are the sign of the parameters of selected features. The feature that is most relevant to the offloading decision isbenef it, which essentially represents the energy efficiency of the task.
Following it is slack, another positively weighted feature which represents the flexibility of the task. If a task has high flexibility, it can wait longer in the queue and thus have a higher chance to arrive at a situation where the rest of the tasks in the queue are not as competitive as it is. The
rest of the features are relevant but are not independent of each other, and thus the information they provide is redundant. We confirm in our experiment that adding more features do not improve
performance significantly. Our final choice for regularization strength isλ2, which selects benefit
and slack as features.
2.2.2.3 Training
The training set is the offline solution{(xi, Di(t)), i= 1, . . . , n}, where each taskTihas a feature
vectorxi, and class label (1: scheduled , 0: not scheduled). The logistic regression model estimates
the probability ofPr(D = 1|X = x) = 1/(1 +exp(−wTx)), where wrefers to the parameters