Rehabilitation Research and Training Center
on Disability Demographics and Statistics
DISABILITY STATISTICS USER GUIDE SERIES
A Guide to Disability Statistics
from the 2000 Decennial Census
William A. Erickson
Andrew J. Houtenville
Cornell University
For additional information about this paper contact: Andrew Houtenville, Director
Rehabilitation Research and Training Center on Disability Demographics and Statistics Employment and Disability Institute 303 ILR Extension Building
Cornell University Ithaca, NY 14853 (607) 255-5702 (Phone) (607) 255-2763 (Fax)
This paper is being distributed by the Rehabilitation Research and Training Center on Disability Demographics and Statistics at Cornell University.
This center is funded to Cornell University by the U.S. Department of Education, National Institute on Disability and Rehabilitation Research (No. H133B031111). The contents of this paper do not necessarily represent the policy of the Department of Education, and you should not assume endorsement by the Federal Government (Edgar, 75.620 (b)).
The Co-Principal Investigators are:
Susanne M. Bruyère—Director, Employment and Disability Institute, School of Industrial and Labor Relations, Extension Division, Cornell University
Richard V. Burkhauser—Sarah Gibson Blanding Professor and Chair, Department of Policy Analysis and Management, College of Human Ecology, Cornell University
Andrew J. Houtenville—Senior Research Associate, Employment and Disability
Institute, School of Industrial and Labor Relations Extension Division, Cornell University
David C. Stapleton—Director, Cornell University Institute for Policy Research
TABLE OF CONTENTS
Introduction... 2
Conceptual Model of Disability... 3
Operational Issues... 5
Census 2000 Background, Survey Methods, and Data Collection ... 6
Purpose... 6
Content... 6
Coverage: Universe and Sample Design... 7
Data Collection ... 10
Data Processing... 12
Accessing of Data and Statistics ... 13
Definition of Disability and Other Variables... 16
Statistics from the Census 2000... 24
Advantages of the Census 2000... 26
Comparisons to Other Data Sources ... 29
Summary and Conclusions ... 32
References... 34
Tables... 36
Appendix A: Sample Design and Computation of Standard Errors ... 54
Sample Design. ... 54
Census 2000 Public Use Microdata Sample (PUMS)... 55
Sampling and Non-Sampling Error. ... 55
Population Estimates... 57
Appendix B: Census Online Resources ... 59
Introduction
The mission of the Cornell StatsRRTC is to bridge the divide between the sources of disability data and the users of disability statistics. One product of this effort is a set of User Guides to national survey data that collect information on the disability population. The purpose of each User Guide is to provide:
1. an easily accessible guide to the disability information available in the nationally representative survey;
2. a description of the unique features of the survey;
3. a set of estimates on persons with disabilities from the survey, including estimates on the size of the population, the prevalence rate, the employment rate and measures of economic well-being;
4. a set of estimates that highlight the unique features of the survey; and
5. a description of how estimates from the survey compare to other national surveys that are used to describe the population with disabilities.
This User Guide addresses disability data available in the 2000 Decennial Census. A decennial census of the United States is conducted every ten years to provide statistics at the national, state, and local levels. The short form of the decennial census collects basic demographic data from five out of six households, and the long form collects the same basic demographic data, plus social and economic data from the remaining one in six households. Data are also collected from group quarters (GQ), which include individuals living in
institutions, a population that is rarely included in surveys. The primary purpose of the demographic data is to draw Congressional districts. The social and economic data from the long form is especially valuable because it provides social and economic statistics for small geographic areas (such as counties, towns, and Congressional districts) that are estimated in a uniform manner across the United States.
The Census 2000 long form included six questions that are used to identify the population with disabilities. These data can be extremely useful to disability policymakers, disability
service providers, and the disability advocacy community. This User Guide discusses the variety of information on disability, demographic characteristics, employment, and economic well-being available from Census 2000 long form data.
Census 2000 has several important limitations that should be noted. First, the survey is limited to six disability questions and it does not allow one to identify the prevalence of specific health conditions (e.g., cancer, paralysis, HIV/AIDS, etc.). Second, as is described in more detail later, two of the six disability type questions (go-outside the home and employment disability) contain an error that leads to an over estimation of the population with these two disabilities as well as the overall population with disabilities (i.e., the enumerator/response error issue). Third, as with all of the major national surveys, the Census 2000 disability definition does not directly address external factors that may contribute to a disability such as
discrimination and lack of reasonable accommodations. Fourth, although the Census 2000 does include information on the Group Quarters (GQ) and institutionalized population, the PUMS data only identify institutionalized and non-institutionalized GQs with no finer discrimination possible. This may limit the PUMS usefulness for questions regarding this population.
Conceptual Model of Disability
One purpose of the User Guides is to describe the information on disability available in the various national surveys; as a result we need an operational definition of disability. Unlike age and gender, which are for the most part readily identifiable individual attributes, disability is usually defined as a complex interaction between a person’s health condition and the social and physical environment. The environment influences how a person’s health condition performs various activities.
The two major conceptual models of disability are the World Health Organization’s (WHO, 2001) International Classification of Functioning, Disability and Health (ICF) and the disability model developed by Saad Nagi (1965, 1979). Both of these conceptual models recognize disability as a dynamic process that involves the interaction of a person’s health condition and personal characteristics with the physical and social environments. Changes to any one of these factors over time can have an impact on a person’s ability to function and participate in activities. A detailed description of these models, as well as a comparison of these models, is available in Jette and Badley (2000).
We use ICF concepts to create operational definitions of disability. The concepts used include impairment, activity limitation,participation restriction, and disability (see WHO, 2001). A prerequisite to each of these concepts is the presence of a health condition. Examples
of health conditions are listed in the International Classification of Diseases, Tenth Edition (ICD-10) and they encompass diseases, injuries, health disorders, and other health related conditions. An impairment is defined as a significant deviation or loss in body function or structure. For example, the loss of a limb or vision loss may be classified as impairment. In some surveys, impairments are defined as long-lasting health conditions that limit a person’s ability to see or hear, limit a person’s basic physical movement, or limit a person’s mental capabilities.
An activity limitation is defined as a difficulty an individual may have in executing activities. For example, a person who experiences difficulty dressing, bathing or performing other activities of daily living due to a health condition may be classified as having an activity limitation. In some surveys, activity limitations are identified based upon a standard set of activities of daily living questions (ADLs).
A participation restriction is defined as a problem that an individual may experience in involvement in life situations. For example, a working-age person with a health condition may have difficulty participating in employment as a result of the physical environment (e.g., lack of reasonable employer accommodations) and/or the social environment (e.g., discrimination). In some surveys, participation restrictions are identified by questions that ask whether the person has a long-lasting health condition that limits his or her ability to work, or whether a health condition affects his or her ability to go outside the home to go shopping, to church or to the doctor’s office.
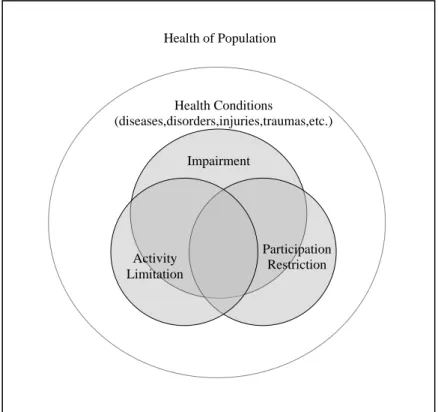
In the ICF the term disability describes the presence of an impairment, an activity limitation and/or a participation restriction. While these concepts may seem to follow a progression—that is, an impairment leading to an activity limitation leading to a participation restriction—this is not necessarily the case. Figure 1 provides a useful summary of the ICF concepts. It is possible that a person may have a participation restriction without an activity limitation or impairment. For example, a person diagnosed as HIV positive may not have an evident impairment or activity limitation, but may not be able to find employment due to discrimination resulting from his or her health condition. Similarly, a person with a history of mental illness, but who no longer has a loss in capacity or activity limitation, may also be unable to finding employment due to discrimination resulting from his health condition.
Figure 1 illustrates that while there is an overlap across these concepts, it is possible that one of them can occur without a relation to the others. The universe of the ICF is health
conditions as a whole. Disability is the union of impairment, an activity limitation, and/or participation restrictions.
Figure 1. Simplified Conceptual Model of Disability Using ICF Concepts
Health Conditions (diseases,disorders,injuries,traumas,etc.) Participation Restriction Activity Limitation Impairment Health of Population Operational Issues
Translating the ICF concepts into operational definitions in surveys and mapping existing survey questions to ICF concepts are not straightforward tasks. In the User Guides, decisions to classify the questions into one of the three specific ICF categories were made based upon
judgments because well-defined rules for doing so are not available in the ICF. In some cases, the classification is straightforward. In other cases, for example, the survey questions may be interpreted as both an activity limitation and participation restriction. Our approach in these cases was to make clear and consistent judgments so that it may be possible to make
comparisons across data sources. Using this approach provides a framework for comparisons across surveys and for comparisons to ICF concepts.
Census 2000 Background, Survey Methods, and Data Collection
The survey methodology can have an important impact on the information that a survey collects on the population with disabilities. Mathiowetz (1998) provides a good review of the general methodological issues as well as those specific to the population with disabilities. The purpose of this section is to describe the development of the Census 2000, the methods used by the Census 2000 to collect information on the population, and the definitions used to describe the population with disabilities.
Purpose
Census 2000 results are used in a wide variety of ways. Census data are used to allocate seats in the House of Representatives among the states. Census data also provide a snapshot of the social and economic characteristics of the nation for government officials, educators,
business owners, and others. Information on disability is used by a number of federal agencies to distribute funds and develop programs for people with disabilities and the elderly. Federal agencies that use the disability information include the Departments of Education, Labor, Justice, Transportation, Housing and Urban Development, Health and Human Services, Social Security Administration, and the EPA.
Content
Two different questionnaire forms for housing units were used in the Census 2000. The “short form questionnaire” included seven questions for each household: name, sex, age, relationship, Hispanic origin, race, and whether the housing unit was owned or rented. In
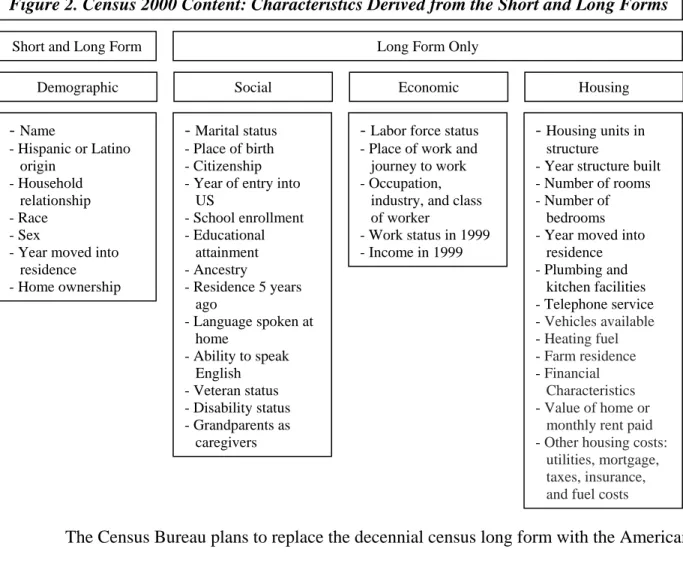
addition to these seven questions, about 17 percent (one in six) of households received the “long form questionnaire” that included questions about ancestry, income, mortgages, size of the housing unit, as well as disability and other areas. See Figure 2 for the content areas covered by the Census 2000 short and long forms.
Figure 2. Census 2000 Content: Characteristics Derived from the Short and Long Forms - Name - Hispanic or Latino origin - Household relationship - Race - Sex
- Year moved into residence - Home ownership
- Marital status - Place of birth - Citizenship - Year of entry into
US - School enrollment - Educational attainment - Ancestry - Residence 5 years ago - Language spoken at home - Ability to speak English - Veteran status - Disability status - Grandparents as caregivers
- Labor force status - Place of work and journey to work - Occupation,
industry, and class of worker
- Work status in 1999 - Income in 1999
- Housing units in structure
- Year structure built - Number of rooms - Number of
bedrooms - Year moved into
residence - Plumbing and kitchen facilities - Telephone service - Vehicles available - Heating fuel - Farm residence - Financial Characteristics - Value of home or
monthly rent paid - Other housing costs:
utilities, mortgage, taxes, insurance, and fuel costs
Demographic Social Economic Housing
Short and Long Form Long Form Only
The Census Bureau plans to replace the decennial census long form with the American Community Survey (ACS). Copies of the actual Census 2000 forms are available for
downloading at this Census location: http://www.census.gov/dmd/www/2000quest.html. For more information on the American Community Survey see the “Guide to Disability Statistics from the American Community Survey,” available at:
http://digitalcommons.ilr.cornell.edu/edicollect/123/ Coverage: Universe and Sample Design
The Census 2000 was designed to collect data from 100 percent of all households as well as those located in non-traditional housing units including group quarters. Unique procedures were put in place to include those living in non-traditional housing units such as homeless shelters. The Census 2000 plan implemented special procedures to measure and correct overall and differential coverage of U.S. residents. Information on the sampling and procedures used is provided in Appendix A. Further information on Census 2000 data collection and processing
procedures is available in Appendix C of the following Census Bureau PUMS technical document: 2000 Census of Population and Housing, Public Use Microdata Sample: http://www.census.gov/prod/cen2000/doc/pums.pdf .
The 2000 Census was taken April 1, 2000 and resulted in a count of 281,421,906 people residing in 115.9 million housing units in the 50 states and the District of Columbia. There were an additional 7,825,407 people in 192,286 Group Quarters, and 258,728 people in 14,817 service based enumeration locations (shelters, soup kitchens, targeted non-sheltered locations). Census 2000 data were also collected in Puerto Rico and the U.S. Island regions (including Guam, U.S. Virgin Islands, American Samoa, and the Commonwealth of the Northern Mariana Islands).
Households and Housing Units. The Census Bureau defines a housing unit as “a house, an apartment, a mobile home or trailer, a group of rooms, or a single room occupied as separate living quarters, or if vacant, intended for occupancy as separate living quarters. Separate living quarters are those in which the occupants live separately from any other individuals in the building and which have direct access from outside the building or through a common hall. For vacant units, the criteria of separateness and direct access are applied to the intended occupants whenever possible.” (Census American Factfinder Glossary
http://factfinder.census.gov/home/en/epss/glossary_h.html )
Non-Traditional Housing Units. Non-traditional housing units include group quarters (i.e. prisons, college dormitories, nursing homes) people living in migrant farm worker camps, on boats, on military installations; and federal employees living overseas. Other special non-housing unit populations included highly transient persons such as those living at recreational vehicle campgrounds and parks, commercial or public campgrounds, marinas, and workers’ quarters at fairs and carnivals. Persons with no usual residence (i.e. shelters and soup kitchens, and at targeted outdoor locations) fell under the “service based enumeration operation.”
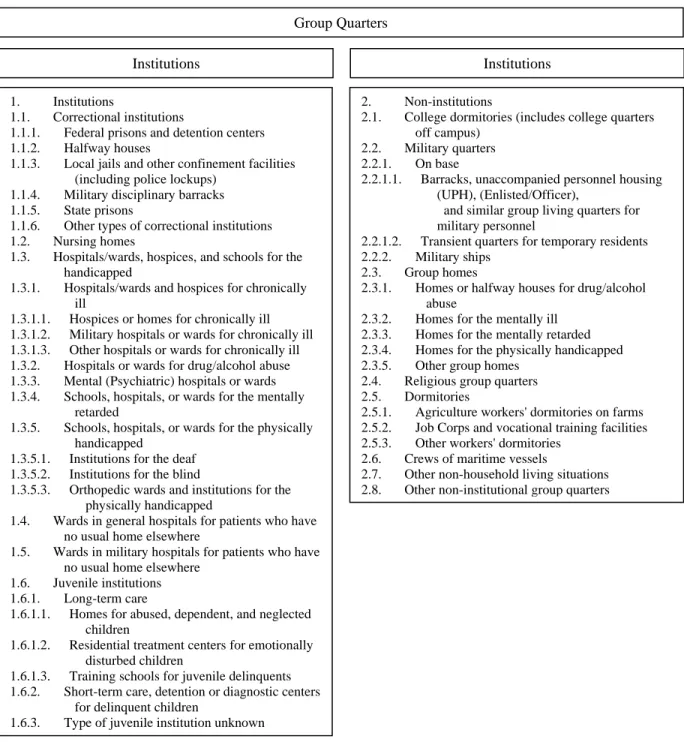
Group Quarters (and Institutions). The Census Bureau recognizes two general categories of people in group quarters: (1) institutionalized population and (2) non-institutionalized
population. (Figure 3 lists the types of abodes that are considered group quarters and which of these are considered institutions and non-institutions.) The institutionalized population includes people under formally authorized supervised care or custody in institutions at the time of
enumeration. Such people are classified as "patients or inmates" of an institution regardless of the availability of nursing or medical care, the length of stay, or the number of people in the
institution. Generally, the institutionalized population is restricted to the institutional buildings and grounds (or must have passes or escorts to leave) and thus has limited interaction with the surrounding community. Also, this population is generally under the care of trained staff that has responsibility for patients’ safekeeping and supervision. The non-institutionalized
population includes all people who live in group quarters other than institutions, such as dormitories, halfway houses, and communes.
Institutions Institutions
Group Quarters
Figure 3. Group Quarters: Institutions and Non-Institutions
2. Non-institutions
2.1. College dormitories (includes college quarters off campus)
2.2. Military quarters 2.2.1. On base
2.2.1.1. Barracks, unaccompanied personnel housing (UPH), (Enlisted/Officer),
and similar group living quarters for military personnel
2.2.1.2. Transient quarters for temporary residents 2.2.2. Military ships
2.3. Group homes
2.3.1. Homes or halfway houses for drug/alcohol abuse
2.3.2. Homes for the mentally ill 2.3.3. Homes for the mentally retarded 2.3.4. Homes for the physically handicapped 2.3.5. Other group homes
2.4. Religious group quarters 2.5. Dormitories
2.5.1. Agriculture workers' dormitories on farms 2.5.2. Job Corps and vocational training facilities 2.5.3. Other workers' dormitories
2.6. Crews of maritime vessels
2.7. Other non-household living situations 2.8. Other non-institutional group quarters 1. Institutions
1.1. Correctional institutions
1.1.1. Federal prisons and detention centers 1.1.2. Halfway houses
1.1.3. Local jails and other confinement facilities (including police lockups)
1.1.4. Military disciplinary barracks 1.1.5. State prisons
1.1.6. Other types of correctional institutions 1.2. Nursing homes
1.3. Hospitals/wards, hospices, and schools for the handicapped
1.3.1. Hospitals/wards and hospices for chronically ill
1.3.1.1. Hospices or homes for chronically ill 1.3.1.2. Military hospitals or wards for chronically ill 1.3.1.3. Other hospitals or wards for chronically ill 1.3.2. Hospitals or wards for drug/alcohol abuse 1.3.3. Mental (Psychiatric) hospitals or wards 1.3.4. Schools, hospitals, or wards for the mentally
retarded
1.3.5. Schools, hospitals, or wards for the physically handicapped
1.3.5.1. Institutions for the deaf 1.3.5.2. Institutions for the blind
1.3.5.3. Orthopedic wards and institutions for the physically handicapped
1.4. Wards in general hospitals for patients who have no usual home elsewhere
1.5. Wards in military hospitals for patients who have no usual home elsewhere
1.6. Juvenile institutions 1.6.1. Long-term care
1.6.1.1. Homes for abused, dependent, and neglected children
1.6.1.2. Residential treatment centers for emotionally disturbed children
1.6.1.3. Training schools for juvenile delinquents 1.6.2. Short-term care, detention or diagnostic centers
for delinquent children
Data Collection
Developing Address Lists. The Decennial Census data collection is a massive effort, employing nearly a half million temporary employees at its peak. Beginning soon after the 1990 Decennial Census the Census Bureau began to develop an accurate address list (the Master Address File or MAF), based on the 1990 Census, for all housing units in the country. The Census Bureau worked closely with local government officials and the U.S. post offices to identify, validate and update housing unit addresses. Block canvassing designed to identify newly-constructed housing units was performed just prior to Census day, April 1, 2000. More than 30,000 Census Bureau enumerators (i.e., interviewers) were sent out to canvas streets and roads to gather information on approximately 22 million residences without a street address to add to the Bureau’s mapping system called Topologically Integrated Geographic Encoding and Referencing (TIGER maps).
A separate operation was performed to develop an inventory of all facilities that were group quarters and non-traditional housing. A Census enumerator interviewed an official at each location using a Facility Questionnaire. The information collected in this questionnaire was used to identify the location of each group quarters, classify the type of facility, and the potential number of housing units and/or residents at that location.1 The Census Bureau then determined whether the facility would be part of the standard enumeration or be included as part of the “special place” enumeration, adding the group quarters and housing units address to the Master Address File.
Census 2000 Dress Rehearsal. A data collection “dress rehearsal” was performed in 1998 in three locations to test out the proposed data collection activities for the actual Census 2000 collection. The dress rehearsal was performed in three locations and involved more than 40 individual evaluation studies to determine the effectiveness of the proposed processes for the actual Census 2000. (http://www.census.gov/census2000/evaluations/pdf/finalrep.pdf)
Marketing. An extensive marketing campaign was performed prior to the questionnaire distribution including print, broadcast and outdoor advertising to encourage participation in the Census. An advance letter was sent out to inform the public of the importance of completing the Census forms. It also gave households the option to request, using a prepaid envelope, the
1 For more information regarding this effort go to www.census.gov/pred/www/rpts/E.1.b.pdf andhttp://www.census.gov/pred/www/rpts/TR5.pdf.
Census short and long form in one of five other languages including Spanish, Tagalog, Chinese, and Korean. Census received 2.2 million requests for one of these forms with nearly 90 percent requesting the Spanish version.
Data Collection for Households. The U.S. Post office delivered census questionnaires based on the compiled address database, which included more than 80 percent of all households. This mailout/mailback procedure included most housing that had a city type address (house number and street) and was followed by a “Be Counted” reminder post card on Census Day. Census workers hand delivered questionnaires to the majority of the remaining housing units, (those with PO Box or Rural Route addresses) updating the address for the area in the process. This “update/leave” operation accounted for 18.8 percent of the total housing units. In both of the above scenarios the household was asked to mail the completed survey back. In the
remaining remote/sparsely settled areas (such as parts of Alaska) Census workers (enumerators) collected data directly through interviews. There was an additional attempt to include
undercounted persons who might have been left off of the Census roles. The “Be Counted” operation made Census forms available at public locations such as Census Walk-In
Questionnaire Assistance Centers. About 800,000 “Be Counted” forms were received, adding approximately 250,000 persons not included in other Census forms after duplicates were removed (http://www.census.gov/pred/www/rpts/A.3.pdf).
Mail return rates varied by state with a final national mail back response rate of 67 percent. A small proportion, approximately 63 thousand households, took advantage of the un-advertised internet based short form (http://www.census.gov/pred/www/rpts/A.2.b.pdf). This left approximately 42 million addresses that had not returned a questionnaire to the Census Bureau as of the April 18, 2000 cutoff date. A Non-Response Follow Up (NRFU) operation was designed to enumerate these remaining housing units. The NFRU operation began on April 27, 2000 and was completed in most areas by June 26, 2000 with 78 percent being short forms and the
remaining 22 percent long forms. Temporary Census workers visited all non-responding
housing units and attempted to collect the data in person from the occupants. Approximately 62 percent of the NFRU housing units were found to be occupied and were successfully
interviewed, 23 percent were vacant, 14 percent resulted in deleted addresses and slightly over 5,000 were unresolved (0.0 percent). A Quality Assurance program was performed on the
NRFU operation including a review of all enumerated questionnaires by the Enumerator Crew Leaders, and a re-interview of a sample of the households each enumerator surveyed.
Data Collection for Group Quarters. Data collection for group quarters was conducted April 1, 2000 through May 6, 2000. Several new questionnaires were created as the household questions in the household unit forms were not appropriate for places housing large groups of unrelated people. The four main forms used were (1) Individual Census Report (ICR) used for the vast majority of group quarters, (2) Individual Census Questionnaire (ICQ) used only for soup kitchens and regularly scheduled mobile food vans, (3) Military Census Report (MCR), used to enumerate military personnel, and (4) Shipboard Census Report (SCR) used to enumerate military and civilian shipboard residents.(These forms can be viewed at
http://www.census.gov/dmd/www/2000quest.html).
At each group quarters enumerators acquired a list of residents, completed a listing sheet and distributed ICR packets to residents. Enumerators were allowed to use administrative records to augment the process where residents could not complete the forms themselves.
Enumerator questionnaires were used for residents of household units at the special place. Some group quarters were allowed to self enumerate for the safety of the enumerator or confidentiality of the residents. This occurred primarily at hospitals and prisons.
Data Collection for Service Based Enumeration Locations. Data collection for these location types occurred between March 27, 2000 and March 29, 2000. At shelters enumerators handed out separate individual census forms to each person at the location, every sixth form was to be a long form. Respondents were asked to complete the survey and return it to the
enumerator. At soup kitchens enumerators were instructed to interview each person using the Individual Census Questionnaire, with every sixth form a long form. The same interview process was used for mobile food vans and the targeted nonsheltered outdoor locations, but no long form data was collected on individuals counted at these locations. (For more information see
http://www.census.gov/pred/www/rpts/E.6.pdf .)
Data Processing
Once the forms were received the Census Bureau utilized a data capture system to record electronic images of most of the forms, using optical mark recognition for check boxes and character recognition software to capture write in responses. Due to the extra efforts to reduce
under counting, the Census 2000 responses could be made by mail, telephone and internet, increasing the possibility of duplicative forms for a household. An automated matching and un-duplication process was performed to address this issue. Potential missing or incomplete data, or discrepancies in the completed surveys were detected through a “coverage edit” process and were resolved through a telephone follow-up or a field staff visit. Computer operations identified missing or incomplete responses and used statistical imputation to complete the information (content edit).
Accessing of Data and Statistics
The Census Bureau disseminates Census 2000 data and statistics in two ways: (1) Summary Files that contains “pre-packaged” statistics that cover a wide variety of geographic and topical areas, and (2) Public Use Microdata (PUMs) files that contain the household and individual responses (raw data) for a sample of households.
Summary File. Thousands of Census 2000 statistical tables are available to the public on the Census Bureau web site at a variety of geographic levels including: national, state,
Metropolitan Statistical Area (MSA), and Congressional district, with many available down to the Census block level. Some of this information is also available in thematic maps and contained in a variety of other Census Bureau publications.
Note: as will be discussed below, any of the Census 2000 summary file tables using the general “disability” category, or those including the employment disability and/or “stay at home” disability are affected by the respondent error that led to the misidentification of the population with disabilities and should not be used. Unfortunately this issue affects more than half of the disability-related tables available so care must be exercised with the selection of tables examined. Tables specific to sensory, mental, physical and self-care disabilities are
unaffected by this issue, as is any disability information related to the 5-15 year age group, which was not asked the two problematic questions.
The Census 2000 summary file tables are available on the Census Bureau’s American Factfinder site (http://factfinder.census.gov/home/saff/main.html?_lang=en) and are also available from the Census Bureau on CD-ROM and DVD. The national or state level data sets on which the American FactFinder is based are also available for FTP download at this location: http://www2.census.gov/census_2000/datasets/ . The summary dataset documentation including
the file structure layout and tables of the data matrices are also available at this site. The summary datasets provide users with easily accessible information aggregated to a variety of geographic levels. The summary tables containing disability-related information include those under Summary File 3 (SF3) and Summary File 4 (SF4) which replicate most of the SF3 tables
for 335 race and ancestry population groups: 132 race groups; 78 American Indian and Alaska Native tribe categories; 39 Hispanic or Latino groups; and 86 ancestry groups. Disability related tables are also available in the American Indian and Alaska Native Summary File (AIANSF), which is repeated for the total population, total American Indian and Alaska Native population, total American Indian population, total Alaska Native population, and for 1,081 additional specified American Indian and Alaska Native tribes. The 109th Congressional District Summary File (Sample) re-tabulates Summary File 3 for the newly drawn 109th (2005-2006)
Congressional District boundaries. Summary files are also available for American Samoa, Guam, Commonwealth of the Northern Mariana Islands, and the US Virgin Islands.
www.DisabilityStatistics.org. A compilation of statistic from the Summary files is
available at a Cornell University web site, www.DisabilityStatistics.org. These statistics include population size, prevalence rates, and employment rates for the nation, states, counties,
Congressional Districts, metropolitan statistical areas (MSA), and American Indian, Alaskan Native, Hawaiian Home Areas. The statistics available at this web site are not influenced by the Census 2000 response error, which is discussed below.
PUMS Data. TheCensus 2000 Public Use Microdata Sample (PUMS) contains all the long form data at the household and person levels. The PUMS data allow users to produce customized statistics utilizing any of the possible combinations of data available in the Census long form. This is especially useful given the Census 2000 disability question issue as the two problematic disability categories can be excluded. The PUMS files are available from the Census Bureau for download or on DVD as either a one percent or a five percent sample of all US households that completed the Census Long form. The Census Bureau uses special
procedures to assure the confidentiality of these data including the topcoding or substitution of some data (such as income). These procedures result in statistically insignificant differences in estimates between the Census 2000 PUMS data and the Census 2000 summary data.
Since the PUMS data are based on a sample, sample weight are applied to the variables in the PUMS file during data analysis to create results that are representative of the population.
There are two weights available in the PUMS data: a person weight variable for use with person characteristics and a housing weight variable for use with housing characteristics. Each PUMS record includes the appropriate weight for the observation.
Each of the state PUMS files includes the household level information followed by the associated person level record(s) below. Note that vacant housing units are also included in the data with zero person records and that the geographic location information is only available in the household-level record. For ease of analysis of person-level information the household data are split from the person-level data, and then a one-to-many merge is performed with associated household-level data. This merge results in a rectangularized data table where all the household information is repeated for each of the associated person records (i.e., a flat file). The data sets are very large with the person records alone totaling more than 14 million observations at the national level. Given this it is recommended that the variables included in the dataset are carefully selected for the most efficient processing.
The ability to identify geographic areas is limited in the PUMS files to protect
confidentiality. The lowest geographic reporting area for the one percent PUMS file contains a minimum of 400,000 people (Super Public Use Microdata Areas, Super PUMAs) and the five percent file contains a minimum 100,000 people (PUMAs). Super PUMAs and PUMAs are a new geographic concept in the Decennial Census and cannot be in more than one state or
statistically equivalent entity. The Census Bureau generated a list of rules and recommendations regarding the delineation of PUMAs. Each state Census Data Center was given these criteria to create the PUMAs for its state. In most cases rural PUMAs are based on county (or county equivalent) while urban PUMAS are usually based on city boundaries, census tracts or metro areas. Typically a large county of 400,000 would be divided into four PUMAs in the five percent file, with each containing approximately 100,000 people. These four PUMAs then aggregate up to a single Super PUMA (one percent file) of 400,000. If a county contains fewer than 100,000 people it is typically combined with other adjoining small-population county areas until it meets the area minimum 100,000 person PUMA criteria. Note that although the Census Bureau attempted to minimize the occurrence of “islands,” not all areas included in individual PUMAs are adjoining. For more information regarding the Census 2000 PUMA creation
Data Center (http://mcdc2.missouri.edu/data/pums2000/Readme.html#pumas) for an excellent general description of PUMAs.
There are several resources for accessing the data. The Census Bureau makes geographic equivalency files available for each state that provide data that cross references Census 2000 PUMA and Super PUMA entities with counties, county subdivisions, places, and census tracts. The five percent Geographic equivalency file for New York is “PUMEQ5-NY.TXT.” This information is also available in a more readily understandable/usable form from Geocorr (geographic correspondence engine) developed by the Missouri Census Data Center
(http://mcdc2.missouri.edu/websas/geocorr2k.html). GeoCorr is a web-based application that allows users to generate a wide variety of geographic “crosswalks” based on a database of U.S. geographic codes and names that includes Census 2000 geographic data. The Census Bureau also provides state PUMA maps here: http://www.census.gov/geo/www/maps/puma5pct.htm .
All of the PUMS data files and technical documentation including the geographic equivalency files are available for download by state at the following Census Bureau sites: five percent files: http://www.census.gov/Press-Release/www/2003/PUMS5.html
one percent files: http://www.census.gov/Press-Release/www/2003/PUMS.html. An excellent source for further detail regarding working with Census 2000 PUMS data, including SAS code is the Missouri Census Data Center (http://mcdc2.missouri.edu/data/pums2000/Readme.html). Census State Data Centers may also have other code available and provide further technical assistance regarding the Census 2000 (see http://www.census.gov/sdc/www/ for a list of Census State Data Centers).
Definition of Disability and Other Variables
A description of the survey questions and how we used these questions to define disability, demographics, economic well-being, and employment is shown in Tables 1a - 1d.
Disability. The six disability questions in the Census 2000 were designed by a federal interagency workgroup (Adler et al., 1999). The process used to develop the questions included an investigation of the content of other surveys and extensive testing using the Census Bureau cognitive testing questionnaire lab. Cognitive testing is used to see if people understand and respond to the questions as intended. At the conclusion of the process, the interagency
Bureau. Although the workgroup acknowledged the level of difficulty in measuring disability in a set of six questions and that further methodological research is necessary, the questions have been regarded as an improvement over prior Census Bureau questions used to gather information on the disability population. Note that the Census 2000 disability questions are completely different from the previous 1990 Census, and were only asked of those aged 15 or older, therefore the results can not be compared between the Censuses.
The questions are described in the first section of Table 1a. The first three questions (Q16a, Q16b, Q17a) are for all household members ages 5 and older and are consistent with the impairment concept from the ICF. (Note, all question numbers refer to the mailback version of the long form). They include classifications of long lasting health conditions that are associated with disability: (1) severe sensory impairments (hearing, vision), (2) long lasting physical impairments (substantially limits one or more of the following activities: walking, climbing stairs, reaching, lifting, or carrying), and (3) health conditions that result in mental impairments (learning, remembering, or concentrating).
The Census 2000 survey also includes three questions that the federal interagency workgroup determined were necessary for program and policy purposes. The first of these questions, Question 17b, is for all household members ages 5 and older. It is consistent with the ICF activity limitations concept and identifies health conditions lasting at least six months that affect the performance of activities of daily living (dressing, bathing or getting around inside the home). Questions 17c and 17d, are for all household members ages 16 and older. They identify health conditions lasting at least six months that affect participation in usual life activities such as going outside the home alone to visit a doctor’s office or going shopping, and working at a job or business. These last two questions are consistent with the ICF participation restriction
concept.
The Census Bureau uses these six questions to identify the six sub-disability categories that are described in Table 1a, as well as an overall disability status category. The sub-disability categories are: a sensory disability if the person has a “yes” response to question Q16a; a
physical disability if the person has a “yes” response to question Q16b; a mental disability if the person has a “yes” response to question 17a; a self-care disability if the person has a “yes” response to Q17b; a go-outside-the-home disability if the person has a “yes” response to Q17c; and an employment disability if the person has a “yes” response to Q17d.
The final overall category is consistent with the ICF concept of disability. The Census Bureau refers to the category as a disability and it is defined as having at least one of the six disabilities included in the Census 2000 questionnaire.
Respondent/Enumerator Error to the Go-Outside-Home and Employment Disability Questions. It is vital to note that there is evidence of substantial and systematic error in the way people responded to the go-outside-home and the employment disability questions, which therefore affects the Census Bureau’s overall disability category. Discovery of this problem was made in two parts. Initially a comparison between the Census 2000 results and the ACS revealed an apparent enumerator survey problem (Stern, 2003). Second, an apparent minor redesign of the way the 2003 ACS disability questions were asked revealed that the issue was not limited to the enumerator collected surveys but included the mailback versions as well (Stern and Brault 2005). The results of these comparisons and the implications of the problems discovered are discussed below.
As mentioned earlier, concern arose about the length and complexity of these questions, in particular, the distance between the stem of question 17 and the employment disability
question (17d). Subsequent analysis of the Census 2000 data by Stern (2003) suggests that there exists substantial respondent and/or interviewer error relating to the enumeration process. According to Stern (2003), the employment disability rate is substantially higher in the enumerated sample (17.7 percent) than in the mailback sample (10.9 percent). Differences between the two samples are expected, because non-response to the mailback form may be related to disability or other characteristics related to disability. However, Stern (2003) found only minor differences between the two samples in the sensory, mental, physical, and self-care disability rates. In addition, the employment disability rate in the 2000 ACS mailback sample was the same in the Census 2000 mailback sample (both 10.9 percent), but the employment disability rate in the 2000 ACS enumerated sample was significantly lower (7 percent) than the rate in the Census 2000 enumerated sample (17.7 percent). This suggests that differences in the enumeration processes of the Census 2000 and 2000 ACS lead to substantial difference in disability rates, specifically employment disability rates. Similar, but less dramatic differences are found in the go-outside-home disability rates.
Furthermore, an inspection of employment rates suggests this measurement error is systematically related to employment. According to Stern (2003), the employment rates of
people (ages 21-64) with employment disabilities were 75.0 percent in the enumerated sample and 54.8 percent in the mailback sample. No such differences exist in the employment rates of those with sensory, physical, mental, and self-care disabilities in the Census or the ACS.
In short, these patterns suggest that persons who were enumerated in the 2000 Census were more likely to answer whether they went to work rather than whether they had difficulty going to work. One possible explanation for these patterns is that the go-outside-home and employment disability stem of question 17 was separated from sub-questions 17a and 17b by a column break for persons other than Person 1 in the Census 2000 long form enumeration version. Overall, Stern (2003) suggests that complexity and length of the six questions, enumeration procedures and the translation of the mailback long form into a form for enumerators may have played a role in the difference within the Census and between the Census and ACS. Stern (2003) concludes that, “… disability rates are sensitive to relatively minor differences both within surveys across mode and across two surveys.”
Changes to the ACS Disability Questions. Since the ACS continued to use the same disability questions in 2001 and 2002, it seemed likely that the trend of the over-reporting, which may result from the complexity and length of the questions, continued in those years. In
response to this potential respondent/enumerator error, the Census Bureau made a seemingly minor change to the 2003 ACS questionnaire. The stem to Question 17 was repeated before the go-outside-home and employment disability questions, and the age skip pattern did not appear in the questions.
Consistent with the inferences for the comparison of Census 2000 and 2000 ACS results, our analysis of the 2000-2003 ACS data shows that between 2002 and 2003 there was a
substantial decrease in the employment disability rates among working age (ages 25-61) individuals (7.8 percent in 2000, 7.4 percent in 2001, 7.6 percent in 2002, and 6.9 percent in 2003).
The implication is that working age individuals were less likely to interpret the question as asking if they were working. Similarly, there was a substantial increase in the employment disability rates among person ages 65 and over (22.0 percent in 2000, 23.4 percent in 2001, 24.1 percent in 2002, and 28.2 percent in 2002). The implication is the same—that individuals were less likely to interpret the question as asking if they were working—but the impact on the
estimate is in the opposite direction, because persons ages 65 and over are less likely to be working and thus previously reported not working.
Stern and Brault (2005) confirm the differences between the 2002 and 2003 ACS disability estimates, described above. They show that the employment disability rate among persons ages 16 to 64 in the ACS mailback sample declined from 8.7 percent in 2002 to 6.7 percent in 2003, which converges with the estimate from the enumerated sample, 6.2 percent in 2003. Importantly, differences between the mailback and enumerated samples in the sensory, physical, mental, and self-care disability rates remained relatively constant between 2002 and 2003. Stern and Brault (2005) stated that “[t]he evidence presented suggests that it is not possible to discern which portion, if any, of the difference between 2002 and 2003 disability estimates can be attributed to actual change in the number or percentage of people with disabilities. As a result, the Census Bureau will not present any time-series data showing estimates from 2002 and earlier with data from 2003 and later for the affected items.”
Taken together, the loss of confidence in Census 2000 estimates and the ACS time trends represents a significant loss of information. For instance, a majority of the Census 2000
disability-related information posted on the Census Bureau web site is based on an overall disability measure (the union of the six disability types). The statistics on poverty and
educational attainment are available only for the overall disability measure. Seams in time-trend data due to changes in data collection methods are not new to the Census Bureau, such as the 1993/1994 seam in the historical CPS income (see Burkhauser, Butler, Feng and Houtenville, 2004); although these changes were not due to direct respondent error, but rather improvements and changes in data collection.
Note that this design problem only affects calculations of general disability (one or more of the six) and the two types of disability noted. Sensory, physical, mental and self-care
disability estimates are unaffected. In addition, this design problem does not impact disability related statistics for those under the age of 16 because the go-outside-home and employment disability questions are not used for those under the age of 16.
Demographics. In our analysis below, we utilize questions on age, gender, race, and ethnic origin. Question 3—“[w]hat is this person’s sex?”—is used to identify a person’s gender. Question 4—“[w]hat is this person’s date of birth?”—is used to identify a person’s age.
Question 6 identifies a person’s race— “[w]hat is this person’s race? Mark (x) one or more races to indicate what this person considers himself/herself to be.” The Census Bureau uses these two questions to construct race categories as described in Table 1b.
Information on education for each household member is identified in the “person” section of the survey. The Census Long Form includes three questions on education. Two of the
questions are related to recent participation in an educational program. The second question, Question 9, asks, “what is the highest degree or level of school this person has completed?” For persons currently enrolled in an educational program, the Census long form provides instructions to provide the highest grade completed or the highest degree received. The householder is presented a list of possible responses and is asked to identify the highest level of education that each household member has completed. The possible responses to the survey question include: no schooling completed; nursery school to fourth grade; fifth grade or sixth grade; seventh grade or eighth grade; ninth grade; tenth grade; eleventh grade; twelfth grade no diploma; high school graduate; some college credit, but less than one year; one or more years of college; Associate Degree (e.g., AA, AS); Bachelor’s degree (e.g., BA, AB, BS); Master’s degree (e.g. MA, MS, MEng, Med, MSW, MBA); Professional degree (e.g., MD, DDS, DVM, LLB, JD); or Doctorate Degree (e.g., PhD, EdD).
Employment Measures. The Census Bureau definition of employment status is drawn from two questions. Table 1c describes the Census 2000 information on the employment status of each household member aged 16 and older. A household member is considered employed if he or she met one of the two following criteria: (1) was “at work” during the reference period— that is, worked as a paid employee, worked in his or her own business or profession, worked on his or her own farm, or worked 15 or more hours as an unpaid worker on a family farm or business, or (2) was “with a job but not at work” during the reference period—that is, had a job but temporarily did not work at that job during the reference period due to illness, bad weather, industrial dispute, vacation or other personal reasons. The reference period is defined as the week preceding the date that the householder completed the questionnaire.
There are two other employment measures that we use to characterize the employment of persons with disabilities. These measures identify employment status over a year-long period. The first measure is referred to as “some attachment to the labor force” and defines employment as at least 52 hours of employment during the reference year. The second is referred to as
“full-time/full-year employment.” This is defined by the Census Bureau as 50 to 52 weeks and at least 35 hours per week.
Income and Poverty. The economic well-being measures we estimate use information from the Census 2000 on annual income, family size, family composition, household size and household composition. The section labeled income in Table 1d describes the income measures and summarizes the method used by the Census Bureau to construct a poverty measure.
The income measure uses income received in 1999 from each individual household member. The questions are located in the “person” section of the survey. Questions 31a through 31h are used to collect information on the following sources of income: wages, salary,
commissions, bonuses, or tips from all jobs (before deductions for taxes, bonds, dues or other items); self-employment income from own non-farm businesses or farm businesses, including proprietorships and partnerships (net income after business expenses); interest, dividends, net rental income, royalty income, or income from real estates and trusts; Social Security or Railroad Retirement; Supplemental Security Income (SSI); any public assistance or welfare payments from the state or local welfare office; retirement, survivor or disability pensions (not including Social Security); and any other sources of income received regularly such as Veterans’ (VA) payments, unemployment compensation, child support or alimony (not including lump sum payments such as money from an inheritance or the sale of a home). Annual total income is the sum of all of the income sources for the household member.
The poverty measure is computed based upon the standards defined in Directive 14 from the Office of Management and Budget (OMB). These standards use poverty thresholds created in 1982 and index these thresholds to 1999 dollars using poverty factors based upon the
Consumer Price Index (CPI-U). They use the family as the income sharing unit and family income is the sum of total income from each family member living in the household. The poverty threshold depends upon the size of the family; the age of the householder (i.e., the person who owns or pays rent for the housing unit and who fills out the Census questionnaire for the household) for one member families and two member families; and the number of related children under the age of 18. Family income is compared to the relevant poverty threshold to determine the poverty status of families.
The poverty threshold for an unrelated household member is a function of her own total income. The poverty threshold is different for a member of a household who is unrelated to the
householder compared to the poverty threshold for a one-member household. A poverty measure is not created for unrelated household members who are under the age of 15 because Census 2000 did not collect income information from persons under the age of 15.
Note that poverty statistics do not adjust for the additional expenses that are the result of a health condition or a disability (e.g., personal assistance, equipment, medications, etc.). They also do not adjust for in-kind benefits, such as health insurance, food stamps, housing,
transportation, child-care, etc. For these reasons, household income relative to the poverty line is substantially limited as an indicator of a household’s poverty if the household contains a person with a disability. Further details on the Census 2000 poverty measure are available from the U.S. Census Bureau website http://www.census.gov/prod/2003pubs/c2kbr-19.pdf .
Two other measures of economic well-being are included that use both related and unrelated members of the household as the income-sharing unit. The first measure is total household income, which does not adjust for household size. The second measure is household size adjusted income. It assumes that the income needed to achieve a level of economic well-being is lower for those who live in the same household than it is to live in separate households. That is, by sharing housing and other resources, less income is needed to achieve a certain level of economic well-being. The measure is usually described by the following formula:
e Size Household Income Household Income Adjusted Household ) ( =
where e is a parameter with a value between 0 and 1 and represents the degree of sharing (i.e., economies of scale) within the household. When e equals 0, the measure assumes that income needed is independent of household size. For example, the measure assumes a household with 5 members needs the same income as a household with one member to achieve a certain level of economic well-being. When e equals 1, the measure assumes that there is no sharing of resources within the household. For example, the measure assumes that a household with 5 members needs 5 times the income as a household with one member to achieve the same level of economic well-being. While there is no universal agreement on the value of the e parameter, there is empirical evidence that shows that setting e=0.5 makes a reasonable adjustment for the degree of sharing within the household (see Ruggles 1990 p. 77; and Citro and Michael, 1995). Citro and Michael (1995) provide a good description of household adjusted income and
Statistics from the Census 2000
Disability has different implications for employment and economic well-being at different ages. In this section, we first identify different age groups that reflect differences in activities. These age groups are ages 5 to 17 (primary and secondary school age persons), ages 18 to 24 (school-to-work transition age persons), ages 25 to 61 (working age persons), ages 62 to 64 (early Social Security retirement age persons), and ages 65 and older (standard Social
Security retirement age persons). Our analysis of employment and economic well-being focuses on working age persons between the ages of 25 and 61.
In Tables 2-4, we provide estimates for overall disability, go-outside-home disability, and employment disability, however, we shade them to highlight the fact that their accuracy is highly suspect—we highly recommend not citing these estimates. As an alternative, we provide estimates for people who report sensory, physical, mental, and/or self-care disabilities—the union of the four reliable disability-related categories. We often call this category “at least one of the four.” We also provide estimate for these four categories separately.
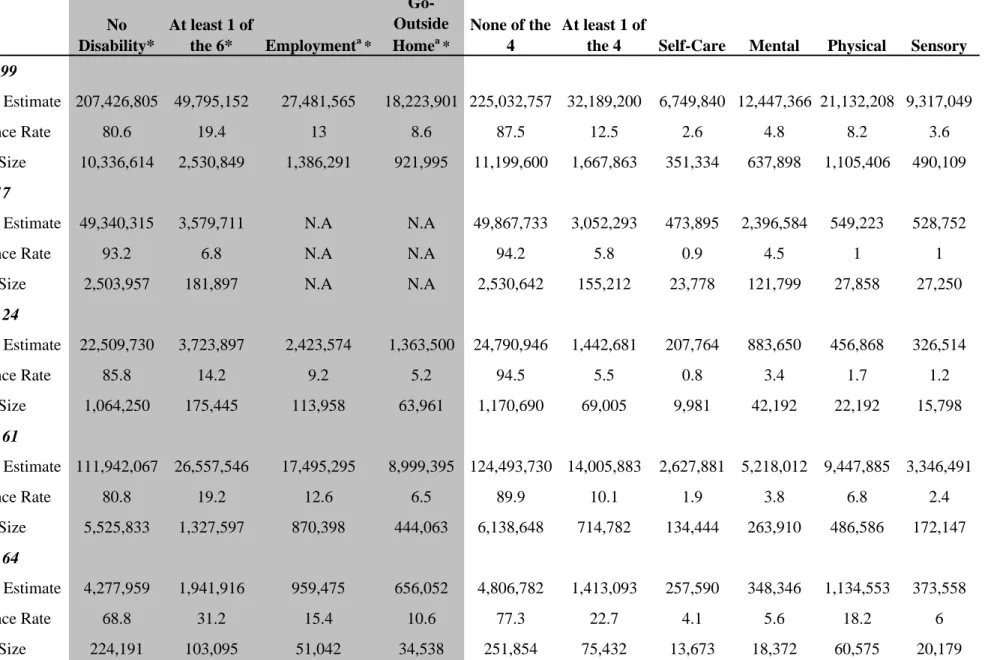
Composition of the Populations with Disabilities. Table 2 provides population estimates, disability prevalence estimates, and sample sizes for non-institutionalized civilians. Among persons ages 5 to 99, 12.5 percent (32.2 million) report a sensory, physical, mental, and/or self-care disability. Regarding specific disabilities, 2.6 percent (6.7 million) report a self-self-care
disability; 4.8 percent (12.4 million) report a mental disability; 8.2 percent (21.1 million) report a physical disability, and 3.6 percent (9.3 million) report a sensory disability.
As one examines the disability rates across the age categories, the proportion reporting sensory, physical, mental, and/or self-care disability generally increases with age: ages 5-17, 5.8 percent; ages 18-24, 5.5 percent, ages 25-61, 10.1 percent; ages 62-64, 22.7 percent; ages 65 and older, 36.8 percent. This is true for the specific types of disability, with the exception of self-care and mental disabilities, which decline between the age groups 5-17 and 18-24. Note that the composition of disability types also changes with age. Among those ages 5-17 and 18-24 mental disabilities is the most common of the four types (4.5 percent and 3.4 percent, respectively), while among those ages 25 and older, physical disabilities is the most common (ages 25-61, 6.8 percent; ages 62-64, 18.2 percent; and ages 65 or more, 28.6 percent,).
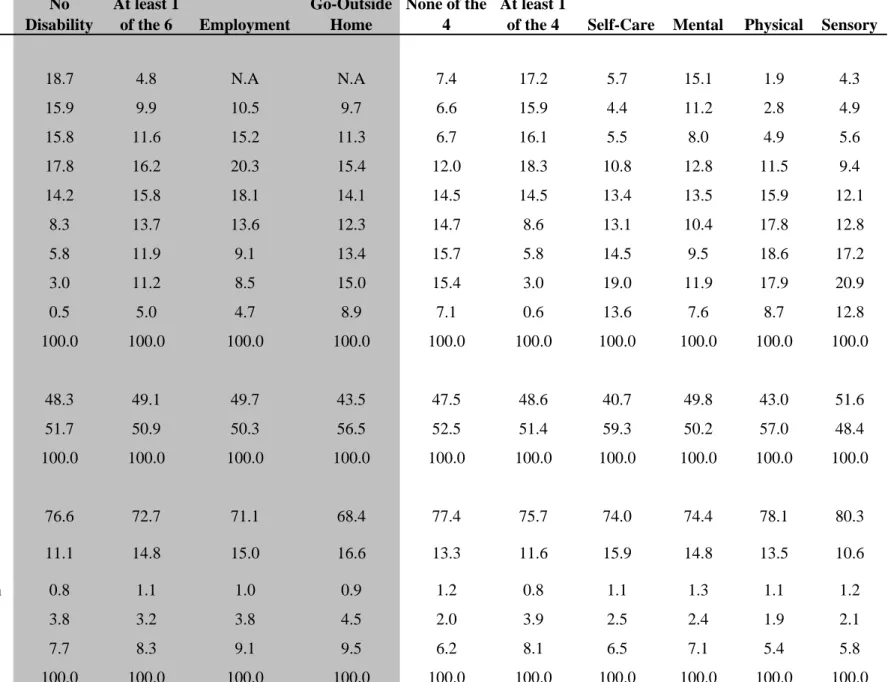
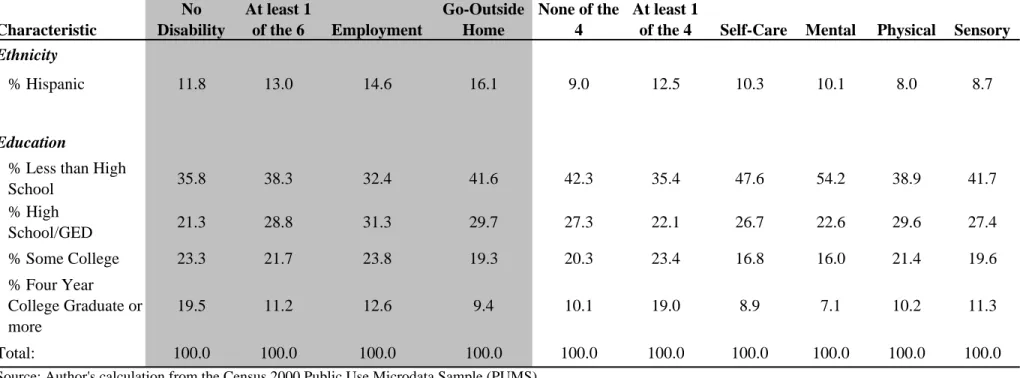
Table 3 provides shared distributions across age, gender, race and education within each disability group. Table 3 reads differently than Table 2—focusing on comparisons within
categories in a single column. Within the population reporting sensory, physical, mental, and/or self-care disabilities, more than two-thirds (67.6 percent) are ages 5-44, compared to about one-third (32.6 percent) of people who did not report these disabilities. Slightly more women (51.4 percent) than men report at least one of these four disabilities. More than three quarters (75.7 percent) of those reporting at least one of these four disabilities is white. With regards to
education, more than a third of those reporting at least one of these four disabilities has less than a high school degree or equivalent.
As is shown in Table 3 when looking at the share distributions for specific types of disabilities, the school age population accounts for 15.1 percent of the population reporting mental disabilities; this may be related to the increased diagnosis of learning disabilities. The population with self care disabilities is fairly evenly spread across the 35 and older age groups but the oldest two age groups: 75-84, 85+ account for about a third of those with self-care disabilities (19.0 percent + 13.6 percent = 32.6 percent). Both physical and sensory disabilities are seen predominantly in the 45 and older age groups. About a third of those in these two disability categories are in the oldest groups: 75-84, 85+ (20.9 percent + 12.8 percent = 33.7 percent).
Employment. Table 4 shows three employment measures for the working-age population (ages 25 to 61) by disability type, further broken down by gender, race, ethnicity and educational level. Of those who do not report sensory, physical, mental, and/or self-care disabilities, 78.8 percent report being employed in the reference period compared to slightly half that rate (41.8 percent) for persons who do report sensory, physical, mental, and/or self-care disabilities. The full-time employment rate for persons reporting sensory, physical, mental, and/or self-care disabilities was less than half of those not reporting sensory, physical, mental, and/or self-care disabilities (27.1 percent compared to 58.8 percent). The disability type with the highest
employment rate was those with sensory disabilities, followed by those with physical disabilities and mental disabilities with self-care disabilities having the lowest employment rates. The difference between these two groups is also evident when looking at our employment measure “working sometime in the previous year” (86.3 percent of those without sensory, physical, mental, and/or self-care disabilities vs. 51.9 percent of those with sensory, physical, mental, and/or self-care disabilities).
Men reporting sensory, physical, mental, and/or self-care disabilities had a higher employment rate during the reference period than women reporting sensory, physical, mental, and/or self-care disabilities (46.0 percent compared to 37.7 percent). However, the gender gap of 8.3 percentage points in the population with sensory, physical, mental, and/or self-care
disabilities is less than the gender gap of 14.4 percentage points in the population without
sensory, physical, mental, and/or self-care disabilities). In the population with sensory, physical, mental, and/or self-care disabilities, minorities had lower employment rates than did whites as did those with less education. Note that among the black population, there is a particularly large difference in the employment rate between those with and without sensory, physical, mental, and/or self-care disabilities—18.8 percent compared to 68.9 percent.
Advantages of the Census 2000
Geographic Distribution. A major advantage of the Census 2000 over other sources of disability data is its ability to generate local statistics. Figure 4 shows a map of the U.S. at the county level by the prevalence of sensory, physical, mental, and/or self-care disabilities based on the Census 2000 data from the Summary Files. (The county level prevalence rates that appear in Figure 3 may be found at www.DisabilityStatistics.org .) The rate ranges from a low of 0.5 percent to a maximum of nearly 37.0 percent. Generally, counties in the Midwestern states and some mid-Atlantic and New England states (MA, NH, VT, CN, RI, PA, NY) range below 13 percent. South-eastern states (KT, WV, TN, AK, MI, MS, AL) and a scattering of counties in the western half of the U.S. have higher disability rates upwards of 15.0 percent to 36.8 percent. The high rates of disability in the south-eastern states may be due to the amount of labor intensive farming, heavy industry, and mining in those areas. The patterns are consistent with the findings of McCoy and Weems (1989) who found the highest rates of Supplemental Security Income and Social Security Disability Insurance receipt occurred in the "disability belt" of Appalachia and the lower Mississippi Valley. LaPlante (1993) reports a similar finding using the 1980 and 1990 Census.
Figure 4. Percentage of Non-Institutionalized Civilians Ages 21-64 Reporting Sensory, Physical, Mental, and/or Self-Care Disabilities, by County 12.9 – 15.2 15.3 – 36.8 11.0 – 12.8 9.1 – 10.9 0.5 – 9.0%
Source: Author’s calculations using the Census 2000 Summary Files. See www.DisabilityStatistics.org for the numbers underlying this map
Table 5 demonstrates the ability of the Summary Files to provide statistics for a variety of geographic areas. The upper portion of Table 5 begins at the U.S. level and drops down through nested geographic levels: region, county, city and census tract. In some areas with higher population counts it is possible to get down to the block level, but in many instances the population becomes too small and the Census Bureau will not supply easily identifiable information such as disability at this level.
The lower half of Table 5 demonstrates some of the other non-nested geographic areas that are available from the Census 2000 summary files.2 Such areas include Metropolitan Statistical Areas (MSAs), Congressional Districts, American Indian, Alaskan native and
Hawaiian Homeland areas. Note that the last geographic category is not limited to individuals of specific ethnic or American Indian backgrounds—only that they live in the area defined by the official geographic boundaries of those designated areas. MSAs are defined by the Census Bureau and can overlap state and county borders. MSAs are “[a] geographic entity defined by the U.S. Office of Management and Budget for use by federal statistical agencies, based on the concept of a core area with a large population nucleus, plus adjacent communities having a high degree of economic and social integration with that core. The designation of an MSA requires the presence of a city with 50,000 or more inhabitants, or the presence of an Urbanized Area (UA) and a total population of at least 100,000 (75,000 in New England). The county or
counties containing the largest city and surrounding densely settled territory are central counties of the MSA. Additional outlying counties qualify to be included in the MSA by meeting certain other criteria of metropolitan character, such as a specified minimum population density or percentage of the population that is urban. MSAs in New England are defined in terms of minor civil divisions, following rules concerning commuting and population density.” (Census Bureau Glossary definition). Disability data are also available at the 106th Congressional District level for those interested in local policy implications for the population with disabilities.
People Living in Institutions. Another major advantage of the Census 2000 over other sources of disability data is its ability to generate statistics on people living in institutions. Table 6 demonstrates the Census 2000’s ability to identify people living in institutional group quarters and non-institutional group quarters at the national and state levels.3 As is noted earlier there are
2 As mentioned earlier, the ability to identify local areas using the PUMS data is limited. 3 As mentioned earlier, institutions are a subset of group quarters, see Figure 3 for more detail.
very few data sources that contain information regarding these special populations. The first three columns of Table 6 are based on the PUMS data. The PUMS data files only allow for the identification of institutionalized GQ versus non-institutionalized GQ—no further specificity is possible. Among people with self-care, mental, physical and/or sensory disabilities of all ages 31,408,919 persons (or 91 percent) lived in housing units, 2,196,086 persons (or 6 percent) lived in institutionalized GQs, and 804,290 persons (or 2 percent) lived in non-institutionalized GQs. Note that the percentage that lived in institutional GQs varied substantially across states—from 2.9 percent in Alaska to 10.4 percent in Iowa.
The fifth and sixth columns of Table 6 include population estimates for information about group quarters derived from the Census 2000 Summary Files. The Summary Files have the advantage of allowing the identification of the specific types of GQ, however they do not provide the cross tabulation of GQ type and disability status. As an alternative, we used the GQ type information to classify GQs into related and non-disability related GQ. The disability-related GQs are(using the terminology contained in the Summary Files): (a) hospices or homes for chronically ill, (b) military hospitals or wards for chronically ill, (c) other hospitals or wards for chronically ill, (d) hospitals or wards for drug/alcohol abuse, (e) mental (psychiatric)
hospitals or wards, (f) schools, hospitals, or wards for the mentally retarded, (g) institutions for the deaf, (h) institutions for the blind, (i) orthopedic wards and institutions for the physically handicapped, and (j) residential treatment centers for emotionally disturbed children. The “disability related” non-institutionalized GQs are (a) homes or halfway houses for drug/alcohol abuse, homes for the (b) mentally ill, (c) mentally retarded, and (d) physically handicapped. As shown in Table 6,213,504 persons lived in disability-related institutional GQs, and 322,317 persons lived in disability-related non-institutional GQs. This is quite different from the PUMS estimate of the number of people with disabilities living in such institutional and
non-institutional GQs.
Comparisons to Other Data Sources
The Census 2000 is one of several nationally representative data sources that provide estimates of the number, prevalence, employment and economic well-being of people with disabilities. Different surveys use different methods to collect information on persons with disabilities, and these differences lead to differences in the resulting estimates. This section