Graduate Theses and Dissertations
Iowa State University Capstones, Theses and
Dissertations
2017
Flattening methods for adaptive location-based
software to user abilities
Thitivatr Patanasakpinyo
Iowa State UniversityFollow this and additional works at:
https://lib.dr.iastate.edu/etd
Part of the
Computer Sciences Commons
This Dissertation is brought to you for free and open access by the Iowa State University Capstones, Theses and Dissertations at Iowa State University Digital Repository. It has been accepted for inclusion in Graduate Theses and Dissertations by an authorized administrator of Iowa State University Digital Repository. For more information, please [email protected].
Recommended Citation
Patanasakpinyo, Thitivatr, "Flattening methods for adaptive location-based software to user abilities" (2017).Graduate Theses and Dissertations. 16191.
by
Thitivatr Patanasakpinyo
A dissertation submitted to the graduate faculty in partial fulfillment of the requirements for the degree of
DOCTOR OF PHILOSOPHY
Major: Computer Science
Program of Study Committee: Les Miller, Co-major Professor Wallapak Tavanapong, Co-major Professor
Shashi Gadia Johnny Wong Stephen Gilbert
The student author, whose presentation of the scholarship herein was approved by the program of study committee, is solely responsible for the content of this dissertation. The
Graduate College will ensure this dissertation is globally accessible and will not permit alterations after a degree is conferred.
Iowa State University Ames, Iowa
2017
ii
DEDICATION
I would like to dedicate this dissertation to my family: my son, wife, mother, father, brother, grandmother, and in-laws, without their support I would not have earned this accomplishment. I would also like to thank my major professors, my committees, and all my friends for their guidance, suggestion, and any priceless assistance during my time at Iowa State University. All of them made the moment of my life in United States of America precious and glorious.
TABLE OF CONTENTS
LIST OF TABLES . . . viii
LIST OF FIGURES . . . ix ACKNOWLEDGEMENTS . . . xiii ABSTRACT . . . xv CHAPTER 1. INTRODUCTION . . . 1 1.1 Problem . . . 2 1.2 Deliverables . . . 4 1.3 Contributions . . . 5
CHAPTER 2. LITERATURE REVIEW . . . 6
2.1 The effect of individual differences on software utilization and performance 6 2.2 Interesting studies that relate to spatial ability . . . 10
2.3 Impact of spatial visualization (VZ) in computer-based applications . . . . 18
2.4 The location-based survey software . . . 20
2.5 The adaptive user interfaces (AUI) and problems that lead to it . . . 22
iv CHAPTER 3. OBJECT-INDEXING . . . 32 3.1 Introduction . . . 32 3.2 Design of Object-Indexing . . . 32 3.2.1 Line . . . 35 3.2.2 Point . . . 38 3.2.3 Area . . . 42
3.3 Conceptual Object-Indexing Usage . . . 45
3.3.1 Line . . . 47
3.3.2 Point . . . 52
3.3.3 Area . . . 55
3.4 Using Object-Indexing in Study Software . . . 59
CHAPTER 4. STUDY I: A STUDY TO INVESTIGATE PARTICIPANTS’ PER-FORMANCE WITH DIFFERENT USER INTERFACES . . . 74
4.1 Study Procedure . . . 75
4.1.1 Test of Spatial Visualization . . . 75
4.1.2 Field Portion of the Study . . . 77
4.2 Study Software . . . 79
4.2.1 Software Interface Components . . . 80
4.2.2 Software Features . . . 80
4.3 Raw Results from Study . . . 83
4.4 Preliminary Analyzed Results . . . 87
4.4.1 Hypotheses for Study I . . . 88
4.4.1.1 Significant Hypotheses . . . 91
4.4.1.2 Suggestive Hypotheses . . . 95
CHAPTER 5. STUDY II: A STUDY TO INVESTIGATE PARTICIPANTS’ PER-FORMANCE WITH A UNIVERSAL USER INTERFACE USING A LARGE
MAP SPACE . . . 100
5.1 Objectives . . . 100
5.2 Methodology . . . 101
5.2.1 Study Designs . . . 101
5.2.2 Study Procedures . . . 101
5.2.2.1 Test of Spatial Visualization . . . 101
5.2.2.2 Field Portion of the Study . . . 101
5.2.3 Study Software . . . 103
5.2.3.1 Software Components . . . 103
5.2.3.2 Software Features . . . 105
5.3 Results . . . 105
5.4 Discussion . . . 109
5.4.1 Research Question 1: Was there a significant difference in verification score? . . . 110
5.4.2 Research Question 2: Was there a significant difference in time? . . 110
5.4.3 Research Question 3: Was there a significant difference in distance? 112 5.4.4 Research Question 4: Was there a significant difference in a number of error taps? . . . 114
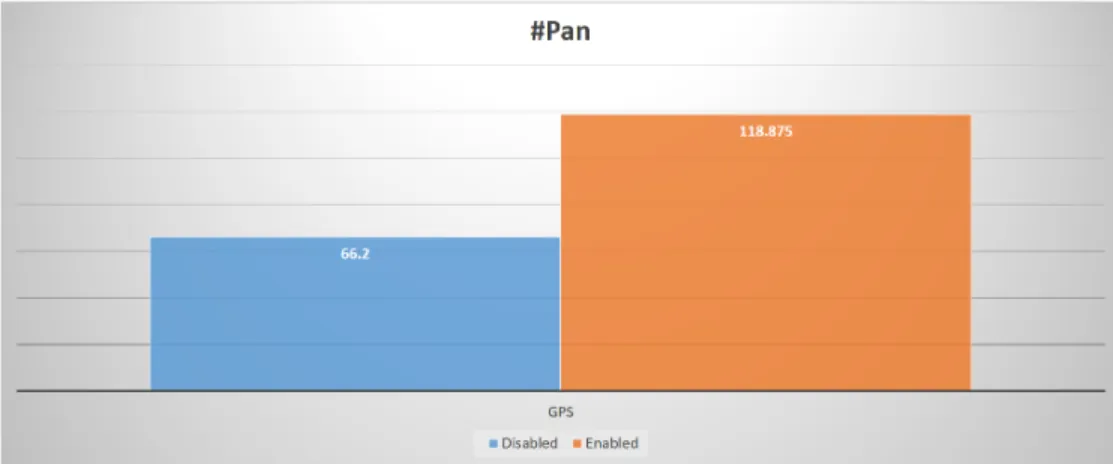
5.4.5 Research Question 5: Was there a significant difference in a number of pan taps? . . . 114
5.4.6 Research Question 6: Was there a significant difference in a number of zoom taps? . . . 116
vi
CHAPTER 6. STUDY III: A STUDY TO INVESTIGATE PARTICIPANTS’
PER-FORMANCE WITH AN ADAPTIVE USER INTERFACE . . . 119
6.1 Objectives . . . 119
6.2 Methodology . . . 120
6.2.1 Study Designs . . . 120
6.2.2 Study Procedure . . . 122
6.2.2.1 Test of Spatial Visualization . . . 122
6.2.2.2 Field Portion of the Study . . . 123
6.2.3 Study Software . . . 125
6.2.3.1 Software Components . . . 126
6.2.3.2 Software Features . . . 126
6.2.3.2.1 Features on Traditional UI . . . 129
6.2.3.2.2 Features on the Adaptive UI for Low VZ . . . 129
6.2.3.2.3 Features on the Adaptive UI for High VZ . . . 132
6.2.3.2.4 Prediction Module . . . 132
6.3 Results . . . 136
6.4 Discussion . . . 138
6.4.1 Improvement with Adaptive UI . . . 138
6.4.1.1 Normalization of Times . . . 138
6.4.1.1.1 Normalization by Overall Average . . . 139
6.4.1.2 Tests of Hypotheses . . . 141
6.4.1.2.1 Research Question 1: For participants who were assigned treatment 0, was there a significant differ-ence between time in phase 1 and phase 2? . . . . 142
6.4.1.2.2 Research Question 2: For participants who were assigned treatment 1, was there a significant differ-ence between time in phase 1 and phase 2? . . . . 144
6.4.1.2.3 Research Question 3: Focusing on phase 1, was there a significant difference between time used by participants of treatment 0 and treatment 1? . . . 145
6.4.1.2.4 Research Question 4: Focusing on phase 2, was there a significant difference between time used by participants of treatment 0 and treatment 1? . . . 146
6.4.2 Analysis of Prediction Methods . . . 148
6.4.3 Additional Analysis: Market Basket Analysis on Participant’s Behavior151 6.4.3.1 Rule 1 . . . 152
6.4.3.2 Rule 2 . . . 154
6.4.3.3 Rule 3 . . . 154
6.4.4 Additional Analysis: Mispredicted Participants . . . 155
6.5 Conclusions . . . 156
CHAPTER 7. CONCLUSIONS AND CONTRIBUTIONS . . . 159
BIBLIOGRAPHY . . . 162
APPENDIX A. IRB APPROVAL DOCUMENTS . . . 175
viii
LIST OF TABLES
Table 4.1 Address Verification Possibilities. . . 78
Table 4.2 Example Raw Results from Study. . . 87
Table 4.3 Hypotheses for Low VZ Participants. . . 89
Table 4.4 Hypotheses for High VZ Participants. . . 90
Table 5.1 Example Results from Study II. . . 109
Table 6.1 Possible Scenarios in Study III. . . 125
Table 6.2 Partial Results from Study III. . . 137
Table 6.3 Example Results of Actual Time and Normalized Times. . . 142
Table 6.4 Complete Prediction Results of Different Methods. . . 150
Table B.1 Complete Results of Study I. . . 179
Table B.2 Complete Results of Study II. . . 180
Table B.3 Complete Results of Study III. . . 181
Table B.4 Association Rules: Rules 1 - 36 . . . 183
Table B.5 Association Rules: Rules 37 - 62 . . . 184
Table B.6 Association Rules: Rules 63 - 86 . . . 185
Table B.7 Association Rules: Rules 87 - 120 . . . 186
Table B.8 Association Rules: Rules 121 - 146 . . . 187
LIST OF FIGURES
Figure 3.1 Example of a Vector Map Generated from a Shapefile. . . 33
Figure 3.2 The Conceptual Class of Street Object. . . 34
Figure 3.3 The Concept of Creating a Street Object. . . 35
Figure 3.4 A Raster Map Consists of Two Streets without Street Names. . . . 37
Figure 3.5 Street Object of AStreet. . . 37
Figure 3.6 Street Object of BStreet. . . 38
Figure 3.7 The Conceptual Class of Intersection Object. . . 39
Figure 3.8 The Concept of Creating an Intersection Object. . . 39
Figure 3.9 A Raster Map Consists of One 5-way Intersection without Name. . 41
Figure 3.10 Intersection Object of IIntersection. . . 41
Figure 3.11 The Conceptual Class of Wetland Object. . . 42
Figure 3.12 The Concept of Creating a Wetland Object. . . 43
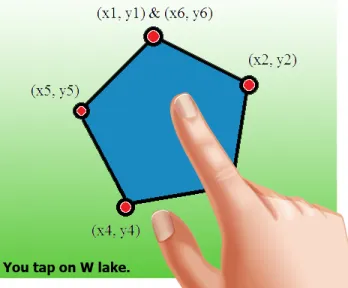
Figure 3.13 A Raster Map Consists of One Wetland without Name. . . 44
Figure 3.14 Wetland Object ofWLake. . . 45
Figure 3.15 Expected Scenario. . . 46
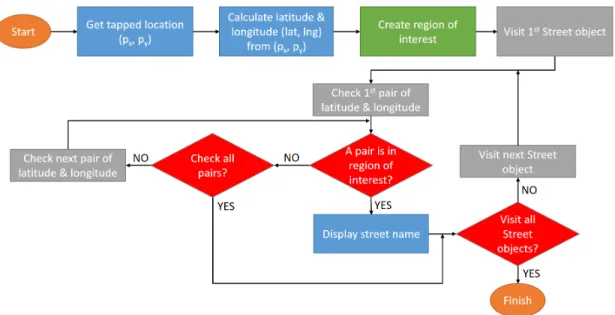
Figure 3.16 Flow Chart of Object-Indexing Implementation for Line Object Model. 48 Figure 3.17 How Object-Indexing Operates for Line Object Model. . . 49
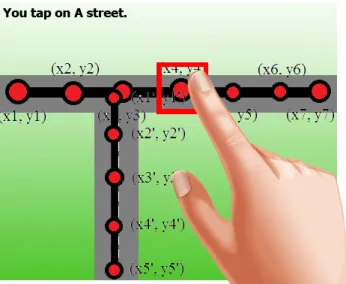
Figure 3.18 Street Object Detecting in Our Software (1). . . 50
Figure 3.19 Street Object Detecting in Our Software (2). . . 50
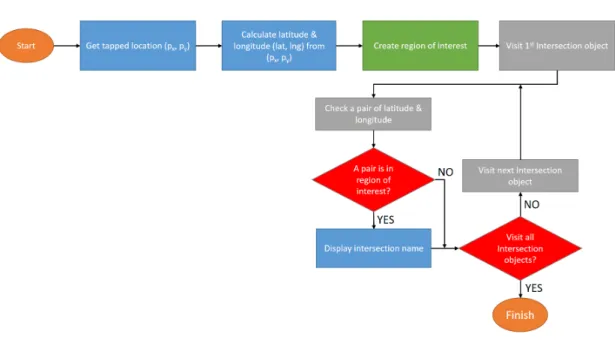
Figure 3.20 Flow Chart of Object-Indexing Implementation for Point Object Model. . . 53
x
Figure 3.21 How Object-Indexing Operates for Point Object Model. . . 53
Figure 3.22 Flow Chart of Object-Indexing Implementation for Area Object Model. 56 Figure 3.23 How Object-Indexing Operates for Area Object Model. . . 57
Figure 3.24 Example of Streets Text File. . . 60
Figure 3.25 A User Taps on an Intersection in Tiger Map. . . 62
Figure 3.26 A User Taps on an Intersection in Google Map. . . 63
Figure 3.27 A User Taps on Gray Avenue on Tiger Line Map. . . 64
Figure 3.28 A User Taps on S 4th Street on Tiger Line Map. . . 65
Figure 3.29 A User Taps on Agg Avenue on Tiger Line Map. . . 66
Figure 3.30 A User Taps on S 4th Street on Google Map. . . 67
Figure 3.31 A User Taps on Agg Avenue on Google Map. . . 68
Figure 3.32 A User Taps on 3-way Intersection on Tiger Line Map. . . 70
Figure 3.33 A User Taps on 4-way Intersection on Tiger Line Map. . . 71
Figure 3.34 A User Taps on 3-way Intersection on Google Map. . . 72
Figure 3.35 A User Taps on 4-way Intersection on Google Map. . . 73
Figure 4.1 Map of Selected Neighborhood in Ames, Iowa. . . 76
Figure 4.2 Paper Folding Test [20]. . . 77
Figure 4.3 Software Screen. . . 81
Figure 4.4 Relationship between Primary Map and Mini Map. . . 84
Figure 4.5 Mini Map in the Software Interface. . . 85
Figure 4.6 Current Location Displayed on Map. . . 85
Figure 4.7 Average Address Verification Score between 2 Datasets. . . 92
Figure 4.8 Average Address Verification Score between 2 Datasets. . . 93
Figure 4.9 Average Address Verification Score between 2 Datasets. . . 94
Figure 4.10 Average Address Verification Score between 2 Datasets. . . 95
Figure 4.11 Average Distance between 2 Datasets. . . 96
Figure 4.13 Average Distance between 2 Datasets. . . 98
Figure 5.1 UI of Study I (left) and Study II (right). . . 102
Figure 5.2 Software UI of Study II. . . 104
Figure 5.3 A Satellite Map in Study II. . . 106
Figure 5.4 Three UI Features of Study II. . . 107
Figure 5.5 A Box Plot Illustrated Address Verification Score of High and Low VZ Participants. . . 111
Figure 5.6 A Box Plot Illustrated Times of High and Low VZ Participants. . . 112
Figure 5.7 A Box Plot Illustrated Distances of High and Low VZ Participants. 113 Figure 5.8 A Box Plot Illustrated Numbers of Error Taps of High and Low VZ Participants. . . 115
Figure 5.9 A Box Plot Illustrated Numbers of Pan Taps of High and Low VZ Participants. . . 116
Figure 5.10 A Box Plot Illustrated Numbers of Zoom Taps of High and Low VZ Participants. . . 117
Figure 6.1 Ten addresses to be verified in three phases. . . 121
Figure 6.2 Participant’s Work Flow in Study III. . . 124
Figure 6.3 Traditional UI of Study III. . . 127
Figure 6.4 Address List in UI of Study III. . . 128
Figure 6.5 Quit Button in UI of Phase 3. . . 129
Figure 6.6 Major Landmarks and Minor Landmarks were located on the Mini Map. . . 130
Figure 6.7 Minor Landmarks were located on the Primary Map. . . 131
Figure 6.8 Implementation of Object-Indexing (Type I). . . 131
Figure 6.9 Implementation of Object-Indexing (Type II). . . 133
xii
Figure 6.11 Walking Paths in Phase 1 (left) and 2 (right) of a Participant. . . . 139 Figure 6.12 Addresses to be verified in Phase 1. . . 140 Figure 6.13 Addresses to be verified in Phase 2. . . 140 Figure 6.14 A Box Plot Illustrated a Time in Phase 1 (Normalized by Overall
Average) and Phase 2 for Treatment 0. . . 143 Figure 6.15 A Box plot Illustrated a Time in Phase 1 (Normalized by Overall
Average) and Phase 2 for Treatment 1. . . 145 Figure 6.16 A Box Plot Illustrated a Time in Phase 1 (Normalized by Overall
Average) for Treatment 0 and 1. . . 146 Figure 6.17 A Box Plot Illustrated a Time in Phase 2 for Treatment 0 and 1. . 147 Figure 6.18 The Set of Parameters of the Associator for Market Basket Analysis. 153 Figure 6.19 Time Used in Phase 3 by Different Groups of Participants. . . 156 Figure 6.20 Distance Used in Phase 3 by Different Groups of Participants. . . . 157
ACKNOWLEDGEMENTS
I would like to express my profound thanks to those who helped, advised, supported, and encouraged me during the time I was conducting my research and writing this disser-tation. First and foremost, Dr. Les Miller for his great patience, support, and supervision throughout this research and the writing of this dissertation. I am very grateful to be men-tored by him. I would also like to thank Dr. Wallapak Tavanapong, my co-major professor, for her kind guidance and sustenance for both research and teaching. I would also like to thank my committee members for their worthy suggestion and contribution on my work: Dr. Shashi Gadia, Dr. Johnny Wong, and Dr. Stephen Gilbert.
Without a support from my family: my mother, father, brother, and grandmother, I could not make it to the final state of my graduate study. Their suggestion and encour-agement helped me overcame all issues in the past years. I would also like to thank my workplace, the Faculty of Information and Communication Technology, Mahidol University, which is counted as my second home, for the financial assistance along six years that I had pursued my graduated degrees in the United States of America. Especially, I have a thank to Dr. Jarernsri Mitrpanont, the dean of the Faculty of Information and Communication Technology, who appointed me as the candidate of this assistantship
I would like to express my thank to Dr. Kenneth Platt and Dr. Ratree Platt, the for-mer advisers of Thai Student Association of Iowa State University, who are always be the beloved parents of every Thai student who came to Iowa State University. I would also like to thank every member of Thai Student Association of Iowa State University who made my living in Ames happy and cozy like I was in my hometown.
xiv
I would like to thank every group of my fellows that is always together with me, which consists of the group of my colleagues from my workplace, the group of my research team, and the group of my classmates and laboratory-mates
A special thank is provided to the Office of Educational Affairs, Royal Thai Embassy, for being my legal guardian during my graduated study in the United State of America.
My last thank is for both my greatest life partner and my greatest creation: Natsima Thongsuriyapong and Alanvat Andy PatanasapkPinyo, my wife and my baby boy, who always take care of me, who always love me with their whole hearts, who always back me up when I am down, and who unconditionally fulfill my life with their love and care.
ABSTRACT
Individual spatial visualization has been proved to be an important factor that impacts software usage performance, especially on location-based software, which has become a ma-jor trend in this ubiquitous computing era. Developing a solution that could enhance a location-based software to handle different users with various levels of spatial visualization abilities could yield improvement in both software usability and user performance. In this dissertation, we started by setting up an hypothesis with a goal to discover the factors that are helpful in minimizing/flattening those differences. Users with various spatial visual-ization abilities could generate a similar performance on the same software. To test this, we have run experiments to verify this claim. An application used in this study is address verification using location-based software on a portable computing device, which is a profes-sional task used by US census bureau office. We have developed an adaptive location-based software that is able to adapt its user interface in real time according to the user’s spatial visualization level.
1
CHAPTER 1. INTRODUCTION
A location-based software is an application software that has a map or similar spatial locating tools as a component. Location-based software has become an important concept of software development because of its property to consolidate the comfortable use of ap-plication software with the advantage of a map representing the current environment.
Along with location-based software, most developers pay attention to software develop-ment on portable devices such as iOS devices, Android devices, Windows Phone devices, etc. Because of the portable property and high performance requirement, portable devices have become a major player in the information technology market. Most companies also have a specific version of their software for these portable devices such as FacebookR, SkypeR, YelpR, or Weather ChannelR apps. The use of portable devices provides a perfect solu-tion for locasolu-tion-based applicasolu-tion software. Nowadays, we can find many locasolu-tion-based software applications on portable devices. Most of them have become an important part of our daily life. In addition to personal devices, many businesses and government agencies have taken advantage of location-based software in their field operations.
The usability of software on portable devices is an important issue. The fact that peo-ple are different makes it more difficult to achieve a high level of usability for all users. Some people can struggle using software because of this reason. The user’s level of spatial visualization (VZ) has been shown to be an important factor for how successful a software user is [93][110][76]. This dissertation has set up and implemented three experiments to
investigate of how individual differences, in terms of individual spatial visualization, can affect people’s performance on location-based software using portable devices. Finally, we developed an adaptive user interface software application that helped users with different skill sets, particularly high and low spatial visualization, to have competitive performance when doing a location-based task. We briefly mentioned the scope of problem, deliverables and our contributions in the remainder of this chapter.
1.1 Problem
It is well-known that people have different skills [11][18]. An interesting question is whether one universal interface design for location-based software on a portable device is effective for all types of users, high and low spatial visualization ability. Most people with low spatial ability tend to have lower performance in software usage than high spatial ability people [10]. In this dissertation, we look at factors/treatments that could help reduce this difference and how the factors/treatments might be used together to bridge the difference between users for location-based software. Our focus will be on the use of the address ver-ification task used by the Census Bureau.
Our strategy has been to develop the location-based software, which is an Android application, to be used as a tool for this address verification task. Given our strategy, we divided our experiments into three studies:
• Study I
The first study consisted of two sessions. For the first session, each participant took a Paper Folding Test [20] to evaluate their level of spatial visualization (low/high). Next, the second session asked them to verify ten addresses in the neighborhood using our location-based software application. For each participant, one treatment (out of three treatments) was randomly assigned. Each treatment deactivated one feature
3
on the user interface. Since there were three features, each participant had only two active features to use while verifying addresses. Study I was described in detail in Chapter4. The objective of Study I was to observe how different treatments impacted participant’s performance. Understanding which UI features were benefit for which type of participants (low/high spatial visualization) guided us for the development of adaptive user interface software application, which was the ultimate goal of this dissertation.
• Study II
The Study II also consisted of two sessions. The first session was the same as the first session of Study I. The second session was also similar, but there was a difference. In the second session, all three UI features were always active for every participant. In addition, a larger map size was used to make map operations easier to handle. Study II was described in detail in Chapter 5. The objective of study II was to observe how effective it was when a participant, regardless of that participant was a low or high spatial visualization person, used software that activated every UI feature all the time. Providing a software application with the same UI for every participant is referred to as universal UI software. The question was whether a larger map size and the universal UI would result in equivalent performance for both high and low VZ participants.
• Study III
The Study III also consisted of two sessions. The first session was the same as both previous studies. The difference took place in the second session where the software that participants used for address verification was adaptive UI software. The adaptive UI software can adapt its user interface by predicting participant’s level of spatial visualization. After the software got prediction result, it adapted its user interface based on that prediction result. Study III was described in detail in Chapter6. The
objective of Study III was to observe an improved performance of participants with different levels of spatial visualization when they verified addresses using the adaptive UI software application.
1.2 Deliverables
This dissertation provided five deliverables, which were:
1. Adaptive UI Application Software
We introduced new adaptive UI software application for address verification that had an ability to predict user’s spatial visualization and adapt its user interface according to that prediction result to fit each user with different spatial visualization. The adaptive UI software was described in Chapter 6.
2. New Data Structure for Map Components
We introduced a new data structure, “Object-Indexing”, that can be implemented to represent a map component. This methodology allowed any map component to have an object-oriented accessibility on a traditional raster map. Object-Indexing was described in Chapter 3.
3. Study Results
Results of Study I, Study II, and Study III were exhibited in Chapter 4, 5, and 6, respectively. For each study, we explained study design and study procedure along with its result.
4. Analysis of Performance Improvement & Prediction of VZ Level
We analyzed our results to ensure a significant improvement of participants’ perfor-mance when we assigned the adaptive UI software (Study III). This analysis was described in Chapter 6. Furthermore, we discussed the accuracy of our prediction
5
unit, which was developed to provide ‘real-time’ prediction of a user’s VZ level, in Chapter 6as well. The prediction model was built on the work of Batinov [2]. 5. Analysis of Users’ Behavior
We analyzed and extracted important features from the logs of the participants to generate the set of association rules using Market Basket technique (Chapter6).
1.3 Contributions
The contributions of the dissertation consisted of three key areas:
1. The development of our new data structure for maps that provides fast performance combined with indexable map components.
2. A suite of user interface features that provide different levels of support for users based on the predictive value of their spatial visualization level. A robust set of such features is critical for the successful development of an adaptive user interface based on the prediction of a user’s level of spatial visualization.
3. The development of the adaptive user interface software that demonstrates how pre-diction of spatial visualization and the suite of user interface features can be combined to improve the performance of a user independent of their level of spatial visualization.
The remainder of this dissertation is organized as follows: Chapter 2provided a review of the literature relevant to the dissertation. The Object-indexing fundamentals were given in Chapter3. Chapter4,5, and 6 look at an explanation of Study I, Study II, and Study III, respectively. Chapter 7summarized the results of this dissertation.
CHAPTER 2. LITERATURE REVIEW
This is the review of literature that is related to the proposed work in this dissertation proposal. This chapter is organized by topic.
2.1 The effect of individual differences on software utilization and performance
Individual differences play an important role in the interaction between humans and computers. Carroll [11] gave eight categories of human intelligence: crystallized intel-ligence, fluid intelintel-ligence, general memory and learning, broad visual perception, broad auditory perception, broad retrieval ability, broad cognitive speed, and processing speed. Carroll [11] also classified spatial ability as a factor that affects broad visual perception. Thus, among varying types of abilities, spatial ability was recognized as the most important representative for human difference. Lohman [58] defined spatial ability as “the ability to generate, retain, retrieve, and transform well-structured visual images” [Lohman, Human abilities: Their nature and measurement, p.98, 1996].
Egan [18] selected spatial ability as the most important ability for predicting human per-formance on a computer. We see similar statements in [16][18][19][110]. Egan [18] suggested that an individual’s spatial ability, memory, reasoning ability, verbal aptitude, and possibly personality played an important role in a user’s performance when accessing information on a computer.
7
Benyon et al. [6] noted that, among all types of intelligence, spatial ability was often selected for study when looking at the connection between human performance and indi-vidual differences.
B¨uring, Gerken, and Reiterer [10] created a study to understand the relationship be-tween spatial ability and the user’s performance on a zoomable user interface. In this study, there were two software screens. The first one was the screen which represented the whole information and it came with an overview window. The second screen came with only one detailed screen. The result of this study showed that the higher spatial ability participants could complete the task faster without the overview window (Search task). However, the lower spatial ability users could complete the task faster given the overview window. This study is a good example for showing a way that spatial ability can affect users. Ziefle and Bay [117] constructed an experiment by providing two types of navigation aids on a mobile device screen. The first aid was a category aid and the second one was tree aid. The cate-gory aid had a header which contained a link to subcategories. The tree aid was almost the same, except that it was able to show the links with a deeper level based on the properties of the trees. They discovered that the second option was more useful for the users with low spatial ability and older adults.
Kozlowski and Bryant [44] noted that there existed a difference between people with a good sense of direction and people with a poor sense of direction. The first group did better at pointing to unseen goals. The accuracy of the first group was also improved if the additional exposure in which orientation was emphasized was given whereas no change occurred for the poor group.
One factor to be considered when designing software for users with varying spatial abil-ity is the informative instructions on the interface. Craik and Lockhart [14] noted that the
depth processing was directly variable to the depth of the encoding. Nielson [72] suggested that minimizing user memory requirements is the appropriate way to study usability be-cause users could focus on the task on the software screen more than thinking about how to work on the task. A guided software could help by reducing the usage of a user’s memory.
The software user interface that comes with informative guidance significantly relates to the use of internal memory and the cognitive process [115]. Zhang [115] did conduct an experiment on external information and revealed that external representations had the abil-ity to impact cognitive behavior. The information that has passed from internal memory to the external display enhanced effectiveness. Zhang’s conclusion was that the external information was able to be an advantage if the use of it could compensate for the cost of that external information. van Nimwegen and van Oostendorp [108] discovered that an unguided software interface yielded better results for performance aspects than a guided software interface because the unguided software interface allowed the users to be more involved with the software. The users would have more chance to think and consider with unguided software interface. Although an issue of a guidance interface could be questioned, in our perspective, we believed that it was a matter of users and also the nature of the guid-ance used. If a user had high spatial ability, he could work well with an unguided interface which allowed him to learn the software while using it. Whereas if a user had low spatial ability but had some background knowledge about the task, a guided interface software could be a better option. Zhang and Norman [116] proposed that the representation of a cognitive task is always both internal and external. Berger, Lu, Belzer, and Voss [7] have found that if a computer system was developed for the purpose of learning by discovering, students who had higher spatial ability would get move benefit as opposed to students who had lower spatial ability. Vicente and Williges [111] published work to show that the differ-ence in software usage performance between the higher spatial ability users and the lower spatial ability users can be reduced by adding some extra guidance on the software interface.
9
Consequently, spatial ability is a vital individual difference that could be used to deter-mine the potential of software utilization and to design effective user interfaces that yield optimal results for users with different levels of spatial ability. Rusch [89] found a corre-lation between spatial visualization, and map software usage ability. The purpose of her first study was to examine the direction of the relationship between spatial ability and user performance based on alternative button layouts. The purpose of her second study was to examine whether the relationship was affected by offering task guidance. Rusch [89] made a conclusion that the good button labels could help alleviate the performance differ-ence among users with different levels of spatial ability. The differdiffer-ence between guided and unguided systems could be seen via the way that the information processing was formed. Guided systems always came with external information for guidance as to where the user was in the task. The goal of this kind of information processing was to cause the reduction of working memory usage because the users did not need to recall information to keep track of as long as they had the guidance along all steps when using the software. The strategy to design the appearance of those external information was challenging because it came with two negative effects. The first negative effect was that the software interface could come up with overkill of information, which required the users to use more working memory to digest the extra information. The second negative effect was that it reduced the chance of the user to explore and learn the software by themselves. For the unguided systems, there was no guiding information on the software screen. Any information that users gathered had to be stored in the memory, which became internal information. The advantage of internal information, or internalization, was that the user needed to do explorative learning process. Hence, recalling of information in the unguided systems was better than recalling of information in guided systems because it solely depended on the knowledge stored in the working memory. Nevertheless, the problem of internal information came when dealing with low spatial ability users. Rusch [89] concluded that unguided systems would benefit
the users with higher spatial ability which involved the effective memory usage for software interface as long as the amount of information was reasonably suitable. However, the guided systems would be the most appropriate option for the users with lower spatial ability. Both individual difference and designing the systems, regardless of unguided systems or guided systems, played a significant role in affecting the performance of users.
2.2 Interesting studies that relate to spatial ability
Spatial ability, which can be branched into multiple sub-categories such as spatial vi-sualization or spatial cognition, has been shown to be a significant factor in the success of computer users. In this section, we selected some interesting studies about spatial ability and related areas to be discussed.
Landau [51] gave a definition of spatial cognition as “Capacity to discover, mentally transform, and use spatial information about the world to achieve a variety of goals, includ-ing navigatinclud-ing through the world, identifyinclud-ing and actinclud-ing on objects, talkinclud-ing about objects and events, and using explicit symbolic representations such as maps and diagrams to com-municate about space” [Landau. “Spatial cognition.” Encyclopedia of the human brain 4, p.395-418, 2002].
Some work had been done to answer the question whether spatial ability reflected hu-man perforhu-mance. Cutmore, Hine, Maberly, Langford, and Hawgood [15] discovered that a gender matters. Based on their result, males gathered survey knowledge from the task faster than females. Moreover, the study also confirmed that more proficiency in spatial cognition resulted in better performance. Geary, Saults, Liu, and Hoard [27] found that males got higher scores than females in arithmetical computations, arithmetical reasoning, and spatial cognition measures. The reason was that males have an advantage in
computa-11
tion and spatial cognition. Although this study did not relate directly to our dissertation proposal, we can imply that a spatial ability mattered because men, which had higher score in spatial ability test, can do better in several tasks such as those authors mentioned.
Golledge and G¨arling [28] explicitly examined the relationship between cognitive maps and travel behavior. The authors noted that there was a relationship in transportation between travel behavior, path selection criteria, navigation and way finding, route learn-ing, etc. Those issues were prioritized by individual differences. Halligan, Fink, Marshall, and Vallar [30] studied the structure of spatial process and mental representation using neuropsychological syndrome of unilateral spatial neglect. Unilateral spatial neglect is neu-ropsychological condition such that a person who has brain damage to one hemisphere loses an ability to cognize one side of the body or environment. From the study, they found that the spatial cognition subserving process consisted of multiple domains and it was extensive.
Hegarty, Montello, Richardson, Ishikawa, and Lovelace [31] tested 221 participants for their psychometric measures of spatial abilities, spatial updating, verbal abilities, and work-ing memory. Their experiment consisted of learnwork-ing from real world environment, learnwork-ing from desktop virtual environment, and learning from environment provided by a videotape. This idea led our research group to design multiple platforms of maps in our study. Before this proposed study, our research group did similar experiments on Windows desktop, Win-dows Mobile device, virtual reality, and an actual survey on a paper map. Ishikawa and Montello [37] also conducted a study about spatial acquisition from direct experience in the environment by studying twenty four college students. Those participants were driven using two routes for ten weekly sessions and were asked to illustrate the routes’ spatial properties based on what they had learned. Most of them could not generate the correct result. Ishikawa, Fujiwara, Imai, and Okabe [36] worked on a study that related spatial abilities and wayfinding using a Global Positioning System (GPS) feature on mobile
nav-igation compared to a paper map approach and direct experience. The outcome showed that the GPS participants consumed more resources, such as time and distance, than the other two approaches and also provided more errors. From this study, we questioned that a participant might rely on GPS when it was active since GPS was the best landmark on any map software. This issue led us to include GPS feature as a treatment in our Study I (Chapter4) to verify its usefulness.
Klippel, Tappe, and Habel [41] investigated a process called spatial chunking. Spatial chunking is a process where users are able to combine the route segment in route direc-tion. The authors divided route directions into two types: advanced route direction and accompanying route direction. The first one was used to give the directions before travel-ing. In contrast, the second type gave the directions during traveltravel-ing. Spatial chunking was investigated for the second type. The authors noted that spatial chunking was effectively conceptual and robust and related to directional tasks.
Kuipers [47] introduced the spatial semantic hierarchy, which is a model of large scale space knowledge by integrating information from the human’s spatial cognitive map. This model could be implemented to enhance both human cognitive map and robotic applica-tions. Kuipers, Modayil, Beeson, MacMahon, and Savelli [46] extended their work to a hybrid version, which supported both small-scale space and large-scale space.
Kulhavy and Stock [49] did a study about how people learned and remembered cogni-tive maps due to the relationship between human cognicogni-tive systems and cartographic maps. In the cognitive systems, the limitation of working memory affected the performance of information acquisition and retrieval. It also solely influenced a map image regardless of the characteristics of a map [69][95]. This showed that a human’s cognitive ability causes a difference in user performance.
13
Another interesting map-based study on spatial ability was done by Lanca [50]. She did an experiment to verify whether participants created three-dimensional representations of contour maps in the process of learning and retrieving or not. The study was started by asking participants to study contour maps and landsurface maps. The author partitioned participants into four groups. For the first group, participants did both a cross-section test and a recognition test on the contour maps. For the second group, participants did a cross-section test on the contour maps and a recognition test on the landsurface maps. For the third group, participants did a cross-section test on the landsurface maps and a recognition test on the contour maps. For the last group, participants did both tests on the landsur-face maps. After studying their maps, participants were asked to recall the map they had studied. The result she found was that male participants constructed a three-dimensional representations and recognized maps better than female participants. Furthermore, three-dimensional spatial ability was also suggested as an effective skill in processing long term memory on contour maps.
Phillips [80] investigated a way to improve a readability of contour maps based on the fact that most people could do map reading better on layer tint maps than contour maps [81]. Surprisingly, the results showed that there existed no method or solution to help enhance contour map readability unless it gave a obviousness to contour maps. Thus, to avoid any readability-related effect that can occur by using a contour map, maps that we provided in our software was a layer tint version.
Liben and Downs [54] did an experiment where one adult went to any position of a classroom and pointed straight forward, then children were asked to point to location of that adult and the direction the adult was pointing to on a map. There were two versions of maps in this experiment, which were an aligned map and a 180-degree rotation map. The
result showed that most children performed well on an aligned map. Moreover, younger children failed to understand the point of view and boys did better than girls which cor-responded to the authors’ hypothesis of spatial concept of mapping. Liben, Kastens, and Stevenson [55] discussed the benefits of instructing children to use maps that were not only for navigation purposes. It was also to enhance their spatial skills. The author developed a curriculum called “Where Are We?” for teaching map navigation in school with the goal to stimulate actual experience of a real world navigation using maps.
There exists some work that is aimed to find a factor that caused spatial abilities to be different among individuals. Linn and Peterson [56] hypothesized about sex difference in spatial ability. They proposed results that sex difference affected only some types of spatial ability, mostly on mental rotation and less on spatial perception. With the evidence from this article, we can expect minimum effect from sex difference in our work because no mental rotation activities are involved. Montello, Lovelace, Golledge, and Self [66] fo-cused more on differences and similarities in geographic and environmental spatial abilities due to sex. They invited forty three females and thirty six males to perform spatial tasks. Those tasks consisted of psychometric tests, campus route learning test, map-learning tests, extent geographic knowledge test, object location memory test, verbal spatial description tests, and self-report measures. The result of the study said that males outperformed fe-males for acquiring spatial knowledge from direct experience, whereas fefe-males did better for acquiring knowledge from a map.
Voyer, Voyer, and Bryden [112] also examined sex difference with respect to spatial abilities. The authors invited participants to do tests related to spatial abilities. The result showed that there existed sex differences in the multiple tests along with other differences as well. Their conclusion was that the rate of sex differences were decreased in recent years and it also depended on types of spatial tests. However, Rapp, Culpepper, Kirkby, and
15
Morin’s [84] experiment and a result was counter to the statement that said sex difference mattered. In their study, they invited earth science students to view a map. There were three types of maps which were a map that had shading, a map that had stereo visualiza-tion (a map that supported three dimensional percepvisualiza-tion), and a map that combined both features. Students were asked line-of-sight questions and allowed to use their assigned map. The results revealed that, for this study, sex did not influence the performance of students. Factors that were involved were background characteristics, such as grade or map usage experience. This conflict was caused by a sensitivity to the type of test.
Mou and McNamara [67] investigated the role of intrinsic frames of reference in human spatial memory. Frames of reference can be thought of as a tool to help us to recognize or describe spatial information. For example, if we would like to point out a location on earth, we use a pair of latitude and longitude to be the frame of reference. Thus, spatial abil-ity, especially spatial memory, should always be defined by the concept of frame of reference.
Nadel and Hardt [68] studied the brain in respect to spatial ability. The authors stated that two types of spatial systems, which are egocentric and allocentric, had dissimilar prop-erties. An egocentric spatial system is a process that deals with objects and an environment using one’s self-center as the primary origin. But an allocentric spatial system deals with using other objects as a reference related to the environment. One example of distinguishing egocentric and allocentric was navigation using a GPS routing device in an automobile. A driver who preferred to use north-based map (traditional map) tended to have an allocentric spatial system. On the other hand, a driver who preferred to use a track-based map (see the map in the same direction as driver was currently facing) tended to have an egocentric spatial system. Marshall and Fink [60] described ongoing research work related to spatial cognition and brain functions. One interesting aspect of spatial cognition is a human’s ability to perceive a distance which was related to brain function. McNamara [63] proposed
a new spatial memory theory based on a spatial reference system, which was a system that involved people learning the spatial structure of their environment. The spatial reference system is not fixed along the learning process. It could be updated to a new one if people perceived a new correct view of their environment.
Penn [79] explored work related to space syntax theory and spatial cognition. The au-thor gave the definition of a cognitive space as a space that encourages our understanding of a visual environment. The co-presence, which was defined by the local visual field and the way that the configuration applied movement routes, influences the effect of spatial configuration in both structural communication and transactions between persons.
Remolina and Kuipers [87] proposed a theory on topological maps. The difference be-tween causal maps and topological maps was that topological maps were a way to represent spatial information in a graph where a node represented a state of an agent’s vocabularies and an edge represented a traversal path from one state to another state. However, the representation of each topological map was based on the application. The author pointed out that there were three elements that were common among topological maps. Those were the use of sensory descriptions to identify each node, the use of relations among nodes, and local metrical information that was linked to edges.
Tversky [105] analyzed the characteristics of maps and how they answered what hu-mans needed to represent spatial information. The author noted that maps consisted of five characteristics. The first characteristic was that maps were two-dimensional. For cog-nitive achievement, humans created two-dimensional representations for three-dimensional environments and three-dimensional illustrations were difficult to construct and handle. Second, maps ignored information. Third, maps were regularized. Fourth, maps provided inconsistent scale and perspective. The obvious example of this characteristic is the
tra-17
ditional world map that we frequently see on classroom boards. Last, the map contained a message, for example; aesthetic, political, spiritual, and humorous. Thus, in terms of spatial representation, effective communication had higher priority than correctness as long as it satisfied human cognition.
So, we turn our focus to the question: why is a map an important tool in the study area of cognitive, learning memory and spatial ability? A map is one type of graphic, which was used to represent real entities such as objects, places, or environments. Tversky, Morrison, and Betrancourt [106] mentioned that the graphic has been used to illustrate both inher-ently spatiovisual data such as maps or floor plans and metaphorically spatiovisual, such as organization charts or mind maps. With the visual-oriented property, graphics literally increase human potential in inference, communication, learning, and memory. Moreover, computer systems that were difficult for users could be understandable by graphics. Maps, which simply are a representation of the real world environment, could be an effective mea-surement when we were dealing with spatial visualization.
In 2000, Uttal [107] studied the relation between map use and spatial cognition de-velopment. The author invited children to participate in his experiment. He found that learning from maps helped children to develop their spatial cognition and also helped them understand the concept of space. A significant difference between this style of learning and learning from one’s direct environment also exists. Furthermore, large-scale spatial learning was also observed via map use.
Kim and Penn [40] investigated the relationship between spatial syntax of cognitive maps and the real environment by asking the residents of Hampstead Garden Suburb to participate in sketching cognitive maps of their place. The result of this study found that the relationship between spatial syntax in cognitive maps and the real world environment
was positive. What can implied from this study was that handling a map was a significant activity that depended on human spatial ability or spatial visualization in particular.
Zipf and Richter [118] also mentioned the importance of maps as an effective representa-tion material for spatial knowledge. Geographic Informarepresenta-tion Systems (GIS), which support the implementation of maps as feature of a software system, are very popular in multiple task units.
2.3 Impact of spatial visualization (VZ) in computer-based applications
There were several abilities that were categorized as spatial ability. Spatial visualization (VZ) was one of them. In this dissertation, we aimed to develop an adaptive user interface software for users with different level of VZ.
Salthouse, Babcock, Mitchell, Palmon, and Skovronek [90] defined VZ as “mental ma-nipulation of spatial information to determine how a given spatial configuration would ap-pear if portions of that configuration were to be rotated, folded, repositioned or otherwise transformed” in their study report [Salthouse, Timothy A., et al. “Sources of individual differences in spatial visualization ability.” Intelligence 14.2 (1990): 187-230]. They did two studies to find sources of differences in VZ. For the first study, there were fifty participants. Each participant participated in five sessions. In the first session, a participant was asked to do four paper-and-pencil tests and the WAIS-R Block Design. A participant was asked to do a working memory task and paper folding task in session 2. In session 3, a participant did cube folding and block design tasks. A participant did a task of cube comparison in session 4. The spatial integration task was done in session 5. For each test, a participant could score based on number of corrected items/answers. A result of the first study did lead them to a hypothesis that differences in VZ played a major role in differences in internal
19
representation quality. This hypothesis drove them to do the second study to find more deeper detail by comparing multiple characteristics of people with both high and low VZ. From study 2, they found that diversification in VZ did not correspond to diversification of encoding spatial information ability nor properties of information.
Norman [74] defined an impact of VZ to computer-based technology usage performance as “The primary cognitive factor driving differences in performance using computer-based technology is spatial visualization ability” [Norman, Kent L. “Spatial visualization - A gate-way to computer-based technology.” Journal of Special Education Technology 12.3 (1994): 195-206]. In his experiment, he wanted to find out which technique was the best to compen-sate low VZ people. Those four techniques werespatial metaphors, graphical user interface, interface apparency, and interface manipulatability. The spatial metaphor was a technique that encouraged users to think of metaphors of system UI. For instance, users could view a UI of WYSIWYG word processor software as a classic typewriter. This technique could help users to recall their past experience to help improving their performance. The graph-ical user interface was a technique that implementing a software interface using spatial representation object such as buttons, sliders, switches, etc. The interface apparency was a technique that designing a graphical user interface that made relationship among items on an interface visible to users, which could be done in many ways. A good example of the interface apparency technique was to use a graph or a diagram. The interface ma-nipulatability was a technique that reducing/decreasing components that required spatial processing off an interface. This could be done by creating an interface that allowed users to directly handle any spatial item on the interface. He discovered that the latter technique was the best to compensate users with low VZ. Multiple literatures found that VZ was an important factor, which could be used as a predictor for success in real-world applications including software usage performance [59][62][96][26].
Salthouse, Babcock, Skovronek, Mitchell, and Palmon [91] questioned whether people with different age and experience would have different VZ. They did studies to confirm a hypothesis that for adults, age was inverse variation with VZ regardless of their VZ experi-ence. Their studies consisted of three studies. For the first study, they asked participants to do four tests of VZ: foam board test, paper folding test, surface development test, and cube comparison test. All of them were paper-and-pencils tests. In the second study, participants were asked to do extra four computer-controlled tasks. Those extra tasks were the paper-folding task, the cube-paper-folding task, the spatial-integration task, and the cube-comparison task. The third study contains the surface-development task, the paper-folding task, and the spatial-integration task. The last two tasks were computer-controlled. According to these studies, they concluded that if an age was increased, then, a level of VZ was dropped. This assumption was also true regardless of previous experience about VZ.
Age was not the only factor that differentiated VZ, sex difference also did [56][112][34][61]. Kaufman [38] did a study to find that a difference in working memory capacity between different genders involved in this inequality of VZ or not. He did tests of three-dimensional mental rotation and VZ together with tests of spatial working memory and verbal working memory. A result revealed that spatial working memory engagement was a reason that made different VZ between genders.
2.4 The location-based survey software
Location-based software is an application software that has a location in terms of a pair of geographic coordinates as preliminary data or input data to the computing process. Most location-based software helps improve a user’s task or comfortability. The examples of these applications are Google MapR, Bing MapR, GPS-navigation software, YelpR, etc. In the academic field, location-based software is also an interesting research topic. The address
21
verification task is a procedure used by the Bureau of Census where participants are asked to verify whether the street address indicator on a map exists and if so is it in the correct position. Whitney, Batinov, Miller, Nusser, and Ashenfelter [113] conducted a study to see whether different levels of cognitive ability affected performance for the address verification task. They used three tests to identify a participant’s level of cognitive ability, which were a spatial visualization test, a visual memory test, and a perspective-taking test. They pro-vided a paper map for participants to verify street addresses in the real neighborhood.
Willis, H¨olscher, Wilbertz, and Li [114] did a study to compare the spatial knowledge acquisition with different sources: paper maps and mobile maps by two groups of partic-ipants. The first group was assigned a task to learn an environment from a paper map. Another group was assigned a mobile map. The participants with mobile maps did worse on the task of distance estimation. What we can imply from this study is that the map software with different map size affected the usability.
In 2012, Chellappan [12] developed a location-based map application on the Microsoft Windows Presentation Foundation platform. The software focused on the way to apply the concept of an object-oriented design to map components. The software read the ESRI Shapefiles for the map space and then created objects representing all map components such as streets or rivers. On the software interface, it drew geometrical objects to render these map components. Each geometrical object rendered each map component object one by one. However, because the application had to read the Shapefiles every time it did per-form a map operation, it did tend to be rather slow. Thus, when dealing with large size of Shapefiles, this overhead caused significant impact on the performance of the software. Anytime the user would like to pan/zoom the map, the application would re-process and re-draw the map again. It should be noted that our Object-Indexing described in Chapter 3 has been built on the objects defined by Chellappan.
Some studies have attempted to find the relationship between the location-based soft-ware and individual difference. Batinov, Whitney, Miller, Nusser, Stanfill, and Ashenfelter [3] examined the impact of spatial ability of diverse users by asking them to use their soft-ware in two environments: the real world environment and the virtual environment. They created two regression models for time and distance, respectively. For both regression mod-els, spatial visualization was a significant metric. For the regression model for distance, an interaction between the environment (real or virtual environment) and spatial visualiza-tion was suggestive. The result revealed that there was no significant difference between low spatial ability participants and high spatial ability participants based on the type of environment. Thus, they found that spatial visualization is a significant factor from the study.
2.5 The adaptive user interfaces (AUI) and problems that lead to it
An adaptive user interface (AUI) is one kind of user interface that has the ability to adapt itself to the level of skills of the user. The purpose of an adaptive user interface is to help minimize the gap between users with different capabilities and software. Varying user ability is an important part that needs to be considered for developing application software. Benyon [4] stated that understanding the individual differences between users was impor-tant in terms of increasing the usability for users with different spatial ability. Stanney and Salvendy [97] conducted a study to assign the searching task to users with high and low spatial ability. They found that the lower spatial ability group would be assisted by visual mediators. The result showed that the use of a visualization technique to assist the low spatial ability users yielded better software usage performance.
Benyon, Innocent, and Murray [5] defined an adaptive system as “Adaptive systems are systems which can alter aspects of their structure, functionality or interface in order to
23
accommodate the differing needs of individuals or groups of users and the changing needs of users over time” [5].
Ramalingam [83] pointed out the dissimilarity between adaptive user interfaces and adaptable user interfaces. Adaptable user interface was a user interface that users were given the options, whether directly or indirectly, to select among set of multiple possible outputs of interface. Whereas, an adaptive user interface might or might not be fully con-trolled by users.
Schmidt, Beigl, and Gellersen [92] mentioned the importance of the surrounding infor-mation as the parameter used to approximate context, which they used to develop context-aware applications. They proposed two implementations, which consisted of a light-sensitive display and an orientation-aware PDA interface. Both were using a sensor technology to implement. For a light-sensitive display, they attached the light sensor to the PDA de-vice (Palm Pilot). When the light sensor sent information about the light condition to the software, the software display adapted its backlight based on retrieved information. For an orientation-aware PDA interface, they attached the sensor to another PDA device (Newton MessagePad) to detect the device’s orientation. So the orientation of the software user interface rotated the same way as the orientation of the PDA. Extending their two implementations of sensor, they presented a new approach to move to the next level of context that was more abstract than light condition or orientation. For example, a user interface should adapt based on whether a software was used indoor or outdoor, etc. With this approach, they used a concept of multi-sensory context-awareness, which consisted of four components. Those four components were sensor, cues, context, and scripting layer. The data from the four components were combined to answer what is the current context (e.g. indoor) for further user interface adapting. For example, if a context is “indoor”, com-bined data from the four components might consist of artificial light, room temperature, etc.
A number of studies and experiments concerning designing the interface based on indi-vidual differences have been developed. Newell and Gregor [71] proposed a new paradigm for developing software interfaces by considering universal access, which included users with disabilities. Keates, Clarkson, and Robinson [39] presented the cutting edge methodological approach for interface design, which was called “Inclusive Interface Design”. The purposed of this approach was to design a user interface that could support users with varying capa-bilities.
Pattison and Stedmon [78] suggested the way to implement an inclusive design is to de-sign a mobile phone for older users. This kind of user had different requirements compared to younger users because of these factors: vision, hearing, motor function, and cognitive aspects of aging.
Ramachandran [82] used two adaptation techniques in order to develop an adaptive user interface for health care applications, which were “adaptive presentation” and “adap-tive navigation”. The objec“adap-tive of adap“adap-tive presentation was to personalize a content to be displayed to different types of users. The objective of adaptive navigation was to customize the way to do the task based on task types and users. The example of how adaptive pre-sentation worked was that if there was an input “anesthesia level” to the software system in the process of creating a patient’s profile, this input mattered to doctor users. Thus, the system showed this input to doctors. Whereas the system did not show it to system administrator users because system administrator users can do nothing about this type of input. Another example was the example of adaptive navigation. If there was a section “blood test” in the system, the system should display a single page to administrator users in order for administrators to create a patient’s profile. Whereas it should display multiple tabs to the doctor who were in charge of the blood test task.
25
Findlater and McGrenere [22] conducted a study to compare the preference between three kinds of software user interfaces, which were static menus, adaptable (user-controlled) menus, and adaptive (system-controlled) menus. The results showed that the static method was faster than the remaining methods but the adaptable and adaptive user interfaces gained the advantage in terms of customization and flexibility.
Rogers, Fiechter, and Thompson [88] investigated the effect of adaptive user interfaces in an automobile system. They provided three adaptive user interface systems, which were Adaptive Route Advisor, Adaptive News Reader, and Adaptive Place Advisor. The ob-jectives of these systems were, respectively, to navigate, to read news and stories, and to select the restaurant. These systems gathered information from the interaction between the driver and the user interface. They created a user model and adjusted the interface based on the driver preference. The purpose of this study was to show that replacing original tasks while driving a car with adaptive user interface could reduce the risk of accidents. With this study, a driver did not need to use a smartphone (while driving) to find a restau-rant address nor take a look at a GPS. Those activities were replaced with adaptive user interface system functions.
Kules [48] suggested multiple methods about modeling user behavior and adaptive soft-ware systems. One of those methods was to design the adaptive user interface using the analysis of user behavior modeling.
Ramalingam [83] noted that a rigorous solution that could deal with an adaptive user interface and individual differences was to develop the software that was capable of adjust-ing and adaptadjust-ing its interface based on user preference as well as individual difference. The automated adaptive system became essential because of the diversity of factors.
Langley [52] described the effort to develop adaptive user interface using machine learn-ing techniques. Horvitz, Breese, Heckerman, Hovel, and Rommelse [33] implemented a Bayesian user model on the interaction and background of the users to create an intelli-gent user interface. Bahanovic (1998) constructed a simulation of systems that applied two strategies to return the related documents based on the content and the learning process from the user model. Liu, Wong, and Hui [57] designed a dynamic adaptive user interface that learned user behavior and provided the adaptive assistance based on such behavior.
Viano et al. [109] introduced an Auto-Adaptive Multimedia Interface. This kind of adaptive user interface approach supported the adaptability of the user interface, which could enhance usability as well. The purpose of this study was to overcome the problem of a tradition multimedia interface that was narrow and limited, which could support only a few types of presentation (visual and auditory) and lack of adaptivity. So it could not handle an emergency situation such as a very high rate of input data stream. The Auto-Adaptive Multimedia Interface was developed using collaboration with an intelligent agent. In this project, the method of Auto-Adaptive Multimedia Interface tried to map between the process data and MMI (multimedia interface) objects. The consequence of this mapping was that the system (which was called “AMEBICA”) can dynamically select the type of presentation used in the user interface corresponding to the situation occurring in real time. In particular, in chaotic situations the user interface greatly simplified what the user saw in the interface.
Gajos, Czerwinski, Tan, and Weld [24] set up two experiments with three adaptive graphical interfaces and concluded that there were multiple factors that impacted the ac-ceptance of adaptive user interface. They suggested that the adaptive user interface that duplicated frequently-used functions enhanced the user performance and improved
satisfac-27
tion. Shankar, Louis, Dascalu, Hayes, Houmanfer [94] conducted a user study to examine whether an adaptive user interface could adapt itself based on the users’ environment and whether it would improve usability and user experience.
Sukaviriya and Foley [100] examined how adaptive help support could be extended in a knowledge-based user interface environment. They designed a framework called “User In-terface Design Environment (UIDE)”. This framework can provide a suggestion to adaptive user interface features, such as adapting menus and a layout of dialog box, by combining knowledge model and collected information from users. The result of using UIDE was that it suggested two useful solutions to implement an adaptive user interface. The first solution for an adaptive interface was recognizing menus, dialog boxes, and macro suggestions. The second solution was an adaptive help for users.
Innocent [35] mentioned the trend in software development to be more natural and support interactive systems. The idea of self-adaptive systems and its condition was also discussed.
K¨uhme [45] introduced an approach to design an adaptive interface software which al-lowed users to tell the system how to adapt itself. An approach consisted of an adaptive adaptation and implicit adaptation. This work could lead to the implementation guidance of a map-based survey software in which the software itself can interact with users so users can inform the system when they get lost.
Fischer [23] reviewed the HCI-related research about user modeling for an adaptive soft-ware to make it be able to perform the task appropriately with different-skill users. Norcio and Stanley [73] suggested that an adaptive interface has to encompass knowledge of the interaction, the system, the task domain and the user. Their efforts to delineate information
for both humans and computers was important for developing effective human-computer systems. The problem that came with this approach was that the range of adaptive behav-ior was narrow.
Mezhoudi [64] implemented a Rule Management Engine to enhance the interaction be-tween a user and the user interface. The concept of the work was to allow users to instruct the adaptation strategies based on the feedback from users.
Miller and Thomas [65] identified behavioral problems that they linked to the usage of interactive computer systems by non-professional general users into two topics: System Characteristics and Interface Characteristics. Langley [52] suggested using machine learn-ing to help create an adaptive user interface. The outcome of the study was that there were two characteristics of adaptive user interface that could distinguish it from general user interface, those were informative interface and general interface. The limitation of domain has still been the issue with this improvement.
Ramalingam [83] mentioned that most field tasks are location-based software applica-tions because they provided an advantage to the workers in the field. However, implementing location-based software applications involve multiple issues, such as the screen size of the computing device, the difference of the individual user abilities, or the extreme conditions such as the unexpected incidents of the environment, for instance, the weather condition and the visibility condition. The software that can support an adaptive user interface might be the solution for this problem. The advantage of the adaptive user interface is that it helps promote the effective use of the software in the critical situations.
In the same study, Ramalingam [83] also proposed that one way to develop software with an adaptive user interface was to build on Taylor et al.’s [102] error model. The