Lawrence Berkeley National Laboratory
Recent Work
Title
System-level key performance indicators for building performance evaluation
Permalink
https://escholarship.org/uc/item/417235ks
Journal
Energy and Buildings, 209
ISSN
0378-7788
Authors
Li, H
Hong, T
Lee, SH
et al.
Publication Date
2020-02-15
DOI
10.1016/j.enbuild.2019.109703
Peer reviewed
eScholarship.org
Powered by the California Digital Library
DOI: 10.1016/j.enbuild.2019.109703
System-level Key Performance Indicators
for Building Performance Evaluation
Han Li
1, Tianzhen Hong
1, Sang Hoon Lee
1, Marina Sofos
21
Lawrence Berkeley National Laboratory, Berkeley, CA,
USA
2
Building Technologies Office, Department of Energy,
Washington DC, USA
Energy Technologies Area
Disclaimer:
This document was prepared as an account of work sponsored by the United States Government. While this
document is believed to contain correct information, neither the United States Government nor any agency
thereof, nor the Regents of the University of California, nor any of their employees, makes any warranty,
express or implied, or assumes any legal responsibility for the accuracy, completeness, or usefulness of any
information, apparatus, product, or process disclosed, or represents that its use would not infringe privately
owned rights. Reference herein to any specific commercial product, process, or service by its trade name,
trademark, manufacturer, or otherwise, does not necessarily constitute or imply its endorsement,
recommendation, or favoring by the United States Government or any agency thereof, or the Regents of the
University of California. The views and opinions of authors expressed herein do not necessarily state or
reflect those of the United States Government or any agency thereof or the Regents of the University of
California.
System-level Key Performance Indicators for
Building Performance Evaluation
Han Li
1, Tianzhen Hong
1,*, Sang Hoon Lee
1, Marina Sofos
21
Lawrence Berkeley National Laboratory, Berkeley, California, USA
2Building Technologies Office, Department of Energy, Washington DC, USA
*Corresponding Author: [email protected]
Abstract
Quantifying building energy performance through the development and use of key performance indicators (KPIs) is an essential step in achieving energy saving goals in both new and existing buildings. Current methods used to evaluate improvements, however, are not well represented at the system-level (e.g., lighting, plug-loads, HVAC, service water heating). Instead, they are typically only either measured at the whole building level (e.g., energy use intensity) or at the equipment level (e.g., chiller efficiency coefficient of performance (COP)) with limited insights for benchmarking and diagnosing deviations in performance of aggregated equipment that delivers a specific service to a building (e.g., space heating, lighting). The increasing installation of sensors and meters in buildings makes the evaluation of building performance at the system level more feasible through improved data collection. Leveraging this opportunity, this study introduces a set of system-level KPIs, which cover four major end-use systems in buildings: lighting, MELs (Miscellaneous Electric Loads, aka plug loads), HVAC (heating, ventilation, and air-conditioning), and SWH (service water heating), and their eleven subsystems. The system KPIs are formulated in a new context to represent various types of performance, including energy use, peak demand, load shape, occupant thermal comfort and visual comfort, ventilation, and water use. This paper also presents a database of system KPIs using the EnergyPlus simulation results of 16 USDOE prototype commercial building models across four vintages and five climate zones. These system KPIs, although originally developed for office buildings, can be applied to other building types with some adjustment or extension. Potential applications of system KPIs for system performance benchmarking and diagnostics, code compliance, and measurement and verification are discussed. Keywords: Building energy performance; System efficiency; Key performance indicator; energy use; energy benchmarking; performance diagnostics
1. Introduction
Building energy use accounts for more than one-third of the total primary energy consumption worldwide [1]. Studies [2] show that the ratio of building energy consumption to total primary energy consumption is steadily increasing in both the U.S. and China, which combined account for over 27% of the total global energy consumption. The adoption of energy efficiency measures (e.g., installing new heat pumps, tuning temperature set-points through improved control logic) can reduce energy use in buildings. In fact, energy savings of around 20% have been demonstrated through such measures without compromising building services and occupant comfort [3,4]. With emerging technologies, an average of 36% (with a range of 23% to 60%) energy savings could be achieved in commercial buildings [5]. Quantifying building performance with respect to energy use is an essential baseline for assessing any potential savings along with evaluating and validating improvements. In new constructions, this information is useful to the planning, design, construction, and commissioning phases. In existing buildings, quantifying baseline energy performance is necessary when performing fault detection and diagnostics (FDD), retro-commissioning, and measurement and verification, along with making retrofit decisions. Accurately assessing baseline energy performance, however, is challenging in buildings due to the complexity of the building stock (e.g.,
building type, climate zones, vintage), configurations (e.g., types of building services, system operations, control strategies), and stochastic variables (e.g., weather conditions, occupant actions).
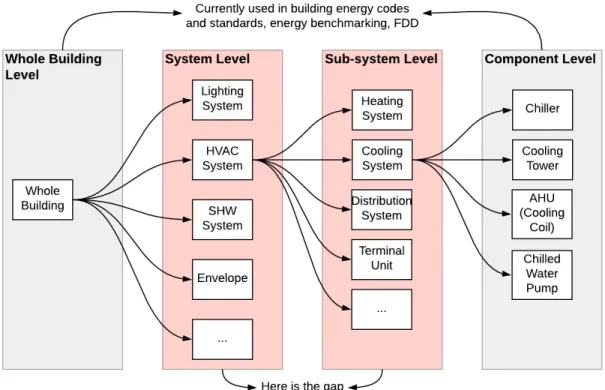
The assessment of building performance can be conducted at three levels that correspond with the hierarchical nature of building services themselves (i.e., the whole-building level, the system or service level, and the component or equipment level). For this study, a system refers to an aggregation of individual equipment and components (e.g., pipes and ducts) that delivers a particular building service (e.g., lighting, heating, cooling, ventilation, service hot water, or miscellaneous electronic equipment). Components are the individual equipment that comprises building systems (e.g., lighting fixtures in a lighting system, chiller and boiler in an HVAC system). Assessments are also classified into two types [3]: (1) Feature-specific methods, which check if specific energy efficiency technologies are implemented in the building. This approach is usually achieved through building audits; (2) Performance-based methods, which are considered more precise and quantitative than feature-specific methods, use quantifiable indicators like energy use intensity (EUI) and compare a building to a baseline model such as the one compliant with ASHRAE 90.1 standards.
This study first reviews existing KPIs and identifies the gap in KPIs at the system-level compared to the whole-building and individual component levels. Based on these findings, a suite of system KPIs are formulated for four major end-use systems (i.e., lighting, MELs, HVAC, and SWH). Finally, a KPI database derived from simulated results is presented with examples of use cases demonstrated.
2 Review of Building Performance Indicators
Literature shows efforts in quantifying building energy performance using the performance-based approach at building level [5–7], system level [8,9], and component level [10,11]. This section summarizes the commonly used performance indicators and their acronyms, types, example applications, and related studies at those three levels.
2.1 Building-level performance indicators
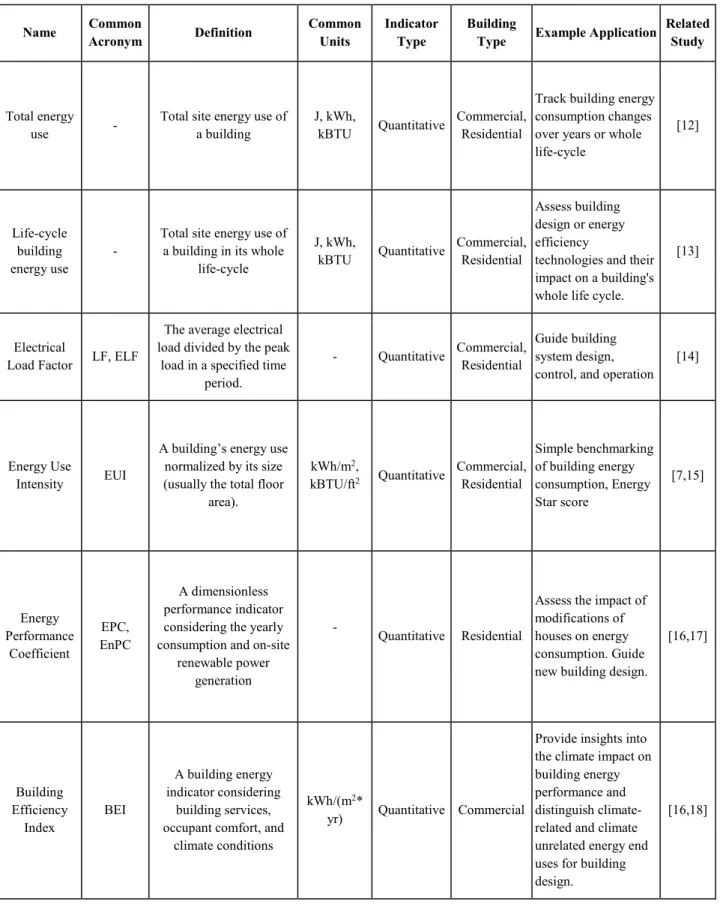
Whole building-level performance indicators are most commonly developed for use in rating and certification systems when implementing building energy codes and standards. Table 1 summarizes the most common building-level performance indicators from recently published literature. These indicators vary from ones used for simple and fast benchmarking (e.g., total site energy use or EUI) that require minimal data and knowledge of the building, to ones used for detailed building performance ratings (e.g., energy performance coefficient, climate/building efficiency indices, electrical load factors) that require more detailed data and consider internal (e.g., building characteristics, occupancy, operation schedules) and external building conditions (e.g., weather, on-site renewable generation, interactions with the grid) to provide more insights into how a building performs with a more reasonable benchmark for comparison. Whole-building level indicators can also come in the form of numerical scales (0~100) or categorical labels (poor, typical, good) for rating and certification purposes (e.g., EnergyStar Score, Zero Energy Performance Index (zEPI Index), Home Energy Rating System Index (HERS Index), Smart Readiness Indicator (SRI), Whole Building Performance Indicator, and LEED Certification) that require even more complex data input about both the building as a whole and its corresponding systems or services. In general, however, whole-building level performance indicators provide a snapshot of overall building energy performance through high-level benchmarking and tracking. However, they provide limited insight into why a building performs well or poorly at a more detailed level. To assess and diagnose the building performance with a higher resolution, system-level and component-level evaluations are necessary.
Table 1 Whole-building-level energy performance indicators
Name Acronym Common Definition Common Units Indicator Type Building Type Example Application Related Study
Total energy
use - Total site energy use of a building J, kWh, kBTU Quantitative Commercial, Residential
Track building energy consumption changes over years or whole life-cycle
[12]
Life-cycle building
energy use -
Total site energy use of a building in its whole
life-cycle
J, kWh,
kBTU Quantitative Commercial, Residential
Assess building design or energy efficiency
technologies and their impact on a building's whole life cycle.
[13]
Electrical
Load Factor LF, ELF
The average electrical load divided by the peak
load in a specified time period.
- Quantitative Commercial, Residential Guide building system design,
control, and operation [14]
Energy Use
Intensity EUI
A building’s energy use normalized by its size (usually the total floor
area).
kWh/m2,
kBTU/ft2 Quantitative Commercial, Residential
Simple benchmarking of building energy consumption, Energy Star score [7,15] Energy Performance Coefficient EPC, EnPC A dimensionless performance indicator considering the yearly consumption and on-site
renewable power generation
- Quantitative Residential
Assess the impact of modifications of houses on energy consumption. Guide new building design.
[16,17] Building Efficiency Index BEI A building energy indicator considering building services, occupant comfort, and
climate conditions
kWh/(m2*
yr) Quantitative Commercial
Provide insights into the climate impact on building energy performance and distinguish climate-related and climate unrelated energy end uses for building design.
EnergyStar Score -
A 1-100 scale score comparing target building with similar buildings nationwide normalized by business activities (the bigger the better)
- Rating Score Commercial EPA Energy Star Portfolio Manager -
Zero Energy Performance
Index zEPI Index
A rating score indicating how likely a building is to be net zero (the smaller the closer to net zero)
- Rating Score Commercial NBI zero building performance
evaluation [19] Home Energy Rating System Index HERS Index An industry standard and nationally recognized system for inspecting and calculating a home’s energy performance.
- Rating Score Residential
Predict annual home energy consumption. Guide energy efficiency improvements. [20,21] Smart Readiness Indicator SRI
A score that indicates the readiness of a building to adapt operations to the needs of occupant and also to optimize energy efficiency and energy flexibility.
- Rating Score Commercial, Residential
Guide "smart building" design and energy efficiency improvement in existing buildings. [22] Whole Building Performance Indicator - An aggregated performance indicator considering lighting, thermal comfort, maintenance, and indoor air quality
- Rating Score Commercial A web-based building assessment toolkit [23]
LEED
Certification -
A rating system for design, construction and operation of buildings, homes, and
neighborhoods.
- Certification Commercial, Residential Assess the new building performance -
2.2 System-level performance indicators
Evaluating building energy performance at the system level has been historically difficult due to the lack of sensing and metering infrastructure that collect environmental parameters (e.g., at zone level) and energy consumption (e.g., time-interval submetering of HVAC, lighting, and plug-load electricity consumption) at a more granular level. The increased adoption of building automation systems (BAS) and advanced metering infrastructure (AMI) [24–26] through performance improvements and cost reductions, however, has enabled additional data collection necessary
for further investigation of developing performance indicators and exploring efficiency opportunities at the system level. Recently, system-level energy efficiency has gained more attention, as it exhibits higher saving potentials by considering not only the performance of single components, but also the total performance of components in a system [27]. Initial efforts in defining system-level performance indicators vary in their goals, scopes, and methodologies. [28] proposed performance indicators for HVAC systems at four aggregation levels. The indicators focus on reflecting the heating and cooling supply efficiency at an annual level. The indicators do not catch the temporal performance variations. [8,9] defined a set of system KPIs which cover building design and operation phases. However, some of the KPIs are qualitative and lack the systematic description of how to derive the KPI values from the sensor and meter data in buildings. [29] developed the Total System Performance Ratio (TSPR) which is defined as the ratio of the sum of a building’s annual heating and cooling load in thousands of Btus to the sum of the annual cost in dollars of energy consumed by the building HVAC systems. The TSPR is implemented in the Washington State Energy Code as a performance-based compliance path for HVAC systems. It is also integrated into the U.S. Department of Energy’s Building Asset Score Tool [30], which facilitates building design team’s effort who wish to pursue the system compliance path.
Despite the benefits of a system-level approach and those initial efforts, limitations still exist due to the difficulty in quantifying energy efficiency at the system-level according to the Alliance to Save Energy’s (ASE) System Efficiency Initiative (SEI) [27,31]. First, the existing system-level indicators have a narrow focus and coverage. Most of them focus on energy efficiency of a specific end-use system, while ignoring the system’s ability to respond to actual demand and control strategy. Secondly, the sensor/meter data needed to derive the KPIs are not clearly stated in the definition of KPIs. Another limitation involves the lack of accurate system-level models and compliance paths for building energy codes to quantify energy use at the system-level. For example, the HVAC duct systems are modeled with simplifications in EnergyPlus. The detailed airflow, friction losses, pressure drop, and duct leakage cannot be modeled physically, making it hard to quantify the performance at the system-level.
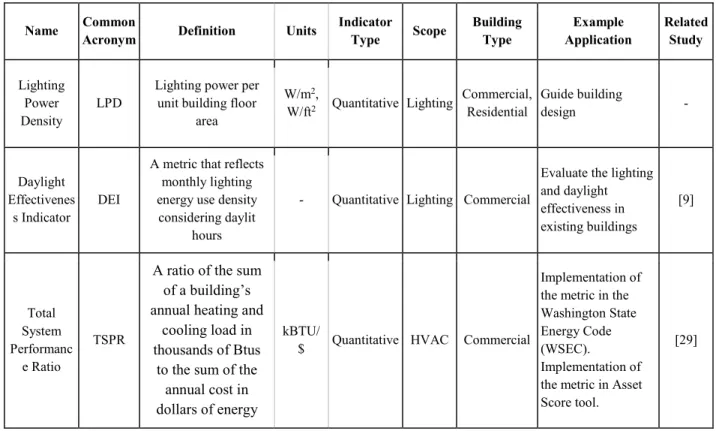
The major building systems in commercial buildings include lighting, HVAC, MELs, and SWH. Table 2
summarizes the most common system-level performance indicators.
Table 2 System-level energy performance indicators
Name Common Acronym Definition Units Indicator Type Scope Building Type Application Example Related Study Lighting
Power
Density LPD
Lighting power per unit building floor
area
W/m2,
W/ft2 Quantitative Lighting Commercial, Residential Guide building design -
Daylight Effectivenes
s Indicator DEI
A metric that reflects monthly lighting energy use density considering daylit
hours
- Quantitative Lighting Commercial
Evaluate the lighting and daylight effectiveness in existing buildings [9] Total System Performanc e Ratio TSPR
A ratio of the sum of a building’s annual heating and
cooling load in thousands of Btus
to the sum of the annual cost in dollars of energy
kBTU/
$ Quantitative HVAC Commercial
Implementation of the metric in the Washington State Energy Code (WSEC). Implementation of the metric in Asset Score tool.
consumed by the building HVAC systems. HVAC Operational Consistency Indicator - A metric reflecting the HVAC operation
effectiveness undering varying weather conditions.
- Qualitative HVAC Commercial
Help to evaluate and benchmark the HVAC system operation and control strategies under certain weather conditions. [9] Load Energy Ratio LER
The ratio of real total cooling/heating systems loads to the
total system energy consumption to meet
the loads.
kW/to
n Quantitative HVAC Commercial
Evaluate the heating or cooling system
efficiency [32]
HVAC Energy
Efficiency η(HVAC)
The ratio of total HVAC ideal demand
to the total HVAC actual energy use
- Quantitative HVAC Commercial, Residential
Evaluate the total HVAC energy efficiency with calculated heating and cooling demand.
[28]
Plug-load Off-hours
Ratio -
The ratio of plug-load energy consumption
during off-hours to the total plug-load
consumption
Quantitative Plug-load Commercial Help to identify idle plug-load energy consumption. [8]
The TSPR indicator is an exemplar of how system-level efficiency approach could be both implemented technically and integrated into the regulation policies. However, it is only applicable to HVAC systems and does not reflect the system’s performance except for energy efficiency. Other energy performance criteria such as the peak demand of the system. The review indicates that there is still a lack of system-level performance indicators with the consideration of performance evaluation criteria other than energy efficiency. For instance, the indicators that reflect the system’s peak power demand, responsiveness to occupants’ demand, and responsiveness to control are also important yet missing. Section 3 of this paper describes what aspects a comprehensive suite of system-level KPIs should cover and why they are helpful.
Figure 1. Overview of performance representation at the whole building, system and component levels
2.3 Component-level performance indicators
Table 3 summarizes the most common component-level performance indicators from the literature review. This category of performance indicators is fairly mature due to their use in assessing compliance towards building energy codes. In the United States, for example, ASHRAE Standard 90 includes a list of requirements of minimum efficiency level of equipment, known as the “prescriptive path” for achieving code compliance. The establishment of an equipment efficiency indicator requires a clear definition of the performance indicator, standardized test procedure, and independent certification of the equipment.
Table 3 Component-level energy performance indicators
Name Common Acronym Definition Units Indicator Type Scope Application Example Related Study
Coefficient of
Performance COP
Cooling: The ratio of the rate of heat removal to the
rate of energy input of a complete refrigerating system. Heating: The ratio of the rate of heat delivered to the rate of energy input
of a complete heat pump system. - Quantitative HVAC Building energy simulations. Design and sizing of building system. Fault detection and diagnostics.
Energy Efficiency
Ratio EER
The ratio of the cooling capacity to the power input,
measured in a constant condition without considering seasonal teamperature changes. BTU/h /W Quantitative HVAC Building energy simulations. Design and sizing of building system. Fault detection and diagnostics. - Seasonal Energy Efficiency Ratio SEER
The ratio of output cooling energy from the chiller to
electrical input energy considering the varied outdoor air temperature.
BTU/ Wh Quantitative HVAC Building energy simulations. Design and sizing of building system. Fault detection and diagnostics. - Heating Seasonal Performance Factor HSPF
The ratio of output heating energy from the heat pump to electrical input energy
considering the varied outdoor air temperature.
BTU/ Wh Quantitative HVAC Building energy simulations. Design and sizing of building system. Fault detection and diagnostics. - Integrated Part Load Value IPLV A single-number expressing integrated part-load efficiency of air-conditioning or heat pump
equipment weighted on different part-load operation
conditions. (100%, 75%, 50%, and 25% part load)
- Quantitative HVAC Building energy simulations. Design and sizing of systems. Fault detection and diagnostics. - Boiler Efficiency η
The overall efficiency of the boiler considering the effectiveness of the heat exchanger and the radiation
and convection losses.
Luminous
Efficacy lm/W
The ratio of luminous flux to the electric power, measuring of how well a
light source produces visible light
Lm/W Quantitative Lighting Guide the selection of lighting fixtures. -
Fan Energy
Index FEI
The ratio of the actual fan efficiency to a baseline fan
efficiency, both calculated at a given airflow and pressure point.
- Quantitative Fan
Facilitate the comparison among different fans. Guide the sizing and selection of fans.
[11]
ACEEE Appliance
Label -
A label indicating annual operating cost and energy consumption for appliances. -
Rating
Score Appliances
Help consumers identify and compare different appliances, and estimate the yearly energy cost.
[34]
EnergyStar
Label -
A label indicating whether a product meet EPA’s energy
specifications. - Qualitative Appliances
Help consumers to identify and compare appliances [35]
3. Definition of System KPIs
A new set of system-level KPIs is defined in this study that addresses the lack of appropriate assessment methods and metrics to evaluate energy performance at the system level. Key considerations for the system KPIs developed, along with their definitions, approaches for calculating, and organization are presented in this section.
3.1 Key considerations
Instead of evaluating the performance of individual equipment, the system-level KPIs represent a system’s overall performance by considering all the equipment in that system. Moreover, the system-level KPIs should reflect the system performance from different perspectives such as energy use, peak demand, load shape, occupant thermal and visual comfort, ventilation, and the impact to the built environment by the system. Key considerations used to determine the system KPIs include:
Energy Use: Energy use related KPIs evaluate how efficient a building system is in delivering the service with a certain amount of energy consumption. The common types of energy use related KPIs are energy use intensity (EUI) and energy efficiency (EE). EUI represents the cumulative energy consumption as a function of the normalizing factor (e.g., annual lighting energy consumption/building floor area). The normalizing factor could vary depending on the specific KPI. For example, it can be the total gross building area for the MELs system and conditioned floor for the cooling system. EE indicates the ratio of served energy to the consumed consumption (e.g., delivered cooling energy/consumed electricity).
Power Demand: Power demand is another critical metric which has a high impact on building operations and utility structure. It is directly related to the maximum service generation and transportation capacity. The KPIs defined aim to enable the evaluation of building systems’ peak demands with a higher resolution.
Responsiveness to Control: Control strategies or technologies are usually hard to evaluate via whole building or component performance. System-level KPIs provide opportunities to pinpoint control issues in individual systems. For example, the average weekday’s lighting energy consumption during summer should be less than that of winter if daylighting controls work effectively since summer has more daylight than winter.
Responsiveness to Service Demand: Consumption should be correlated to real demand. System-level KPIs can help identify whether the system is functioning at reasonable efficiency. For example, the cooling system total energy consumption should be correlated to outdoor air temperature. The ratio between service hot water (SHW) consumption to occupant count informs whether the SHW system works properly. The ventilation rate should correlate to occupant count if it is a demand-controlled ventilation system.
Aggregation Level: KPIs with different aggregation levels can be used for different purposes. For example, the hourly cooling system EUI can be used to track system performance change and identify control issues; while the annual cooling system EUI can be used to assess the overall cooling system efficiency.
Value Type: KPIs with different types of values can be applied in different scenarios. A single-value KPI such as annual heating system EUI indicates the overall energy performance of the heating system. On the other hand, a serial-value KPI indicates the change patterns of system performance. The monthly heating energy EUI before and after a heating system renovation could be used for measurement and verification purposes.
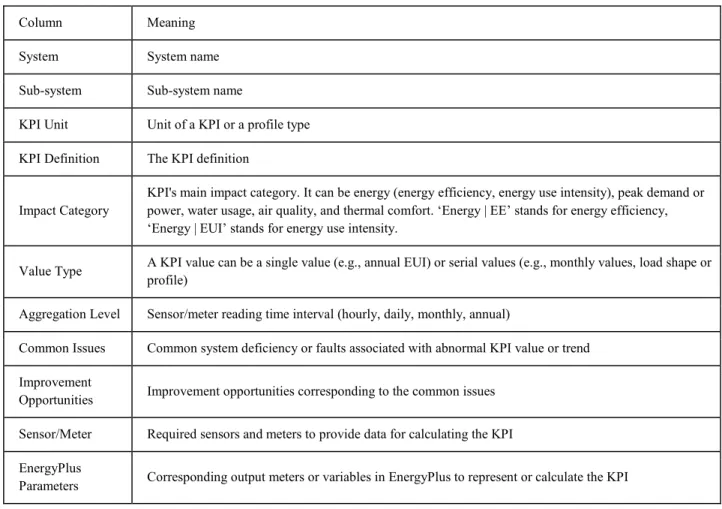
In addition to the criteria stated above, other important aspects such as common issues and improvement opportunities behind abnormal KPI values, the sensor/meter needed to calculate the KPIs, and the parameters needed to derive the KPIs in EnergyPlus simulation models, are also considered. Table 1 shows the structure of the system-level KPIs.
Table 4. Structure of the System-level KPIs Table Column Meaning
System System name Sub-system Sub-system name
KPI Unit Unit of a KPI or a profile type KPI Definition The KPI definition
Impact Category KPI's main impact category. It can be energy (energy efficiency, energy use intensity), peak demand or power, water usage, air quality, and thermal comfort. ‘Energy | EE’ stands for energy efficiency, ‘Energy | EUI’ stands for energy use intensity.
Value Type A KPI value can be a single value (e.g., annual EUI) or serial values (e.g., monthly values, load shape or profile) Aggregation Level Sensor/meter reading time interval (hourly, daily, monthly, annual)
Common Issues Common system deficiency or faults associated with abnormal KPI value or trend Improvement
Opportunities Improvement opportunities corresponding to the common issues Sensor/Meter Required sensors and meters to provide data for calculating the KPI EnergyPlus
3.2 Definitions
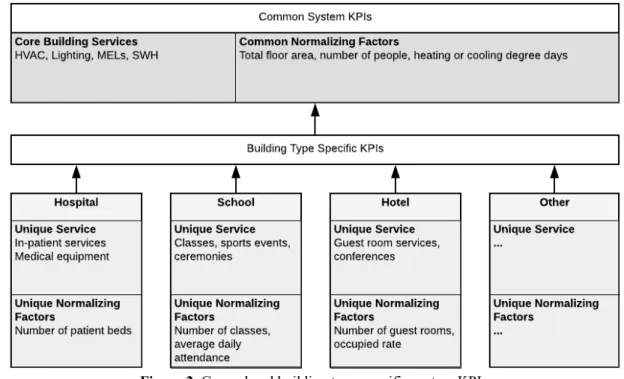
Lighting, MELs, HVAC, and SWH are the common services in modern commercial buildings regardless of their use types. However, building owners and facility managers may view the system performance differently for different building types. Building energy consumption can be normalized by the amount of service it provides. For instance, in office buildings, floor area and number of occupants are two important factors commonly used to normalize the system energy consumption. The per area or per person energy consumption of MELs can reflect the energy efficiency of the MELs system. In hospitals, the service normalizing factor could be the number of patient beds. In hotels, the service normalizing factor could be the occupancy rate, the number of guest rooms, and the number of conference events. In summary, the system KPIs should be defined for general purposes as well as for actual services a specific type of buildings provides. Figure 2 shows the relationship between general KPIs and building type specific KPIs. This paper focuses on the common system KPIs for office buildings. However, building type specific KPIs for other buildings could be derived in the same manner with an appropriate selection of the normalization service factors.
Figure 2. General and building type-specific system KPIs
A total of 43 common KPIs are defined and grouped into four major system types and 11 sub-system types. Four main system types are the lighting system, MELs, HVAC, and SWH. The following subsections summarize the KPIs of each system type. The detailed definitions of the KPIs are organized in tables.
3.2.1 Lighting system KPIs
The lighting system consists of interior lighting, exterior lighting, and emergency lighting subsystems. The most commonly used performance indicator is the lighting power density (LPD), which is defined as the electric power of lighting per floor area. It is usually used as a guidance in new building design or existing building retrofit, as specified by building energy codes and standards such as ASHRAE Standard 90.1 and 189.1. However, it is hard to evaluate the real lighting performance without considering the occupancy and operational patterns. For example, a building with the same LPD but only half of the occupant count of another building is not energy efficient from the occupancy-based lighting control perspective. Similarly, a good lighting system should be able to efficiently harvest daylight while reducing the use of artificial lighting power. The daily lighting energy consumption trend for a whole year could be a good indicator of how well the lighting system responds to the seasonal daylight variations. Table 5 shows the definition of lighting system KPIs.
Table 5. Lighting system KPIs
3.2.2 MELs system KPIs
In commercial buildings, MELs comprise computers and peripherals, monitors, imaging and printing equipment, portable space heaters and fans, projectors, televisions, vending machines, phone chargers. Literature [36] shows a growing portion of MELs in the total building energy use, as buildings adopt more energy efficient technologies for HVAC and lighting systems. In buildings with efficient HVAC systems and lighting systems, MELs can account for almost 50% of the total building energy use. Similar to lighting systems, the performance evaluation of MELs should not be done simply using the equipment power density. Occupant count is an important factor to be considered. It was found that there is a linear relationship between the number of people and MELs consumption [37]. Occupant-related MELs are the MELs that are correlated with occupant count and activities (e.g., desktop, task lighting, personal fans and heaters). Non-occupant related MELs are the MELs which are independent of occupant count and activities (e.g., scheduled process loads, security monitoring system loads, auxiliary equipment loads). Therefore, it is critical to distinguish the occupant-related and non-occupant-related portions. Another characteristic of MELs is they usually have different operation modes like on, off, and standby. A low power plug-load device with long unnecessary standby time could consume more energy than a device with higher power but shorter idle time. Thus, the KPIs should be able to capture the operation patterns. Table 6 shows the definition of MELs system KPIs.
Table 6. MELs system KPIs
3.2.3 HVAC system KPIs
HVAC systems are comprised of heating, ventilation, and air conditioning subsystems which provide thermal comfort and indoor air quality in commercial buildings. HVAC systems account for almost half of the building energy consumption and 10% to 20% of total energy consumption in the developed countries [2], which is the top among building services. Consequently, reducing HVAC systems energy consumption without compromising thermal comfort and air quality is always a hot topic. Traditionally, most of the energy performance assessment of HVAC system is at a component level. An example application is the FDD for HVAC equipment [38–40], which involves analyzing sensor and meter data to detect faulty operations of boilers, chillers, Air Handling Units, Variable Air Volume boxes, fans, pumps, etc. The performance indicators in equipment-level FDD can be the supply air/water temperature, pressure differences, fan and pump speed, damper, and valve positions, depending on the component types.
With more and more stringent building codes and standards, the room for higher efficiency of HVAC component is limited. Researchers started to investigate the energy efficiency opportunities at system level [27,31]. Initial studies tried to develop energy efficiency indicators to help quantify the energy performance at the HVAC system and subsystem level [28,32]. Limitations of the initial work are (1) they focused on the whole-system performance, but did not cover subsystem performance, (2) the performance indicators did not sufficiently consider normalizing service factors like occupant count and weather conditions. As an extension and supplement of the previous efforts, we define HVAC system KPIs and group them into six subsystems, including heating, cooling, air distribution, hydro-distribution, ventilation, and air economizer. The KPIs aim to enable the evaluation of HVAC systems performance with easily collectible sensor and meter data. Table 7 shows the definition of HVAC system KPIs. The “various” in the column “common issues” means that the reasons for abnormal values of those KPIs can vary and usually need further investigations to determine the real cause. Therefore, the corresponding improvement opportunities vary too.
3.2.4 SWH system KPIs
Service Water Heating (SWH) system provides hot water for commercial buildings. It is often known as Domestic Water Heating (DWH) systems in residential buildings. Traditionally, the performance of the SWH system is evaluated by the amount of energy and water consumed during a certain period of time. The newly proposed system-level KPIs consider the floor area, the number of people, and the amount of energy used to circulate the hot water by the SWH system. Table 8 shows the definition of HVAC system KPIs.
Table 8. SWH system KPIs
4. A System KPIs Database
Although the increasing installation of sensors and meters in buildings improves data collection and makes the performance evaluation at the system level more feasible, a dataset that can be used to compare collected data or KPI metrics against peer building systems and to evaluate the performance is still lacking. As such, this study leveraged building energy simulation to develop a database of system KPIs using the USDOE prototype building energy models. Building energy simulation is a widely used approach to estimate or predict the building energy performance during both design and operation phases. A building energy model (BEM) describes building geometry, materials, systems for lighting, plug loads, HVAC, water heating as well as renewables, and reflect buildings operation inducing schedules for occupancy, lighting, plug loads, and thermostat set-points. BEM software combines modeling inputs and local climate data and uses physics-based equations to calculate thermal load, system response to those loads, and resulting energy use [41]. Building energy simulation predicts the energy performance of a building and can calculate the KPIs at the system level defined in the previous sections. This section presents a simulation database of system KPIs compiled from simulation results of the 16 USDOE prototype building energy models across four vintages and five climate zones. The database can be used for system KPIs benchmarking, performance diagnostics, and setting design performance targets at the system level.
4.1 Building energy models
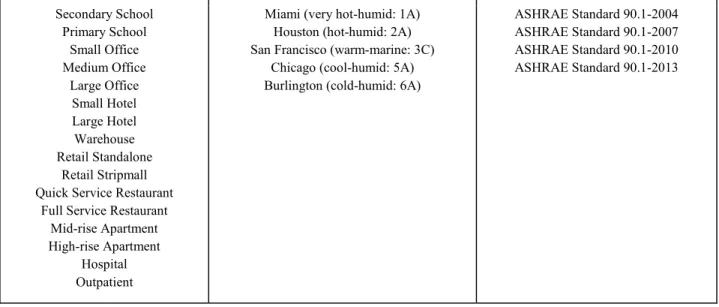
Building energy simulations were conducted for 16 USDOE commercial prototype building models using EnergyPlus as the underlying simulation engine [42] for five U.S. cities, Miami, Florida, Houston, Texas, San Francisco, California, and Chicago, Illinois, and Burlington, Vermont that represent very hot-humid, hot-humid, warm-marine, cool-humid, and cold-humid respectively, and for four vintages based on the ASHRAE 90.1 standard year for 2004, 2007, 2010, and 2013.models. The prototype models were developed to represent the most common commercial buildings for realistic building characteristics and construction practices in the United States and represent 80% of the commercial building floor area. The technical report describes details of the U.S. DOE commercial prototype building models of the national building stock [43], and DOE website provides the EnergyPlus prototype models and spreadsheet scorecards that document key model parameters and assumptions [44]. Table 9 shows the prototype building energy models, climate zones, and vintages used in the simulations. Figure 3 shows the U.S. climate zone map.
Table 9. Building energy models that cover 16 prototype buildings, five climate zones, and four ASHRAE vintages
Secondary School Primary School Small Office Medium Office Large Office Small Hotel Large Hotel Warehouse Retail Standalone Retail Stripmall Quick Service Restaurant
Full Service Restaurant Mid-rise Apartment High-rise Apartment
Hospital Outpatient
Miami (very hot-humid: 1A) Houston (hot-humid: 2A) San Francisco (warm-marine: 3C)
Chicago (cool-humid: 5A) Burlington (cold-humid: 6A)
ASHRAE Standard 90.1-2004 ASHRAE Standard 90.1-2007 ASHRAE Standard 90.1-2010 ASHRAE Standard 90.1-2013
Figure 3. U.S. climate zone map (ASHRAE Transactions, Briggs, et al., 2003)
4.2 Simulation setup
The prototype building energy models were generated using the OpenStudio version 2.7.0 Software Development Kit (SDK) and OpenStudio Standards Gem version 0.2.8. OpenStudio is a whole building energy modeling platform to support building energy simulation using EnergyPlus and provides an open-source SDK for building energy modeling [45], which helps reduce the effort required to build and maintain building energy models [46]. OpenStudio-Standards Gem is a Ruby Gem library, an extension of the OpenStudio SDK that is used to create the OpenStudio model (OSM) for DOE prototype buildings in OpenStudio energy model format [47]. DOE adopted these prototype building energy models for use in standards and codes update development and released a new batch of commercial building prototype models representing each new ASHRAE Standard 90.1. Each batch includes an
energy model for each of 16 commercial building types in each ASHRAE climate zone. OSMs are flexible and powerful as they include convenient abstractions such as spaces and space-types [48].
EnergyPlus is DOE’s open-source simulation engine that implements detailed building physics for air, moisture, and heat transfer supporting flexible component-level configuration of HVAC, plant, and refrigeration systems. EnergyPlus allows simulation sub-hourly time steps to handle fast system dynamics and control strategies and has a programmable external interface for modeling control sequences and interfacing with other analyses [49]. DOE promotes energy modeling work with EnergyPlus using the OpenStudio SDK and suite of applications [50].
The system KPIs need various sensor and meter data for determining their values. The simulation-based KPIs need to extract simulation results from diverse EnergyPlus output variables and meters. The EnergyPlus object, Output:VariableDictionary, shows the available output variables from a simulation run in the EnergyPlus report data dictionary file (eplusout.rdd) and meter output file (eplusout.mdd) [51]. The following EnergyPlus output variables and meters need to be added to EnergyPlus IDFs in order to calculate the system-level KPIs from the simulation results generated in CSV files.
· Output:Meter,InteriorLights:Electricity,hourly; !-[J] · Output:Meter,ExteriorLights:Electricity,hourly; !- [J] · Output:Meter,InteriorEquipment:Electricity,hourly; !- [J] · Output:Meter,InteriorEquipment:Gas,hourly; !- [J] · Output:Meter,Heating:Gas,hourly; !- [J] · Output:Meter,Cooling:Electricity,hourly; !- [J] · Output:Meter,Heating:Electricity,hourly; !- [J] · Output:Meter,Fans:Electricity,hourly; !- [J] · Output:Meter,Pumps:Electricity,hourly; !- [J] · Output:Meter,Electricity:HVAC,hourly; !- [J] · Output:Meter,Gas:HVAC,hourly; !- [J] · Output:Meter,WaterSystems:Gas,hourly; !- [J] · Output:Meter,WaterSystems:Electricity,hourly; !- [J] · Output:Meter,Electricity:Facility,hourly; !- [J] · Output:Meter,Gas:Facility,hourly; !- [J]
· Output:Variable,*,Cooling Coil Electric Power1,hourly; !- HVAC Average [W]
· Output:Variable,*,Water Heater Heating Rate,hourly; !- HVAC Average [W]
· Output:Variable,*,Water Heater Use Side Mass Flow Rate,hourly; !- HVAC Average [kg/s]
· Output:Variable,*,Air System Outdoor Air Economizer Status,hourly; !- HVAC Average []
· Output:Variable,*,Air System Outdoor Air Mass Flow Rate,hourly; !- HVAC Average [kg/s]
· Output:Variable,*,Air System Mixed Air Mass Flow Rate,hourly; !- HVAC Average [kg/s]
· Output:Variable,*,Zone Mechanical Ventilation Mass Flow Rate,hourly; !- HVAC Average [kg/s]
· Output:Variable,*,Zone Mechanical Ventilation Air Changes per Hour,hourly; !- HVAC Average [ach]
* indicates simulation outputs for all zones defined in an EnergyPlus model
1 electricity consumption rate of the direct expansion (DX) coil compressor and condenser fan(s)
4.3 System KPIs Database
A total of 320 EnergyPlus simulations were conducted, and each simulation generated hourly results in CSV files for the requested output and meter variables. Python code was written to extract results from individual output files and process them to calculate the system-level KPIs for inclusion in the database. Annual 8760 hourly results were processed to an aggregated level of 24 serial values of weekday and weekend system-level hourly energy load profiles as well as daily, monthly, and yearly performance indicators. As the operation of systems differs between weekday and weekend, the database includes the hourly serial values for the weekday average and the weekend
average. The simulation-based system KPIs database includes normalized KPI values and sets of 24-hourly load profiles defined in Section 3 that represent the system performance from sensors and meters data.
Currently, the database is an excel spreadsheet with each row represents one simulation of a specific building type, vintage, and climate zone. A total of 773 columns represent the 43 defined system KPIs for eleven subsystems.
4.4 Examples of System KPIs
This section demonstrates several system KPIs examples with visualization and discussions. The simulation-based KPIs database includes 16 building types, so the building level and system level KPIs can be compared among different building types. Figure 4 shows box plots of annual energy EUI (per ft2) for electricity (left) and natural gas
(right), which show energy performance distribution for various climates and vintages for each building type. Looking at the median electricity EUIs, it is observed that the quick service restaurant and the full-service restaurant have the largest electricity use intensity (and also the largest variations), followed by the healthcare buildings including the outpatient and hospital. Warehouse building type has the lowest electricity EUI. The most prevalent building type is office, which takes 18% of the U.S. commercial building sector floor space [52]. There are three office types: the large, medium, and small-sized from the DOE prototype buildings. It should be noted that large office prototype model has a basement designated for a data center, and the energy consumption for this data center was excluded. Office buildings with data centers use significantly more electricity for high-performance computing, cooling, thus the total electricity intensity is much higher than office buildings without data centers [53]. For the natural gas EUIs, the large hotel comes after the quick service restaurant and the full-service restaurant.
Figure 4. Annual Electricity and Natural Gas EUI Boxplot by Building Type
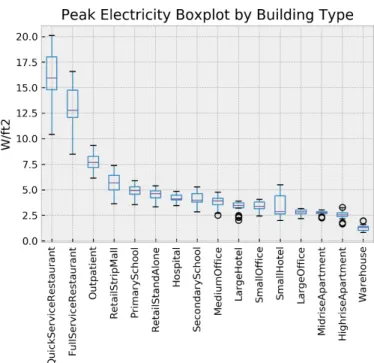
Figure 5 shows the box plot of the peak electrical power demand per floor area by building type across different climate zones and vintages. It is observed that the quick service restaurant and the full-service restaurant have the largest peak electricity demand intensity (and also the largest variations), followed by the Outpatient and RetailStripMall. The Warehouse has the lowest peak electricity demand.
Figure 5. Peak Electricity Boxplot by Building Type
The benchmark dataset from the EnergyStar Portfolio Manager provides the U.S. national median reference site EUI by building types [54]. The benchmark data shows a median site EUI of 15.5 kWh/ft2/yr (167 kWh/m2/yr) for office
buildings. Among the large, medium, and small offices from the KPIs database, the medium office prototype model has the site EUI of (12.3 kWh/ft2/yr (132 kWh/m2/yr)), the closest to the benchmark data. To compare the system
KPIs across ASHRAE climate zones and ASHRAE standard vintages, the medium office prototype model is used. Figure 6 illustrates the end use site EUIs of the medium-sized office prototype buildings by vintage (left) and by climate zone (right). The left chart by vintage shows that energy performance improves as new ASHRAE 90.1 standards become more stringent in energy efficiency for each code cycle. The right one shows that HVAC system related energy use changes by climate zones, which shows higher heating energy consumption in colder climate zones, and higher cooling energy consumption in hot climate zones. Daylight saving control is not implemented in the prototype models, which shows that the energy use of lighting systems does not change with locations. The energy use for the MELs system does not change with climate zone either.
Figure 6. Medium-sized Office Energy End Use site EUI by Vintage (left) and by Climate Zone (right) Figure 7 shows the electricity (left) and natural gas (right) hourly profiles for weekdays (left) for the medium office in climate zone 5A. The values are the hourly average of all weekdays in the whole year simulation results. It shows that buildings compliant with later code cycle years have savings due to the energy efficiency improvement in lighting and MEL that lead to less cooling load and higher HVAC system efficiency. Heating and SHW coils systems that use natural gas have the same efficiency for all vintages. Natural gas energy consumption shows savings in 2007 compared to 2004, and this is caused by a major improvement in building envelope in the 2007 code cycle. Although there is minor envelope improvement in 2013, there is no heating gas saving observed. The lighting system and MELs improvement reduce internal heat gains and thus increase heating demand for zones. The KPI database shows no significant natural gas savings have been achieved for the recent code cycles. For the electricity load profiles, the 2004 and the 2007 are similar, while the 2010 and 2013 are similar. For the natural gas load profiles, except for the 2004, the other three are similar.
Figure 7. Medium-sized Office Energy End Use Profiles for Weekday (left) and Weekend (right)
Figure 8 shows the hourly system-level energy profiles for weekday (left) and weekend (right) for the medium office in climate zone 5A and ASHRAE standard 2013. The weekday profile shows that MELs and interior light power density are much higher during the occupied hours than unoccupied hours. Cooling energy use profile is aligned with the HVAC system and cooling setpoint schedule, which shows a higher use during hot hours in the afternoon. Also, it shows higher heating power in the morning and evening when the temperature is low. Figure 9 shows the climate dependent energy use profile of heating (left) and cooling (right) system for the medium office prototype building.
Figure 8. Medium Office Hourly Energy End Use Profiles for Weekday (left) and Weekend (right)
Figure 9. Medium Office Heating (left) and Cooling (right) Hourly Profiles for Weekday
5. Discussion
5.1 Potential Applications
The system-level KPIs defined in this study aim to fill the current gaps in building performance indicators that can be used in concert with the increasingly available system-level data available from increased adoption of sensors and meters in buildings to quantify and assess energy performance. For example, the system-level KPIs could be a good supplement to the whole-building EUI in performance benchmarking, as they provide more insight into how a system performs compared to the same system in other buildings. For example, Section 4 demonstrates how a simulation-based system KPIs database could be used to explore the system performance and compare the system KPIs between different building types, climate zones, and vintages. The KPI values simulated using building energy models could serve as a basis or target for new building design. This can potentially provide more flexibility in the building design phase since it allows designers a new option to assess the energy performance from a system perspective. Another potential application is that the system-level KPIs could provide a system performance compliance path in addition to the existing whole building performance compliance path in building codes and standards. The system TSPR is adopted by the Washington State as a system performance path for code compliance. Yet another prospective application of the system-level KPIs lies in operation and maintenance of existing buildings. In addition to the existing monitoring functions in common building automation systems which focus on individual
sensors and meters, the system-level KPIs could provide higher level information on how the system performs over time. This could inform the building operators when there is an anomaly in the building operations. System KPIs can also be adopted by utilities or industry for measurement and verification purposes. For example, energy savings from lighting systems can be used to verify an energy efficient lighting retrofit of a building.
5.2 Limitations
The research and application of system-level building performance evaluation are still rudimentary. There are a couple of limitations of the proposed system-level KPIs regarding the data availability, data quality, and consistency in the calculation. First of all, it can be challenging to collect sensor and meter data at the appropriate spatial and temporal resolution from real buildings. It could take a long time until most of the buildings equipped with submetering infrastructure for different end-use systems. Some buildings, for instance, have lighting, MELs, and elevators connected to the same electricity circuit, which is impossible or difficult to segregate the consumption of each end-use system. For most buildings, only monthly electricity and fossil fuel bills are available, which cannot be used to derive the temporal information that some of the KPIs are designed for. Secondly, even if the sensor and meter infrastructure with the good spatial and temporal resolution is available, the data quality can be another difficulty in real buildings where sensors and meters lack routine maintenance to keep them operating correctly. Missing data, unsynchronized timesteps among different sensors and meters, and sensor errors can have significant impacts on the accuracy of the calculated system KPIs. Another challenge is the limited computational power and data storage capability of existing building controllers. This problem is elevated when there are hundreds of sensing and metering variables to be stored in real time. Moreover, the accuracy of the denominator (e.g., total floor area, people count) in the system KPI calculation could be inconsistent or hard to measure. The way of counting the total floor area can vary from building to building, and accurate people count can be tough due to concerns of high cost and occupant privacy.
5.3 Future Work
This study identifies and addresses the gap in system-level KPIs. However, not all the KPIs are cost-effective and needed to evaluate the performance of all building types. In this study, we calculated the system KPIs with the building energy simulation of prototype building models, assuming all the needed sensors and meters are available. In real practice, some sensors and meters are unavailable or expensive to install. Therefore, the trade-off between the expenses of the sensor and meter measurement and the amount and quality of information gained from those measurements plays an important role in deciding which KPIs to use. In the future, deeper research in the cost-effectiveness of implementing the system-level KPIs is needed to guide the use of the KPIs. Moreover, as more sensor and meter data with good quality available, case studies can be conducted to investigate the applications of the system-level KPIs in real buildings. Through the practice of system-level KPI analysis of real buildings, the challenges in sensor data collection and cleaning can be documented; and the typical values of the KPIs can be derived. As the amount of data from real buildings grows, a system-level KPI database from real building data could also be created. This database along with the simulation-based database can form a basis for performance benchmarking and new building designs. Occupant health and productivity is another area of interest. The development of occupant-centric KPIs which will help evaluate how occupant-related services (e.g., thermal comfort, visual comfort, acoustic, and indoor air quality) are influenced by technologies or controls strategies applied to improve energy efficiency, demand flexibility and resilience in buildings.
6. Conclusions
This study reviews existing building energy performance evaluation metrics at the whole-building, system, and individual equipment or component levels, and identifies the need for more comprehensive system-level energy performance indicators. A set of system-level KPIs is formulated, in a new context, into four major end use systems and eleven subsystems by building service type. The definition of the system KPIs considers various aspects including the impact categories (i.e., energy use, power demand, control, service demand), aggregation level (i.e., hourly, daily, weekly, monthly, annual), and value type (i.e., single value vs serial value). A database of the system KPIs is constructed with simulations of 16 prototype building models across four vintages and five U.S. climate
zones. Examples of system KPI values from the database are illustrated in figures. The system KPIs database will be made available at Github.
Potential applications of the system KPIs and the limitations regarding the data availability and data quality issues in existing buildings are discussed. Examples of system KPIs from the simulation database, including major end use intensity, peak demand, and load profile, show their potential use for system level performance benchmarking, performance diagnostics, code compliance, and M&V. Outreach to ASHRAE community is critical to explore potential adoption of system KPIs as a new system performance compliance path for building energy codes and standards.
Declaration of competing interest
All co-authors declare there is no conflict of interest in the reported work.
Acknowledgments
The work is supported by the Assistant Secretary for Energy Efficiency and Renewable Energy, the U.S. Department of Energy under Contract No. DE-AC02-05CH11231.
References
[1] EIA, Commercial buildings energy consumption survey (CBECS), 2015.
[2] X. Cao, X. Dai, J. Liu, Building energy-consumption status worldwide and the state-of-the-art technologies
for zero-energy buildings during the past decade, Energy Build. 128 (2016) 198–213. doi:10.1016/J.ENBUILD.2016.06.089.
[3] S. Wang, C. Yan, F. Xiao, Quantitative energy performance assessment methods for existing buildings,
Energy Build. 55 (2012) 873–888. doi:10.1016/j.enbuild.2012.08.037.
[4] A. Allouhi, Y. El Fouih, T. Kousksou, A. Jamil, Y. Zeraouli, Y. Mourad, Energy consumption and
efficiency in buildings: current status and future trends, J. Clean. Prod. 109 (2015) 118–130. doi:10.1016/J.JCLEPRO.2015.05.139.
[5] A.B.R. González, J.J.V. Díaz, A.J. Caamaño, M.R. Wilby, Towards a universal energy efficiency index for
buildings, Energy Build. 43 (2011) 980–987.
[6] G. Escrivá-Escrivá, C. Álvarez-Bel, E. Peñalvo-López, New indices to assess building energy efficiency at
the use stage, Energy Build. 43 (2011) 476–484. doi:10.1016/J.ENBUILD.2010.10.012.
[7] N.N. Abu Bakar, M.Y. Hassan, H. Abdullah, H.A. Rahman, M.P. Abdullah, F. Hussin, M. Bandi, Energy
efficiency index as an indicator for measuring building energy performance: A review, Renew. Sustain. Energy Rev. 44 (2015) 1–11. doi:10.1016/J.RSER.2014.12.018.
[8] C. Higgins, Key Performance Indicators Final Report on: Key Performance Indicators-Field Metering Study
and Energy Performance Feedback PIER Program: Evidence-based Design and Operations JULY 2012 REPORT 2.4 CEC PIER PROGRAM #500-08-049, n.d.
[9] D. Harris, C. Higgins, Key Performance Indicators and Analysis for Commercial Buildings with System
Level Data, Summer Study Energy Effic. Build. (2012).
[10] A.N.N. Chedop, N. Djongyang, R. Tchinda, A. Zaatri, J.D. Kana, A field study of indicators of the
performance of four absorption chillers in the Sudano-Sahelian region of Cameroon, J. Fundam. Appl. Sci. 8 (2016). doi:10.4314/jfas.v8i1.2.
[11] A. HAUER, Fan Energy Index (FEI) for Energy-Saving Fan Selection., ASHRAE J. (2018). [12] International Energy Agency, Building Energy Performance Metrics - Supporting Energy Efficiency
[13] R.J. Cole, P.C. Kernan, Life-cycle energy use in office buildings, Build. Environ. 31 (1996) 307–317. doi:10.1016/0360-1323(96)00017-0.
[14] Load Factor Calculation, (n.d.).
[15] E.H. Borgstein, R. Lamberts, J.L.M. Hensen, Evaluating energy performance in non-domestic buildings: A review, Energy Build. 128 (2016) 734–755. doi:10.1016/j.enbuild.2016.07.018.
[16] A.G. Entrop, H.J.H. Brouwers, A.H.M.E. Reinders, Evaluation of energy performance indicators and financial aspects of energy saving techniques in residential real estate, Energy Build. 42 (2010) 618–629. doi:10.1016/J.ENBUILD.2009.10.032.
[17] V. Vesma, The energy performance coefficient – a robust indicator, n.d. [18] D.J. McLean, Method for determining and using a climate energy index, (2017). [19] New Buildings Institute, zEPI - New Buildings Institute, (2019).
[20] R. Zmeureanu, P. Fazio, S. DePani, R. Calla, Development of an energy rating system for existing houses, Energy Build. 29 (1999) 107–119. doi:10.1016/S0378-7788(98)00037-1.
[21] J.R. Stein, A. Meier, Accuracy of home energy rating systems, Energy. 25 (2000) 339–354. doi:10.1016/S0360-5442(99)00072-9.
[22] S. Verbeke, Y. Ma, P. Van Tichelen, S. Bogaert, V. Gómez Oñate, P. Waide, K. Bettgenhäuser, J. Ashok, A. Hermelink, M. Offermann, J. Groezinger, M. Uslar, J. Schulte, SUPPORT FOR SETTING UP A SMART READINESS INDICATOR FOR BUILDINGS AND RELATED IMPACT ASSESSMENT FINAL REPORT, 2018.
[23] G. Augenbroe, C.S. Park, Quantification methods of technical building performance, Build. Res. Inf. 33 (2005) 159–172. doi:10.1080/0961321042000325327.
[24] D. Minoli, K. Sohraby, B. Occhiogrosso, IoT Considerations, Requirements, and Architectures for Smart Buildings – Energy Optimization and Next Generation Building Management Systems, IEEE Internet Things J. (2017) 1–1. doi:10.1109/JIOT.2017.2647881.
[25] P. Domingues, P. Carreira, R. Vieira, W. Kastner, Building automation systems: Concepts and technology review, Comput. Stand. Interfaces. 45 (2016) 1–12. doi:10.1016/J.CSI.2015.11.005.
[26] R. Rashed Mohassel, A. Fung, F. Mohammadi, K. Raahemifar, A survey on Advanced Metering Infrastructure, Int. J. Electr. Power Energy Syst. 63 (2014) 473–484. doi:10.1016/J.IJEPES.2014.06.025. [27] Alliance to Save Energy, GREATER THAN THE SUMOF ITS PARTS - THE CASE FOR A SYSTEMS
APPROACH TO ENERGY EFFICIENCY, 2016.
[28] L. Pérez-Lombard, J. Ortiz, I.R. Maestre, J.F. Coronel, Constructing HVAC energy efficiency indicators, Energy Build. 47 (2012) 619–629. doi:10.1016/j.enbuild.2011.12.039.
[29] M. Rosenberg, S. Goel, TSPR: The Total System Performance Ratio as a Metric for HVAC System Efficiency, 2018.
[30] N. Wang, W.J. Gorrissen, Commercial Building Energy Asset Score System: Program Overview and Technical Protocol (Version 1.0), (n.d.). doi:10.2172/1060650.
[31] Alliance to Save Energy, GOING BEYOND ZERO - A SYSTEMS EFFICIENCY BLUEPRINT FOR BUILDING ENERGY OPTIMIZATION AND RESILIENCE, 2017.
[32] J. Liao, D.E. Claridge, Analysis of Whole-Building HVAC System Energy Efficiency, 124 (2018). [33] Determining & Testing Boiler Efficiency For Commercial/Institutional Packaged Boilers, (2015). [34] ACEEE, Appliance Labeling, (2010).
[35] ENERGY STAR, ENERGY STAR Product Label, (n.d.).
[36] New Building Institute, Guide to Energy Savings Plug Load Best Practices Guide, n.d.
[37] Z. Wang, T. Hong, M.A. Piette, Predicting plug loads with occupant count data through a deep learning approach, Energy. 181 (2019) 29–42. doi:10.1016/J.ENERGY.2019.05.138.
[38] Y. Yu, D. Woradechjumroen, D. Yu, A review of fault detection and diagnosis methodologies on air-handling units, Energy Build. 82 (2014) 550–562. doi:10.1016/J.ENBUILD.2014.06.042.
[39] M. Bonvini, M.D. Sohn, J. Granderson, M. Wetter, M.A. Piette, Robust on-line fault detection diagnosis for HVAC components based on nonlinear state estimation techniques, Appl. Energy. 124 (2014) 156–166. doi:10.1016/J.APENERGY.2014.03.009.
[40] S. Wu, J.-Q. Sun, Cross-level fault detection and diagnosis of building HVAC systems, Build. Environ. 46 (2011) 1558–1566. doi:10.1016/J.BUILDENV.2011.01.017.
[41] U.S. DOE, About Building Energy Modeling, (2019). https://www.energy.gov/eere/buildings/about-building-energy-modeling (accessed May 30, 2019).
[42] D.B. Crawley, L.K. Lawrie, F.C. Winkelmann, W.F. Buhl, Y.J. Huang, C.O. Pedersen, R.K. Strand, R.J. Liesen, D.E. Fisher, M.J. Witte, J. Glazer, EnergyPlus: creating a new-generation building energy simulation program, Energy Build. 33 (2001) 319–331. doi:10.1016/S0378-7788(00)00114-6.
[43] M. Deru, K. Field, D. Studer, K. Benne, B. Griffith, P. Torcellini, B. Liu, M. Halverson, D. Winiarski, M. Rosenberg, M. Yazdanian, J. Huang, D. Crawley, U . S . Department of Energy Commercial Reference Building Models of the National Building Stock, 2011.
[44] U.S. DOE, Commercial Prototype Building Models, (2019).
https://www.energycodes.gov/development/commercial/prototype_models#90.1 (accessed May 30, 2019). [45] NREL, OpenStudio, (2019). https://www.openstudio.net/ (accessed May 30, 2019).
[46] U.S. DOE, OpenStudio, (2019). https://www.energy.gov/eere/buildings/downloads/openstudio-0 (accessed May 30, 2019).
[47] NREL, Openstudio-standards, (2019). https://github.com/NREL/openstudio-standards (accessed May 30, 2019).
[48] U.S. DOE, New OpenStudio-Standards Gem Delivers One Two Punch, (2016).
https://www.energy.gov/eere/buildings/articles/new-openstudio-standards-gem-delivers-one-two-punch (accessed May 30, 2019).
[49] U.S. DOE, EnergyPlus, (2019). https://www.energy.gov/eere/buildings/downloads/energyplus-0 (accessed May 30, 2019).
[50] U.S. DOE, EnergyPlus, (2019). https://energyplus.net/ (accessed May 30, 2019). [51] U.S. DOE, EnergyPlus Version 9.0.1 Documentation Input Output Reference, 2018.
[52] U.S. EIA, Commercial Buildings Energy Consumption Survey (CBECS) A Look at the U.S. Commercial Building Stock: Results from EIA’s 2012 Commercial Buildings Energy Consumption Survey (CBECS): Table B12. Selected principal building activity: part 1, floorspace, 2012, 2015.
[53] U.S. EIA, Office buildings with data centers use significantly more electricity than other offices, (2016). https://www.eia.gov/todayinenergy/detail.php?id=28232 (accessed May 30, 2019).
Tables 5 to 8
Table 10. Lighting system KPIs
System system Sub- KPI Unit KPI Definition Category Impact Value Type Interval Time Common Issues Opportunities Improvement Sensor/Meter EnergyPlus Parameters
Lighting System
Interior Lighting System
kWh/(ft2*yr) Interior Lighting energy use intensity based on floor area
Energy |
EUI Single Annual
Low lighting system efficiency, poor lighting control
Upgrade lighting fixtures. Check lighting control system.
Electricity meter for
Interior Lighting system Annual Interior Lighting Electricity Consumption
W/ft2 Interior Lighting
power per floor area. Demand | Power Single / Serial
Multiple (hourly, monthly, annual)
Poor lighting control Upgrade lighting fixtures. Check lighting control system.
Electricity meter for Interior Lighting system
Output:Variable,*,Lights Electric Power,hourly; !- Zone Average [W] kWh/day Interior Lighting energy usage
normalized per day
Energy |
EE Serial Annual, Monthly Poor daylighting control
Upgrade lighting fixtures and daylighting control system
Electricity meter for
Interior Lighting system Output:Meter,InteriorLights:Electricity,hourly; !- [J] kWh/(person
*yr) Energy use intensity based on people count Energy | EE Single Annual Poor occupancy lighting control
Upgrade lighting fixtures and occupancy lighting control system
Electricity meter for
Interior Lighting system Output:Meter,InteriorLights:Electricity,hourly; !- [J] kWh/(FTE_
Occupied Hours)
Interior Lighting energy consumption per occupied hours
Energy | EE Single Multiple (hourly, monthly, annual) Poor occupancy
lighting control Check/Upgrade daylight control system Electricity meter for Interior Lighting system NA
Exterior Lighting System
kWh/(ft2*yr) Exterior Lighting energy use intensity based on floor area
Energy |
EUI Single Annual
Low lighting system efficiency, poor lighting control
Upgrade exterior
lighting fixtures Electricity meter for Exterior Lighting system Annual Exterior Lighting Electricity Consumption W/ft2 Exterior Lighting power per floor area Demand | Power Serial
Multiple (hourly, monthly, annual)
Low lighting system efficiency, poor lighting control
Upgrade exterior
lighting fixtures Electricity meter for Exterior Lighting system
Output:Variable,*,Exterior Lights Electric
Power,hourly; !- Zone Average [W]
kWh/day Exterior Lighting energy per day Energy | EE Serial Annual, Monthly Poor daylighting control Check exterior lighting control logic Electricity meter for Exterior Lighting system Output:Meter,ExteriorLights:Electricity,hourly; !- [J] Emergen
cy Lighting System
kWh/(ft2*yr) Emergency lighting system energy use intensity
Energy |
EUI Single Annual Emergency lighting system faults Upgrade emergency lighting fixtures Electricity meter for emergency lighting system NA W/ft2 Emergency lighting system load Demand | Power Serial
Multiple (hourly, monthly, annual)
Emergency lighting
Table 11. MELs system KPIs
System system Sub- KPI Unit KPI Definition Category Impact Value Type Interval Time Common Issues Opportunities Improvement Sensor/Meter EnergyPlus Parameters
MELs
Occupan t-related MELs
W/ft2 Energy demand of the system per person and floor area.
Demand | Power Single Value
Multiple (hourly, monthly, annual)
Low system
efficiency Update the MEL system. Electricity meter for MEL
Output:Variable,*,Electric Equipment Electric Power,hourly; !- Zone Average [W] kWh/(ft2*yr) Annual energy consumption per
person
Energy
|EUI Single Value Annual
There is no occupancy control of the devices. Occupants lack energy-saving awareness.
Add occupancy control for the MEL systems.
Educate occupants. Electricity meter for MEL
Output:Meter,InteriorEquipm ent:Electricity,hourly; !- [J]
Usage Profile
The percentages of four status - active, idle, sleep, and off.
Energy |
EE Distribution Annual
The idle status percentage is high. The energy consumption at sleep status is high.
Optimize operation strategy to reduce idle
time. Electricity meter for MEL NA
Non-occupant -related MELs
W/ft2 Energy demand of the system per person and floor area.
Demand | Power Single Value
Multiple (hourly, monthly, annual)
Low system
efficiency Update the MEL system. Electricity meter for MEL
Output:Variable,*,Electric Equipment Electric Power,hourly; !- Zone Average [W] kWh/(ft2*yr) Annual energy consumption per
person
Energy
|EUI Single Value Annual Low system efficiency Update the MEL system. Electricity meter for MEL Output:Meter,InteriorEquipment:Electricity,hourly; !- [J] Usage
Profile
The percentages of four status - active, idle, sleep, and off.
Energy
|EE Distribution Annual
The idle status percentage is high. The energy consumption at sleep status is high.
Optimize operation strategy to reduce idle