February 28, 2016 1
Required Elements for Submission of the Unified or Combined
State Plan and Plan Modifications under the Workforce
Innovation and Opportunity Act (WIOA)
OMB Control Number 1205-0522
Alabama’s Combined WIOA Plan
February 28, 2016 2 Table of Contents Page
I. WIOA State Plan Type II. Strategic Elements III. Operational Elements
February 28, 2016 3 I. WIOA STATE PLAN TYPE
Select whether the State is submitting a Unified or Combined State plan. Alabama selects a COMBINED STATE PLAN.
The State must submit a plan that covers the six core programs Alabama’s plan covers the six core programs:
1. Adult Program (Title I of WIOA) 2. Dislocated Worker Program (Title I) 3. Youth Program (Title I)
4. Adult Education and Family Literacy Act Program (Title II)
5. Wagner-Peyser Act Program (Wagner-Peyser Act as amended by Title III) 6. Vocational Rehabilitation Program (Title I of the Rehabilitation Act of 1973 as
amended by Title IV)
The State Combined Plan may include one or more partner programs Alabama’s plan covers these additional programs:
1. Temporary Assistance for Needy Families (TANF) Programs under the Supplemental Nutrition Assistance Program
2. Work programs authorized under section 6(o) of the Food and Nutrition Act of 2008 (SNAP)
3. Senior Community Service Employment Program (Programs authorized under Title V of the Older Americans Act of 1965)
4. Veterans
5. Unemployment Insurance (UI)
II. STRATEGIC ELEMENTS
The Unified or Combined State Plan must include a Strategic Planning Elements section that analyzes the State’s current economic environment and identifies the State’s overall vision for its workforce development system. The required elements in this section allow the State to develop data-driven goals for preparing an educated and skilled workforce and to identify successful strategies for aligning workforce development programs to support economic growth. Unless otherwise noted, all Strategic Planning Elements apply to Combined State Plan partner programs included in the plan as well as to core
February 28, 2016 4
(II)(A) Economic, Workforce, and Workforce Development Activities Analysis The Unified or Combined State Plan must include an analysis of the economic conditions, economic development strategies, and labor market in which the State’s workforce system and programs will operate.
(II)(A)(1) Economic and Workforce Analysis (II)(A)(1)(A) Economic Analysis
The Unified or Combined State Plan must include an analysis of the economic conditions and trends in the State, including sub-state regions and any specific economic areas identified by the State.
The State of Alabama experienced record low unemployment rates, strong GDP growth, and the addition of 130,000 new jobs between 2004 and 2007. Although this period brought a more diversified economy to the state, Alabama was not immune to the effects of the recession. Between 2008 and 2010, Alabama lost 138,500 jobs. Since the
recession, Alabama’s recovery has been slow but steady. Federal, state, and local government budgets suffered tremendously during the recession, and cutbacks have occurred at all levels. Federal budget constraints have hurt the state’s military base operations and also the state’s federal research contracts. These funding cutbacks have led to fewer jobs and a slower economic recovery.
Although manufacturing sharply declined during the recession, it remains a strong employer in the state. Due to the change in the global economy in recent decades, the state’s traditional industries have gone through major changes. Many manufacturing operations moved overseas, resulting in a significant decline in the textile and apparel industries. Since 2000, the state’s economy has diversified with the addition of several foreign owned companies into the state. This diversification began with the influx of major automotive manufacturers. While the major auto manufacturers did experience some decline during the recession, they have experienced increased auto sales and increases in exports since the recession. This growth and recovery resulted in additional shifts and additional employees. The recovery and growth for auto manufacturers has had a positive effect on parts suppliers and companies that support the automotive industry. The addition of automobile manufacturing has contributed to additional transportation manufacturers decisions to locate in Alabama. Both shipbuilding and aerospace manufacturing have experienced success in Alabama. Since 2009, Alabama’s exports have increased over 57.0 percent. In 2014, Alabama’s total exports were $19.5 billion, just short of the state’s record set in 2012 for overseas shipments.
Alabama has a population of approximately 4.8 million people and has experienced a growth rate of 1.5 percent since 2010. Since 2000, Alabama’s population has grown an average of 0.7 percent each year. The most heavily populated region is Workforce Development Region (WDR) 4, the region that includes the Birmingham metro area. WDR 4 represents 23 percent of the population in the state. The regions that have experienced the most growth since 2000 are WDR 2, that includes the Huntsville metro area, and WDR 8, the Auburn Metro area. These have grown an average annual rate of
February 28, 2016 5
1.35 percent and 1.32 percent respectively. WDR 6, in west Alabama, continues to experience a loss in population to other areas. The most recent population estimate for WDR 6 is 95,911, which was down 4.9 percent since 2010.
The demographic composition of Alabama’s population is 70.4 percent white, 27.1 percent Black, 1.5 percent Asian, and 1.2 percent American Indian. The largest percentage of white population lives in north Alabama, while the largest percentage of black population lives in central Alabama. Mobile County has the largest percentage of American Indian population. The largest percentage of the Asian population resides in Jefferson County, followed by Madison County. The latest Hispanic population figure for the state is 191,838, which is 4.1 percent of the state’s population, up from 3.8 percent in 2010. The counties with the largest percentage of Hispanic population are Franklin (16 percent), DeKalb (14 percent), and Marshall (13 percent). All three of these counties are in the northern part of the state. The population in Alabama continues to age at a fast pace. In 2000 only 22 percent of the population was over the age of 55. In 2014 over 27 percent of the population was over the age of 55.
As of January 2015, Alabama is organized into ten (10) workforce development regions (WDRs). Each of the regions has a board consisting of industry leaders,
educators, economic developers, and others with an interest in workforce and economic development. Some regions are established as 501c3 organizations with executive directors and are supported with funding from the state, the federals government, and private industry in the region. WDR 9, known as the Southwest Alabama Workforce Development Council (SAWDC) was the first of these 501c3 boards in Alabama. This region includes the Mobile,
Daphne/Fairhope/Foley metro areas. Other boards that have recently become 501c3 organizations include (1) WDR 3 made up of the
Tuscaloosa metro area and know as West Alabama Works; (2) WDR 4 composed of the Birmingham metro areas and known as the Central Six Development council; and, (3) WDR 8 in the Auburn-Opelika metro area known as East Alabama WIN. Each of the ten regions in the state varies economically. All include at least one metropolitan area with the exception of WDR 6, a small rural region in west Alabama.
WDR 1 is located in northwest Alabama and includes the
Florence/Muscle Shoals metropolitan area. The population of this region in 2014 was estimated to be 267,138, a 0.5 percent decline since 2010. The
February 28, 2016 6
per capita income in WDR1 in 2013 was $31,703, nearly $5,000 lower than the state average. Total employment in 2014 was 98,874, up 1.0 percent since 2009.
Manufacturing employs the largest percentage (24 percent) of the workforce in WDR 1. Historically, the region has been known for its wood manufacturing industry. Although there have been declines since 2000 to a low of 3,174 employed, the industry has recovered some since the recession, growing over 13 percent. As with the rest of the state, WDR 1 has experienced growth in transportation manufacturing. The region already had a presence in motor vehicle body and trailer manufacturing, but since the recession, has attracted some motor vehicle parts manufacturers. Employment in this industry has tripled since 2009. The region still has a significant agriculture base, with an estimated employment of 4,500. In November 2015, the unemployment rate for WDR 1 was 6.6 percent (7,520 unemployed workers), higher than the state rate of 6.0 percent.
WDR 2 is in northeast Alabama and includes the Huntsville and Decatur metropolitan areas. The estimated population in WDR 2 in 2014 was 860,348, 3.1 percent higher than in 2010. Per capita income in the region was $37,278 in 2013, nearly $800 above the state average. Madison County per capita income was $43,481, higher than the state average by $7,000. This region, specifically the Huntsville area, is well known as a hub for high technology. With the second largest research and development park in the United States, the area is home to a large array of Fortune 500 companies, local and international high-tech companies, and U.S. space and defense agencies. WDR 2, as a center for research and development, employs nearly half of the state’s total
architecture and engineering occupations, and a third of the computer and mathematical occupations. With a total employment of 404,462 in 2014, the region has grown 2.7 percent since the worst part of the recent recession. Since 2009, employment in computer systems design and related services has increased by 22.0 percent. Federal government employment in WDR 2 has grown 12.5 percent since 2009, due to the presence of numerous government projects in the area. Although the metropolitan areas are highly technical in nature, the surrounding counties in the region still have a high presence in agriculture, employing over 3,000 individuals. This region continues to be a large producer of poultry, cattle, and cotton in the state. The latest unemployment figures from November 2015 reveal an unemployment rate in WDR 2 of 5.2 percent, lower than the overall rate for the state.
Located in the western part of the state, WDR 3 includes the Tuscaloosa metropolitan area; however, the majority of counties in the region are fairly rural. The region had an estimated population of 299,780 in 2014, 67 percent of whom reside in Tuscaloosa County. Per capita income in the region is lower than the state average by over $2,500, with an estimate in 2013 of $33,919. Tuscaloosa County makes up approximately 82.0 percent of the region’s total employment. Educational Services is the dominant industry in Tuscaloosa County, due to the location of The University of Alabama in the county. The region as a whole, though, has experienced a large positive impact by the addition of manufacturing companies. Total employment has grown 5.75 percent since 2009, reaching 123,650 in 2014. While the region has experienced significant losses in
apparel, petroleum, and coal product manufacturing, transportation manufacturing in the region has grown, as it has in the rest of the state. The transportation manufacturing
February 28, 2016 7
industry, employing 6,242 people in 2014, experienced more than 37.0 percent growth since 2009. In November 2015, WDR 3 had an estimated 7,509 people unemployed, a rate of 5.5 percent.
The most heavily populated region in the state is WDR 4, which consists of the Birmingham metropolitan area. The 2014 population estimate for WDR 4 was 1,121,266, representing 23.0 percent of the state’s total. Nearly 26.0 percent of the state’s workforce is located in the region, with a total employment of 542,177 in 2014. This region is centrally located in the state, at the intersection of a six-spoke interstate system. This makes it a perfect location for regional distribution centers. The WDR 4 is the financial center of the state, with approximately 50.0 percent of the state’s
employment in finance and insurance industries. According to the Federal Reserve, Birmingham has nearly $220 billion in bank assets, ranking it as the second largest banking center in the south and the 11th largest nationally. Corporate headquarters for four financial institutions and several major insurance companies are located here. WDR 4 also leads the state in health care services and research. The University of Alabama at Birmingham (UAB) is the fourth largest academic medical center in the United States, and it ranks 44th out of 965 institutions in the National Science Foundation Total R&D expenditures. Furthermore, UAB’s University Hospital is the third largest public hospital in the nation. This region currently has the lowest
unemployment rate in the state at 5.1 percent, with 27,208 unemployed.
WDR 5 is located in the eastern part of the state and includes the Gadsden and Anniston metropolitan areas. The 2014 population estimate of 430,028 for WDR 5 showed a decline of 1.4 percent from 2010. Population in the two metro areas in the region make up over 50.0 percent of the region’s population. These metro areas had a population decline of over 3,500 people since 2010. Per capita income in the region was $32,196, approximately 12.0 percent below the state average in 2013. The largest percentage of the workforce in WDR 5 is employed in manufacturing industries. Total employment in 2014 was 158,926, up only 0.1 percent since 2009. Although manufacturing has grown slightly in the region since 2009 (up 3.6 percent) the region still suffers from large numbers of jobs being exported to other countries. Prior to 2000, textile and apparel companies were moving out of the country. These industries in Alabama employed 13,699 in 2000, and only 2,215 jobs remain in 2014. Fortunately, the area landed a major automobile manufacturing plant in 2001, which also attracted parts suppliers to the area. Transportation manufacturing employment has grown 21.0 percent since 2009, with an employment of 10,238 persons in 2014. The latest unemployment data for the region shows that in November 2015 WDR 5 had approximately 10,630 unemployed, equaling a 5.9 percent unemployment rate.
WDR 6, located in west central Alabama, is composed of some of the most rural counties in the state. The estimated population in 2014 was 95,911, down 4.9 percent from 2010, with the population decreasing in every single county over the period. The average labor force in 2014 was 34,968, but the latest census data has reported that the region has a very low labor force participation rate (estimated at around 45.0 percent). Additionally, the workforce is aging, with just over 25.0 percent over the age of 55. Per
February 28, 2016 8
capita income in the area was $31,242 in 2013, which was 14.4 percent below the state average of $36,481. Total employment in the region has continued to decline slightly each year, dropping 3.8 percent from 2009 to 2014. The region has experienced some employment growth in food manufacturing, and has gained some new auto parts manufacturers. Like most areas of the state, and the nation, employment has also increased in employment service companies due to the fact that many places are using people employed by employment services to work in their businesses. There is a strong agriculture industry in the region with an estimated employment of around 2,300. WDR 6 consistently has the highest unemployment rate of all the regions. The latest figures for November 2015 report an estimated 2,914 people unemployed, equating to an 8.6 percent unemployment rate.
WDR 7 consists of the Montgomery metropolitan area and the city of Montgomery. The 2014 population estimate of 407,414 declined slightly (by 0.5 percent) since 2010. Montgomery County made up over 50.0 percent of the region’s population, and its population declined 1.4 percent since 2010. However, population increased in both Autauga and Elmore counties, an indication that some of the people who lived in Montgomery County moved to those neighboring counties. In 2013, per capita income was $40,168. A large percentage of veterans live in this region, with the presence of the Maxwell Air Force Base in Montgomery County. The latest figures show that the percentage of the adult population who are veterans is 15.1 percent in Autauga County, 15.4 percent in Elmore County, 11.6 percent in Montgomery County, and 12.1 percent in Butler County. With the state capital located in Montgomery, the primary industry in the area is state government. Total employment in the region was estimated at 194,647 in 2014, which is down slightly from 2009. Some of the decline is due to a reduction in state government. But, like most of the other regions of the state, WDR 7 has
experienced significant employment growth in transportation industries. With the construction of a major automobile manufacturing plant in WDR 7, employment has grown 10.6 percent in automotive manufacturing and 159.0 percent in automotive parts manufacturing since 2009. The region has also enjoyed growth in aerospace
manufacturing, with employment growth of 19.5 percent since 2009. Like other regions of the state and the nation, this area has also seen growth in employment services
industries, due to a change in how companies hire employees. Since 2009, employment in this industry has grown around 22.0 percent. The latest unemployment figures for November 2015 show that an estimated 10,364 people were unemployed in WDR 7 producing a 5.6 percent unemployment rate, lower than the state unemployment rate. WDR 8 is located in east-central Alabama. Within the region is the Auburn-Opelika metropolitan area. Also included in this region is Russell County, a part of the
Columbus, GA metropolitan area. This region is one of the fastest growing in the state. In 2014 the population was estimated at 278,128, with a 7.1 percent growth since 2010. Lee County’s population, making up 55 percent of the entire region, grew 10.0 percent from 2010 to 2014. Furthermore, Russell County’s population grew 12.6 percent during the same period. The per capita income for the region was still fairly low in 2013 at $30,341, $6,140 below the state’s average. The primary industry in the area is
February 28, 2016 9
several community colleges in the region. A study by the Association of Public and Land-grant Universities reported that Auburn had a $5.1 billion economic impact in the state in 2014. Since 2009, total employment in WDR 8 has grown around 9.0 percent, with manufacturing growing over 12.0 percent. Chemical manufacturing employment has grown 180.0 percent since 2009. Furthermore, WDR 8 has seen a more than 60.0 percent growth in both fabricated metal product manufacturing and transportation equipment manufacturing between 2009 and 2014. The latest data for WDR 8 show the unemployment rate at 5.2 percent, with approximately 6,577 people unemployed. WDR 9 encompasses the southwest region of the state. This area consists of the Mobile metropolitan area and the Daphne-Fairhope-Foley metropolitan area. The latest
population estimates for the metro areas combined are approximately 615,000, while the total population for the remaining six counties in the region is 127,452. Per capita income for the region in 2013 was $34,173, 6.3 percent below the state average, with Baldwin County having the highest per capita income at $39,100. Although total employment has only grown 1.4 percent between 2009 and 2014, manufacturing
employment has grown over 11.0 percent. Primary metal manufacturing has grown 15.0 percent, and transportation equipment manufacturing has grown over 40.0 percent, with most of the growth being in ship manufacturing. In 2014, the Business Facilities Magazine ranked the Mobile metropolitan area third in the nation for economic
development growth potential. In the region as a whole, the November 2015 data show that approximately 20,214 people were unemployed, which equates to a regional unemployment rate of 6.4 percent.
The southeast region of the state, including the Dothan metropolitan area, makes up WDR 10. Population in the region declined slightly from 343,949 in 2010 to an
estimated 346,678 in 2014. Houston County showed the most population growth during the same period, with an increase of 2.6 percent reaching 104,193. Military veterans are a large part of this region, with the latest figures showing that an estimated 13.7 percent of the adult population in the region are veterans, the highest veteran rate in the state. Coffee County had the highest percentage of veterans, with an estimated 7,431 residing there. This county also had the highest per capita income in the region at $38,002 in 2013, higher than the state average. WDR 10’s per capita income was $34,555, which was $1,926 below the state average. This region is home to a major university, a
military base, and has strong presence of aviation training. Additionally the region still plays a major role, both in the state and nation, in agriculture production. The area continues to be a large producer of cotton, peanuts, poultry, and eggs. Total employment in the region in 2014 was estimated at 139,395. In November 2015, the unemployment rate was 5.9 percent, close to the state average, with 8,340 people unemployed.
During 2014, total employment for the state averaged 1.86 million, still lower than the pre- recession level of 1.95 million. Alabama’s total employment dropped to an annual average of 1.81 million at the height of the recession, and, as a result, the state is
experiencing a slow recovery. The industry sector with the largest effect on the state’s economy continues to be manufacturing, with $17.63 billion in manufactured goods exports in 2014. In the 20th century, the majority of manufacturing in the state consisted of nondurable goods, such as textile, apparel, food, paper, etc. Due to changes in trade
February 28, 2016 10
agreements and many manufacturers moving out of the country in pursuit of cheaper labor, these industries are no longer the primary source of income for the state. Since 2000, durable goods manufacturing has risen to the forefront, through extensive
economic development efforts to replace the thousands of jobs lost in nondurable goods manufacturing. Transportation manufacturing has had the greatest positive impact, presently making up over 20.0 percent of the manufacturing employment in the state.
February 28, 2016 11
(II)(A)(1)(A)(i) Existing Demand Industry Sectors and Occupations
Existing Demand Industry Sectors and Occupations. Provide an analysis of the industries and occupations for which there is existing demand.
A majority of the industries targeted for recruitment, retention, and renewal are
manufacturing industries. Three of those targeted industries, Aerospace, Automotive, and Metal Manufacturing, which includes ship building, are in the transportation manufacturing sector (Figure 1). At the height of the recession, the transportation manufacturing dropped down to 45,692 employed, but since has grown over 31 percent, with automotive parts manufacturing growing the most at 78 percent since 2010. Ship and boat building had a slight setback in 2010, decreasing from an employment of 3,515 in 2009 to 3,018 in 2010. It quickly recovered to 3,640 in 2011 and continues to increase every year. Top Aerospace cluster occupations for 2013 in Alabama are shown in Table 1. Top occupations in Alabama in 2013 for the Automotive cluster are shown in Table 2. Top occupations in Alabama in 2013 in the Sheet Metal and Ship Building cluster are shown in Table 2.
Source: Alabama Department of Labor, Quarterly Census of Employment and Wages. 0 10,000 20,000 30,000 40,000 50,000 60,000 70,000 2000 2001 2002 2003 2004 2005 2006 2007 2008 2009 2010 2011 2012 2013 2014 FIGURE 1. TRANSPORTATION MANUFACTURING
Motor Vehicle Manufacturing Motor Vehicle Body & TrailerManufacturing Motor Vehicle Parts Manufacturing Aerospace Manufacturing
Railroad Manufacturing Ship & Boat Building Other
February 28, 2016 12
Table 1: Top Occupations for Aerospace Cluster
2013
Employment % of Cluster
Mean Hourly
Computer Programmers 2,730 5% $39.41
Computer User Support Specialists 2,500 4% $22.15
Computer Systems Analysts 2,290 4% $38.67
Software Developers, Applications 2,140 4% $45.20
Aircraft Mechanics and Service Technicians 2,050 3% $30.80 Software Developers, Systems Software 1,920 3% $47.72 Aircraft Structure, Surfaces, Rigging, and Systems
Assemblers 1,820 3% $23.85
Source: 2014 release of the Occupational Employment Statistics (OES) Report in cooperation with the Bureau of Labor Statistics; wage data aged using the most current Employment Cost Index (ECI) factors.Annual wage information rounded to the nearest whole dollar. Note: Data reflects wages across all industries, not specifically to respective industry cluster.
Table 2: Top Occupations for Automotive Cluster Employment2013 % of Cluster Hourly Mean
Team Assemblers 13,580 34% $16.85
Tire Builders 1,960 5% $23.37
Cutting, Punching, and Press Machine Setters,
Operators, and Tenders, Metal and Plastic 1,950 5% $14.67 Engine and Other Machine Assemblers 1,770 4% $18.07
Industrial Machinery Mechanics 1,340 3% $24.00
Inspectors, Testers, Sorters, Samplers, and Weighers 1,270 3% $15.42 Assemblers and Fabricators, All Other 900 2% $11.39
Industrial Engineers 830 2% $40.72
Computer-Controlled Machine Tool Operators, Metal
and Plastic 650 1% $17.29
Source: 2014 release of the Occupational Employment Statistics (OES) Report in cooperation with the Bureau of Labor Statistics; wage data aged using the most current Employment Cost Index (ECI) factors.Annual wage information rounded to the nearest whole dollar. Note: Data reflects wages across all industries, not specifically to respective industry cluster.
Table 3: Top Occupations for Sheet Metal and Ship
Manufacturing Cluster Employment2013 % of Cluster Hourly Mean
Welders, Cutters, Solderers, and Brazers 3,090 6% $17.87
Machinists 2,410 5% $19.21
Cutting, Punching, and Press Machine Setters,
Operators, and Tenders, Metal and Plastic 1,810 4% $14.67
Team Assemblers 1,790 4% $16.85
Industrial Machinery Mechanics 1,590 3% $24.00
Layout Workers, Metal and Plastic 1,400 3% $22.26
Helpers--Production Workers 1,390 3% $11.54
Rolling Machine Setters, Operators, and Tenders, Metal
and Plastic 1,360 3% $20.95
Structural Metal Fabricators and Fitters 1,230 3% $17.19
Source: 2014 release of the Occupational Employment Statistics (OES) Report in cooperation with the Bureau of Labor Statistics; wage data aged using the most current Employment Cost Index (ECI) factors.Annual wage information rounded to the nearest whole dollar. Note: Data reflects
February 28, 2016 13
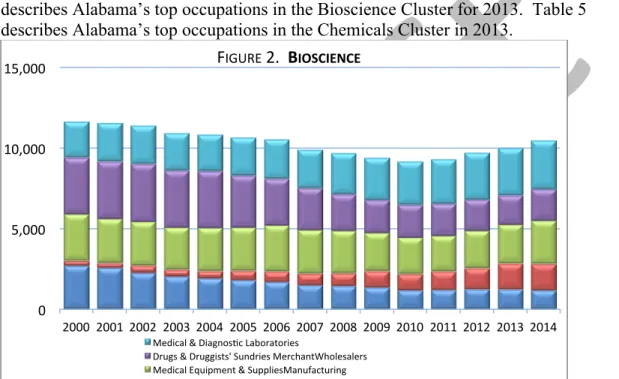
Two industries, Bioscience and Chemicals, are also being targeted through the state’s strategic plan, Accelerate Alabama, introduced by Governor Robert Bentley in an executive order in July 2011. While the total employment in the bioscience cluster has experienced a downturn since 2000, the cluster has grown over 14 percent since 2010, and there have been announcements of 335 new jobs to come. Most of those jobs announced are in pharmaceutical and medicine manufacturing, a field that has experienced a steady growth in employment of 473.0 percent since 2000, and has continued to grow during the recession years (Figure 2). The Chemicals cluster also took a downturn since 2000, but has grown slightly since the recession (Figure 3). A very small portion of this cluster (soap, cleaning compound, and toiletry manufacturing) has grown 154 percent since 2000. Additionally, since 2014, announcements for 200 new jobs in paint, coating, and adhesive manufacturing have been made. Table 4 describes Alabama’s top occupations in the Bioscience Cluster for 2013. Table 5 describes Alabama’s top occupations in the Chemicals Cluster in 2013.
Source: Alabama Department of Labor, Quarterly Census of Employment and Wages.
Table 4. Top Occupations for Bioscience Cluster Employment2013 % of Cluster Hourly Mean
Sales Representatives, Wholesale and Manufacturing,
Except Technical and Scientific Products 1,230 13% $31.17
Dental Laboratory Technicians 630 7% $16.54
Chemical Plant and System Operators 500 5% $28.08
Medical and Clinical Laboratory Technologists 370 4% $25.41 Medical and Clinical Laboratory Technicians 360 4% $17.26
Phlebotomists 300 3% $13.05
Inspectors, Testers, Sorters, Samplers, and Weighers 280 3% $15.42
Customer Service Representatives 250 3% $14.48
Packers and Packagers, Hand 230 2% $10.17
Source: 2014 release of the Occupational Employment Statistics (OES) Report in cooperation with the Bureau of Labor Statistics; wage data aged using the most current Employment Cost Index (ECI) factors.Annual wage information rounded to the nearest whole dollar. Note: Data reflects wages across all industries, not specifically to respective industry cluster. 0 5,000 10,000 15,000 2000 2001 2002 2003 2004 2005 2006 2007 2008 2009 2010 2011 2012 2013 2014 FIGURE 2. BIOSCIENCE
Medical & Diagnosac Laboratories
Drugs & Druggists' Sundries MerchantWholesalers Medical Equipment & SuppliesManufacturing
February 28, 2016 14
Two more targeted clusters in Accelerate Alabama were Distribution Centers and Corporate Operations. While Distribution, like most industries, experienced a downturn during the recession, it has steadily increased in employment since 2010. Warehousing, a component of Distribution Centers, has especially grown, increasing of nearly 47 percent since 2010, with more than 1,000 additional jobs announced since 2014 (Figure 4). Additionally, approximately 140 new jobs have been announced for general freight trucking. Corporate Operations as a cluster has been growing at a steady pace
Table 4. Top Occupations for Chemicals Cluster
2013
Employment % of Cluster
Mean Hourly Wage
Chemical Equipment Operators and Tenders 1,140 7% $26.44 Extruding and Drawing Machine Setters, Operators, and
Tenders, Metal and Plastic 950 6% $16.13
Inspectors, Testers, Sorters, Samplers, and Weighers 780 5% $15.42
Packers and Packagers, Hand 700 4% $10.17
Industrial Machinery Mechanics 690 4% $24.00
Mixing and Blending Machine Setters, Operators, and
Tenders 680 4% $18.81
Chemical Plant and System Operators 620 4% $28.08 Molding, Coremaking, and Casting Machine Setters,
Operators, and Tenders, Metal and Plastic 510 3% $14.59 Industrial Truck and Tractor Operators 440 3% $14.49
Source: 2014 release of the Occupational Employment Statistics (OES) Report in cooperation with the Bureau of Labor Statistics; wage data aged using the most current Employment Cost Index (ECI) factors. Annual wage information rounded to the nearest whole dollar. Note: Data reflects wages across all industries, not specifically to respective industry cluster
0 1,000 2,000 3,000 4,000 5,000 6,000 2000 2001 2002 2003 2004 2005 2006 2007 2008 2009 2010 2011 2012 2013 2014 FIGURE 3. CHEMICAL
February 28, 2016 15
since 2000 (Figure 5). From 2000 to 2014 this cluster has grown 60 percent, with nearly 1,300 new jobs announced. Table 5 shows the top occupations in Alabama in 2013 in the Corporate Operations Cluster. Table 6 describes the top occupations in Alabama in 2013 in the Distribution Cluster.
Source: Alabama Department of Labor, Quarterly Census of Employment and Wages.
Source: Alabama Department of Labor, Quarterly Census of Employment and Wages. 0 5,000 10,000 15,000 20,000 25,000 30,000 35,000 2000 2001 2002 2003 2004 2005 2006 2007 2008 2009 2010 2011 2012 2013 2014 FIGURE 4. DISTRIBUTION Trucking Warehousing 0 5,000 10,000 15,000 20,000 25,000 30,000 2000 2001 2002 2003 2004 2005 2006 2007 2008 2009 2010 2011 2012 2013 2014 FIGURE 5. HEADQUARTERS & CUSTOMER CENTERS
February 28, 2016 16
Table 5. Top Occupations for Corporate Operations
Cluster Employment2013 % of Cluster Hourly Mean
Customer Service Representatives 5,910 21% $14.48
Telemarketers 1,900 7% $10.55
General and Operations Managers 1,650 6% $58.48
Bill and Account Collectors 1,550 5% $15.00
Bookkeeping, Accounting, and Auditing Clerks 1,230 4% $17.06
Accountants and Auditors 1,080 4% $31.97
Office Clerks, General 610 2% $11.09
Computer User Support Specialists 580 2% $22.15
Source: 2014 release of the Occupational Employment Statistics (OES) Report in cooperation with the Bureau of Labor Statistics; wage data aged using the most current Employment Cost Index (ECI) factors.Annual wage information rounded to the nearest whole dollar. Note: Data reflects wages across all industries, not specifically to respective industry cluster.
Table 6. Top Occupations for Distribution Cluster Employment2013 % of Cluster Hourly Mean
Heavy and Tractor-Trailer Truck Drivers 12,240 30% $19.74 Laborers and Freight, Stock, and Material Movers, Hand 6,810 16% $11.67 Industrial Truck and Tractor Operators 2,400 6% $14.49
Stock Clerks and Order Fillers 1,990 5% $11.35
Packers and Packagers, Hand 1,810 4% $10.17
Shipping, Receiving, and Traffic Clerks 1,130 3% $14.46 Sales Representatives, Wholesale and Manufacturing,
Except Technical and Scientific Products 1,120 3% $31.17 Light Truck or Delivery Services Drivers 1,030 2% $14.34
Source: 2014 release of the Occupational Employment Statistics (OES) Report in cooperation with the Bureau of Labor Statistics; wage data aged using the most current Employment Cost Index (ECI) factors.Annual wage information rounded to the nearest whole dollar. Note: Data reflects wages across all industries, not specifically to respective industry cluster.
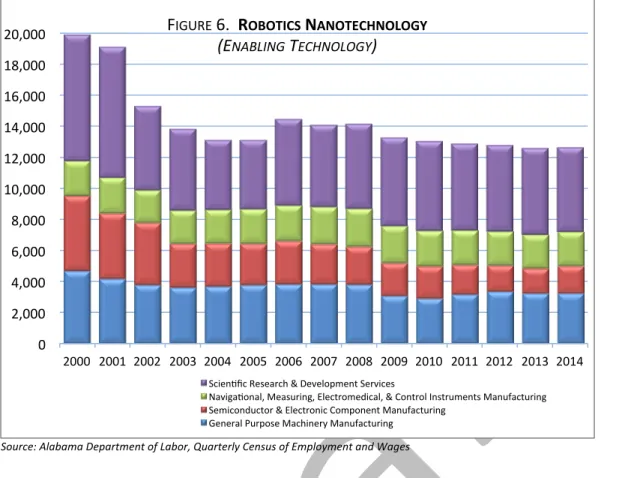
Alabama’s strategic plan for economic development (Accelerate Alabama) also targeted industries that are associated with Enabling Technology, due to the increased use of nanotechnology and robotics (Figure 6) used in many of the large automotive production plants in Alabama and surrounding states. To show the Alabama’s commitment to prepare the workforce for these types of jobs, AIDT and robotics industry leaders collaborated to build a robotics technology park. The park consists of three training facilities, each targeted to a specific industry need. While the industries associated with this cluster show minimal growth thus far, nearly 1,000 additional jobs have recently (since 2014) been announced for the state. Table 7 shows the top occupations in Alabama in 2013 in the Enabling Technology cluster.
February 28, 2016 17
Source: Alabama Department of Labor, Quarterly Census of Employment and Wages
Table 7. Top Occupations for Enabling Technology
Cluster Employment2013 % of Cluster Hourly Mean
Electrical and Electronic Equipment Assemblers 1,000 8% $13.59
Computer Systems Analysts 680 5% $38.67
Machinists 500 4% $19.21
Software Developers, Systems Software 450 4% $47.72 Multiple Machine Tool Setters, Operators, and Tenders,
Metal and Plastic 410 3% $15.57
Welders, Cutters, Solderers, and Brazers 410 3% $17.87
Electrical Engineers 380 3% $45.20
Industrial Engineers 330 3% $40.72
Team Assemblers 310 3% $16.85
Source: 2014 release of the Occupational Employment Statistics (OES) Report in cooperation with the Bureau of Labor Statistics; wage data aged using the most current Employment Cost Index (ECI) factors. Annual wage information rounded to the nearest whole dollar. Note: Data reflects wages across all industries, not specifically to respective industry cluster.
Information Technology, another targeted industry cluster, overlaps the Enabling Technology cluster somewhat. The largest industry in the Information Technology cluster (Figure 7) is business support services, a field that has grown at a steady pace, even during the recession, up 63 percent since 2000. Additionally, over 500 new jobs have been announced in this cluster since 2014. The top occupations in the Information Technology cluster in Alabama in 2013 are shown in Table 8.
0 2,000 4,000 6,000 8,000 10,000 12,000 14,000 16,000 18,000 20,000 2000 2001 2002 2003 2004 2005 2006 2007 2008 2009 2010 2011 2012 2013 2014 FIGURE 6. ROBOTICS NANOTECHNOLOGY
(ENABLING TECHNOLOGY)
Scienafic Research & Development Services
Navigaaonal, Measuring, Electromedical, & Control Instruments Manufacturing Semiconductor & Electronic Component Manufacturing
February 28, 2016 18
Source: Alabama Department of Labor, Quarterly Census of Employment and Wages.
Table 8. Top Occupations for Information Technology Cluster
2013
Employment % of Cluster
Mean Hourly
Computer User Support Specialists 2,440 7% $22.15
Computer Programmers 2,400 7% $39.41
Software Developers, Applications 2,160 6% $45.20
Management Analysts 2,030 6% $45.23
Computer Systems Analysts 1,830 5% $38.67
Software Developers, Systems Software 1,350 4% $47.72 Network and Computer Systems Administrators 940 3% $33.73
Source: 2014 release of the Occupational Employment Statistics (OES) Report in cooperation with the Bureau of Labor Statistics; wage data aged using the most current Employment Cost Index (ECI) factors.Annual wage information rounded to the nearest whole dollar. Note: Data reflects wages across all industries, not specifically to respective industry cluster.
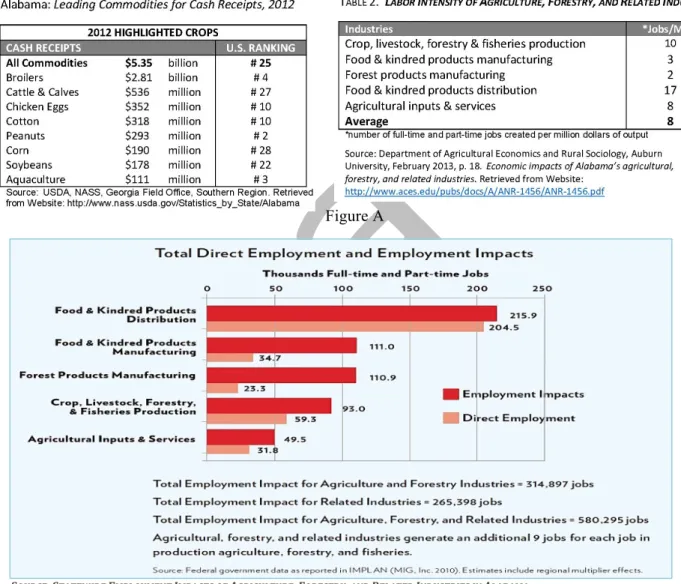
The final two clusters targeted in Accelerate Alabama are historically a large part of the state’s economy; Food Products and Forest Products. In 2012 Alabama’s agriculture industry produced cash receipts of $5.35 billion (Table 9). In the U.S. the state ranks 2nd in peanut production, 3rd in aquaculture, and 4th in poultry broilers. The state also ranks 10th in the U.S. in both cotton and chicken/egg production. According to the Alabama Forestry Commission, Alabama’s forests generate over $21 billion in timber production and processing revenue. The state ranks 3rd in timberland acreage in the 48 contiguous states, behind only Georgia and Oregon. According to a 2013 report published by Auburn University (February 2013), Agriculture, forestry and their related industries account for 41 percent of Alabama’s $174 billion economy and provide 22 percent of all jobs in the state. The study has determined that agriculture, forestry, and related industries generate 8 jobs per million dollars of sales (Table 10).
0 5,000 10,000 15,000 20,000 25,000 30,000 35,000 40,000 2000 2001 2002 2003 2004 2005 2006 2007 2008 2009 2010 2011 2012 2013 2014 FIGURE 7. INFORMATION TECHNOLOGY
February 28, 2016 19
This report identified over 90 industry sectors that are related to agriculture and forestry production, including food and kindred product distribution sectors, like wholesalers, food stores, and restaurants. For these reasons, it is beneficial to the economy of the state to continue to support and pursue advancements in production and research for these industries. Table 11 describes the top occupations in the Food Products Cluster for 2013. Table 12 describes the top occupations in the Forest Products Cluster in Alabama for 2013. Figure A shows the Direct Employment and Employment Impacts of agriculture, forestry and related industries in Alabama as reported in 2010.
Table 9 Table 10
Figure A
February 28, 2016 20
Table 11. Top Occupations for Food Products Cluster Employment2013 % of Cluster Hourly Mean
Meat, Poultry, and Fish Cutters and Trimmers 12,090 29% $10.66 Sales Representatives, Wholesale and Manufacturing,
Except Technical and Scientific Products 2,280 5% $31.17
Helpers--Production Workers 2,270 5% $11.54
Packers and Packagers, Hand 1,480 3% $10.17
Food Cooking Machine Operators and Tenders 1,330 3% $12.21 Packaging and Filling Machine Operators and Tenders 1,300 3% $12.73 Laborers and Freight, Stock, and Material Movers, Hand 1,220 3% $11.67
Industrial Machinery Mechanics 1,100 3% $24.00
Cleaners of Vehicles and Equipment 990 2% $10.95
Source: 2014 release of the Occupational Employment Statistics (OES) Report in cooperation with the Bureau of Labor Statistics; wage data aged using the most current Employment Cost Index (ECI) factors.Annual wage information rounded to the nearest whole dollar. Note: Data reflects wages across all industries, not specifically to respective industry cluster.
Table 12.Top Occupations for Forest Products Cluster Employment2013 % of Cluster Hourly Mean
Paper Goods Machine Setters, Operators, and Tenders 2,260 6% $18.11 Sawing Machine Setters, Operators, and Tenders, Wood 2,200 6% $13.61 Woodworking Machine Setters, Operators, and Tenders,
Except Sawing 2,160 6% $11.87
Logging Equipment Operators 1,920 6% $15.78
Cabinetmakers and Bench Carpenters 1,840 5% $13.35
Helpers--Production Workers 1,490 4% $11.54
Team Assemblers 1,420 4% $16.85
Industrial Machinery Mechanics 1,360 4% $24.00
Source: 2014 release of the Occupational Employment Statistics (OES) Report in cooperation with the Bureau of Labor Statistics; wage data aged using the most current Employment Cost Index (ECI) factors.Annual wage information rounded to the nearest whole dollar. Note: Data reflects wages across all industries, not specifically to respective industry cluster.
One industry sector that was not addressed in the Accelerate Alabama plan is
Healthcare. The fact that the baby boomers are approaching retirement age, and also that people are living longer, is beginning to have a large impact on the healthcare
system. Additionally, there are many more specialized jobs in healthcare than in the past, due to the fact that healthcare costs have risen in tandem with the demand for healthcare services. While hospitals have experienced small but steady growth every year since 2000, most of the growth in healthcare employment has come from industries that provide more specialized care (Figure 8). Industries such as outpatient care centers, home health care services, and specialized health practitioners have doubled in
employment since 2000. In addition employment in residential disability, mental health, and substance abuse facilities has grown 226 percent since 2000. Continuing care retirement and assisted living facilities have also doubled in employment. Furthermore, as the population ages, so does the workforce in the healthcare industry. In Alabama in 2014, 21 percent of the healthcare workforce was over the age of 55. There is a
February 28, 2016 21
projection combined with an increasing number of workers approaching retirement, the demand for healthcare employees is very high in the state.
Table 13 shows the top occupations in the Healthcare cluster in Alabama in 2013.
0 50,000 100,000 150,000 200,000 250,000 300,000 2000 2001 2002 2003 2004 2005 2006 2007 2008 2009 2010 2011 2012 2013 2014 FIGURE 8. HEALTH CARE & SOCIAL ASSISTANCE
Ambulatory Health Svcs Hospitals Nursing & Residenaal Care Faciliaes Social Assistance
Table 13. Top Occupations for Healthcare Cluster
2013
Employment % of Cluster Mean Hourly
Registered Nurses 39,580 16.95 $27.82
Nursing Assistants 21,110 8.00 $10.86
Licensed Practical and Licensed Vocational Nurses 12,060 5.12 $17.52
Personal Care Aides 11,050 3.59 $8.82
Medical Assistants 6,570 2.69 $12.81
Home Health Aides 3,660 2.57 $9.70
Office Clerks, General 4,780 2.40 $11.30
Receptionists and Information Clerks 6,690 2.33 $11.95 Secretaries and Administrative Assistants 4,740 1.97 $16.44
Medical Secretaries 4,410 1.67 $15.33
Billing and Posting Clerks 3,820 1.49 $15.30
Radiologic Technologists 3,230 1.41 $22.62
Dental Hygienists 2,540 1.23 $21.71
Dental Assistants 3,340 1.22 $15.13
Emergency Medical Technicians and Paramedics 2,560 1.06 $14.61 Medical Records and Health Information Technicians 2,230 1.02 $15.73
Source: 2014 release of the Occupational Employment Statistics (OES) Report in cooperation with the Bureau of Labor Statistics; wage data aged using the most current Employment Cost Index (ECI) factors.Annual wage information rounded to the nearest whole dollar. Note: Data reflects wages across all industries, not specifically to respective industry cluster.
February 28, 2016 22
(I)(A)(1) (A) (ii) Emerging Demand Industry Sectors and Occupations
Emerging Demand Industry Sectors and Occupations. Provide an analysis of the industries and occupations for which demand is emerging.
Alabama’s strategic plan for economic development is also targeting industries that are associated with Enabling Technology, due to the increased use of nanotechnology and robotics (Figure 6) used in many of the large automotive production plants in Alabama and surrounding states. To show the dedication to prepare the workforce for these types of jobs, AIDT and robotics industry leaders across the nation collaborated to build the robotics technology park. The park consists of three training facilities, each targeted to a specific industry need. While the industries associated with this cluster show minimal growth thus far, nearly 1,000 additional jobs have recently been announced for the state. Cyber Securityis an emerging industry another cluster which overlaps the Enabling Technology cluster. Huntsville, Alabama is home to the second largest research park in the United States, Cummings Research Park, with over 400 companies that include Fortune 500 companies, local and international high-tech enterprises, and US space and defense agencies. It also includes a thriving business incubator and competitive higher education institutions. Cyber security is most certainly an emerging sector in this state, and in the entire country.
Source: Alabama Department of Labor, Quarterly Census of Employment and Wages. 0 2,000 4,000 6,000 8,000 10,000 12,000 14,000 16,000 18,000 20,000 2000 2001 2002 2003 2004 2005 2006 2007 2008 2009 2010 2011 2012 2013 2014 FIGURE 6. ROBOTICS NANOTECHNOLOGY
(ENABLING TECHNOLOGY)
Scienafic Research & Development Services
Navigaaonal, Measuring, Electromedical, & Control Instruments Manufacturing Semiconductor & Electronic Component Manufacturing
February 28, 2016 23
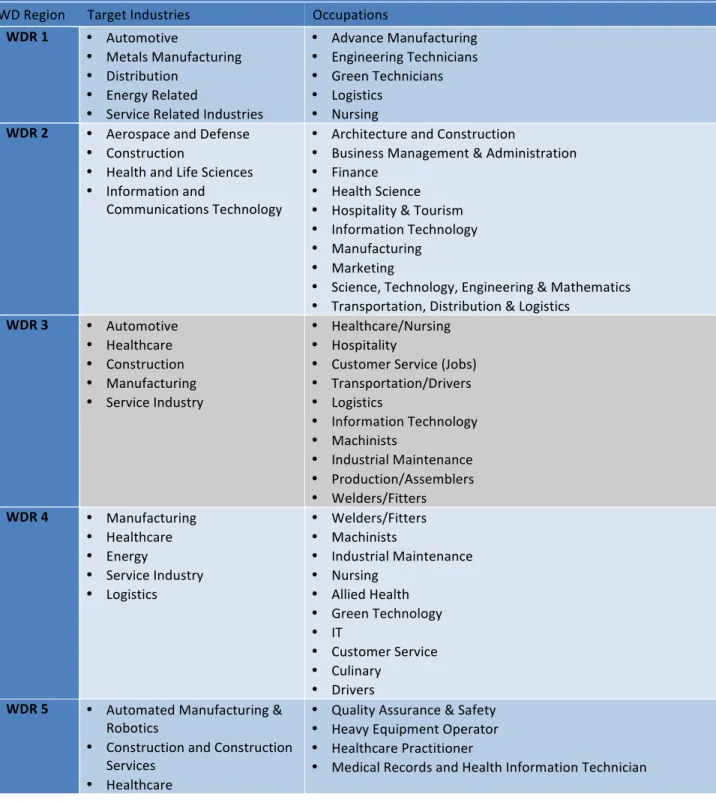
Table 14 lists Alabama’s targeted industries and occupations by Workforce Development Regions. Table 15 presents the top ten knowledge and skill areas for the demand
occupations in targeted industry clusters.
Table 14. Existing Demand Industry Sectors and Occupations by Region
WD Region Target Industries Occupations
WDR 1 • Automotive
• Metals Manufacturing • Distribution
• Energy Related
• Service Related Industries
• Advance Manufacturing • Engineering Technicians • Green Technicians • Logistics
• Nursing
WDR 2 • Aerospace and Defense • Construction
• Health and Life Sciences • Information and
Communications Technology
• Architecture and Construction
• Business Management & Administration • Finance
• Health Science • Hospitality & Tourism • Information Technology • Manufacturing
• Marketing
• Science, Technology, Engineering & Mathematics • Transportation, Distribution & Logistics
WDR 3 • Automotive • Healthcare • Construction • Manufacturing • Service Industry • Healthcare/Nursing • Hospitality
• Customer Service (Jobs) • Transportation/Drivers • Logistics • Information Technology • Machinists • Industrial Maintenance • Production/Assemblers • Welders/Fitters WDR 4 • Manufacturing • Healthcare • Energy • Service Industry • Logistics • Welders/Fitters • Machinists • Industrial Maintenance • Nursing • Allied Health • Green Technology • IT • Customer Service • Culinary • Drivers
WDR 5 • Automated Manufacturing & Robotics
• Construction and Construction Services
• Healthcare
• Quality Assurance & Safety • Heavy Equipment Operator • Healthcare Practitioner
February 28, 2016 24
Table 14. Existing Demand Industry Sectors and Occupations by Region
WD Region Target Industries Occupations • Hospitality and Tourism
Services •• Industrial Maintenance Computer User Support Specialist
• Plating and Coating Machine Setters, Operators & Tenders • Welding, Soldering and Brazing Workers
• Metal Workers and Plastics Workers
• Electrical Workers and Electronics Repairers, Commercial/Industrial
WDR 6 • Construction • Healthcare
• Hospitality and Tourism • Manufacturing
• Retail and Services
• Agricultural Business • Bio-Fuel
• Customer Service Rep. • Entrepreneurial Development • Healthcare Workers
• Industrial Maintenance Tech • IT Services
• Management • Tourism Guides
• Trades (carpentry, brick layers plumbing)
WDR 7 • Agriculture • Healthcare • Manufacturing • Service/Tourism • Transportation/Warehousing/ Distribution • Computer Skills • Customer Service Reps • Engineering Technician • Industrial Maintenance • Logistics • LPNs • Mechanics • RNs • Truck Drivers • Welding WDR 8 • Manufacturing • Healthcare
• Transportation, Distribution & Logistics
• Hospitality & Tourism • Architecture and Construction
• Assembler/Operator • Certified Nursing Assistant • Commercial Driver License Driver • Computer Numeric Control Machinist • Customer Service Representative • Industrial Maintenance Technician • Licensed Practical Nurse
• Occupational/Physical Therapist • Pipe Fitter/Welder
February 28, 2016 25
Table 14. Existing Demand Industry Sectors and Occupations by Region
WD Region Target Industries Occupations
WDR 9 • Aviation and Aerospace • Construction
• Healthcare
• Advance Manufacturing • Maritime
• Airframe and Powerplant Mechanic • Assembler
• Electrical Maintenance/ Electrician Engineer • Electrician
• Lab/Med Technician
• Mechanical Maintenance/Mechanical Engineer • Millwright • Pipefitter/Pipe welder • Registered Nurse • Ship-fitter WDR 10 • Healthcare • Transportation • Manufacturing • Aviation • Services
• Auto & Vehicle Mechanics
• Automotive Technology Specialists • Construction Trade Workers • Customer Service Representatives • Engineers
• Industrial Maintenance • Nurses
• Physical Therapist Assistants • Physical Therapists
• Sheet Metal Fabricators • Surgical Technicians • Truck Drivers • Welders
February 28, 2016 26
Table 15. Knowledge, Skills, Abilities
Top 10 KSAs
Demand Occupations in Targeted Industry Clusters
Knowledge Rank Skill Rank Ability Rank
English Language 12.2% Critical Thinking 10.42% Problem Sensitivity 7.10%
Customer & Personal Service 9.8% Monitoring 9.57% Near Vision 6.79%
Mathematics 8.9% Reading Comprehension 9.01% Oral Comprehension 6.31%
Mechanical 8.2% Active Listening 8.93% Deductive Reasoning 5.71%
Production and Processing 7.5% Speaking 8.14% Oral Expression 5.44%
Public Safety and Security 6.7% Operation Monitoring 6.29% Written Comprehension 5.27%
Education and Training 5.4% Coordination 6.18% Information Ordering 4.74%
Computers and Electronics 5.2% Judgment & Decision Making 4.84% Speech Recognition 4.65%
Medicine and Dentistry 4.8% Quality Control Analysis 4.44% Control Precision 4.09%
Engineering and Technology 4.2% Operation and Control 3.93% Manual Dexterity 4.02%
February 28, 2016 27 (I) (A) (1) (iii) Employers’ Employment Needs
Employers’ Employment Needs. With regard to the industry sectors and occupations identified in (A)(i) and (ii), provide an assessment of the employment needs of employers, including a
description of the knowledge, skills, and abilities required, including credentials and licenses. In 2012, only 30 percent of jobs were in occupations that typically require postsecondary education for entry. Within this group, jobs in occupations that require a Bachelor’s degree for entry held the largest share at 15 percent. Occupations requiring a high school diploma or equivalent, and less than high school, made up 70 percent of jobs in 2012. Occupations with the highest percentage growth typically require a form of
postsecondary education, with associate’s degree occupations holding the highest share at 18.9 percent.
All occupations requiring postsecondary education are projected to grow faster than average, 10.4 percent. At 8.7 percent, less than high school occupations show the slowest growth over the projection period.
Over the past five years there have been a multitude of reports all over the country about skills gaps. More importantly the emphasis has been on employees’ lack of soft skills. Alabama is no different. Employers all over the state declare that they cannot find employees with adequate skills. The Alabama Department of Labor, Labor Market Information Division decided that the state needed current data to illustrate the employers’ concerns in these areas. As a result, a skills survey was conducted, and published in 2013. Many of the employers voicing these concerns were in manufacturing and construction industries. So, for this study, the decision was made to survey
employers in manufacturing, construction and utilities. A sample of 6,926 employers was randomly selected by the Bureau of Labor Statistics. Over 5,000 employers in the three industries responded to the survey. The survey instrument included three categories
551,170 880,740 18,670 137,120 86,330 309,310 27,330 42,440
Less than high school High school diploma or equivalent Some college, no degree Postsecondary non-degree award Associate's degree Bachelor's degree Master's degree Doctoral or professional degree
February 28, 2016 28
of questions: Recruitment Challenges; Skills Gaps Identified; and Training and future needs.
Employers in the sample who had hired within the past two years were asked the level of difficulty they had in finding candidates with adequate basic skills. A majority of those stated that it was either extremely or moderately difficult. The responses also indicated that it was most difficult to hire people with experience in the occupation, but hundreds of employers said it was most difficult to hire for entry-level positions. Over 1,300 employers indicated that the number one reason for rejecting applications was that the prospective employee did not pass a drug screen, surpassing lack of work experience as a factor for not hiring an applicant. When given the opportunity to list other reasons, employers indicated (1) lack of driver’s license or reliable transportation, (2) lack of required certification, (3) attendance history, (4) employment history, (5) failed employment skills testing, and (6) other reasons, most relating to a lack of soft skills.
A list of soft skills and a list of technical skills were provided, so the employers could choose all skills gaps identified in existing staff. Of the soft skills, across all industries and all areas, poor attendance was the overwhelming top choice. Others chosen at high levels were time management deficits, inability to following directions, lack of critical thinking skills, and poor communication. Gaps identified in technical skills often varied by industry. In a majority of the manufacturing industries, the top technical gaps were machining skills, welding skills, and electrical knowledge. In utilities, the number one technical skill gap was in the area of math. Utilities employers also ranked engineering and electrical deficits at high levels. The selections from construction companies varied
February 28, 2016 29
depending on the type of work that was done. Some of the top skill gaps identified were in the areas of carpentry, blueprint reading, industrial experience, equipment operating, electrical, and welding.
When employers were asked what area of training would be the most valuable to improve the workforce, choosing from soft skills, occupational experience, or education, the majority ranked soft skills as most valuable.
February 28, 2016 30
Respondents also were given the opportunity to list future technologies that would require training. Employers listed mobile technology, robotics, computer numerical control (CNC) technology, manufacturing automation technology, and general computer advancements as the top five technologies. The survey revealed that a majority of
employers do not presently use training resources provided to them by various workforce development partners. A majority of employers conduct their own training on the job.
Source: Alabama Department of Labor - Labor Market Information Division 2013 Skills Gap Survey
Source: Alabama Department of Labor - Labor Market Information Division 2013 Skills Gap Survey
February 28, 2016 31
Source: Alabama Department of Labor - Labor Market Information Division 2013 Skills Gap Survey
Source: Alabama Department of Labor - Labor Market Information Division 2013 Skills Gap Survey
(I)(B) Workforce Analysis
The Unified or Combined State Plan must include an analysis of the current workforce, including individuals with barriers to employment, as defined in section three of WIOA3. This population must include individuals with disabilities among other groups in the State and across regions identified by the State.
(I)(B)(i) Employment and Unemployment
Employment and Unemployment. Provide an analysis of current employment and unemployment data and trends in the State. The unemployment rate has been declining continuously since 2009 when it was highest due to the recession (Figure 11). Unemployment rates in 2014 ranged between 6.0 percent and 10.9 percent for the WDRs, with a 6.8 percent annual average for the state. According to the Bureau of Labor Statistics, 2014 unemployment rates were higher for younger workers. Youth, age 16 to 19, experienced an estimated unemployment rate of 29.7 percent in 2014, which is down from 2010 when it was 30.8 percent. Labor Force participants between the ages of 20 and 24 experienced a significant drop in unemployment rate between 2010 and 2014, dropping from 20.9 percent to 12.9 percent. In April 2015, unemployment rates ranged from 4.8 percent (WDR 4) to 8.3 percent (WDR 6) for the regions, with a 5.3 percent rate for the state. WDR 4 had the largest labor force and WDR 6 had the smallest. The latest figures show that in November 2015 Alabama had an unemployment rate of 6.0 percent, down from 6.1 percent in November of 2014. Still, Alabama’s rate is higher than the nation, which is currently at 5.0 percent. WDR 2 has the lowest rate of 5.2 percent, while WDR 6 continues to experience the highest rate in the state at 8.6 percent.
Figure 11. Alabama Unemployment Rate
Source: Alabama Department of Labor
Table 16. Unemployment Rate by Demographics Subject
AGE Unemployment rate
16 to 19 years 26.40% 20 to 24 years 16.70% 25 to 44 years 8.50% 45 to 54 years 5.70% 55 to 64 years 4.10% 65 to 74 years 3.70%
75 years and over 3.00%
RACE AND HISPANIC OR LATINO ORIGIN
Black or African American 13.70%
American Indian and Alaska Native 8.60%
Asian 4.90%
Some other race 5.00%
Two or more races 14.50%
Hispanic or Latino origin (of any race) 6.60% White alone, not Hispanic or Latino 6.70%
POVERTY STATUS IN THE PAST 12 MONTHS
Below poverty level 28.50%
DISABILITY STATUS
With any disability 17.20%
EDUCATIONAL ATTAINMENT 25 TO 64 YEARS
Less than high school graduate 13.70%
High school graduate (includes equivalency) 8.90%
Some college or associate's degree 6.60%
Bachelor's degree or higher 3.10%
MILITARY
Veterans 5.54%
Source: American Community Survey 2014
Alabama’s labor force participation rate has fallen from 61.4 percent in 2007 to 57.2 percent in 2014, third lowest in the nation, behind West Virginia and Mississippi. Since the unemployment rate is based on those people actively seeking employment, the labor force participation has a significant impact. According to a study conducted by The Liberty Foundation, where it compared labor force participation rates using 2013 Bureau of Labor Statistics (BLS) data, out of the 51 states, Alabama ranked second lowest labor force participation for ages 35 to 44, third lowest for ages 45 to 54, and fourth lowest for ages 55 to 64. Fortunately, the participation rates for these age groups increased in 2014, with the 35 to 44 year old group increasing from 75.9 percent in 2013 to 80.2 percent in 2014.
Furthermore, BLS data shows that labor force participation for youth age 16 to19 has dropped from 31.4 percent in 2010 to 25.7 percent in 2014.
A majority of counties with participation rates lower than the state average are located in the western part of the state. In 2014, the measure of labor underutilization in Alabama was 12.6 percent, close to the nation at 12.0 percent. This measure includes the unemployed, those employed part time, and those marginally attached to the labor force. According to the Current Population Survey (CPS), Alabama had an average of 153,500 unemployed residents in 2014. Just over 89,000 workers were employed part time for economic reasons, which is referred to as involuntary part time. These people were either part time because the businesses they worked for were experiencing poor business conditions or were unable to find full time employment. People marginally attached to the labor force are those who are not presently working, but would like to work, are available to work, and have looked for work within the last year, but have not searched within the last four weeks. In Alabama, the marginally attached in 2014 was approximately 35,600. The number of discouraged workers in the state, which is a subset of the marginally attached, was around 11,000, accounting for 31.0 percent of all marginally attached.
The latest census figures for 2014 estimate the population in the state age 16 to 19 is 266,406. Over 43,000 were not enrolled in school, and approximately 17,000 were not enrolled in school or participating in the labor force. In Alabama, in 2014, there was approximately 120,000 youth age 14 to 21 in the workforce, 60.0 percent of them worked in retail trade and accommodation and food services, earning an average monthly wage of $800. Nearly 7,500 worked in manufacturing, earning an average monthly wage of $2,000, 6,500 in health care with an average monthly wage of $1,000, and 8,800 in administrative and support and waste management services with an average monthly wage of $1,300. In 2012, the unemployment rate for youth age 16 to 19 was 17.1 percent, and 16.0 percent for those age 20 to 24.
According to the SSI Annual Statistical Report 2014, Alabama ranks seventh in the nation in the percentage of the population who are receiving disability social security benefits. Census estimates from 2014 show that there were
approximately 776,448 people in the state with a disability, nearly 40.0 percent over the age of 65. Nearly 140,000 disabled persons were in the labor force in 2014, with over 24,000 being unemployed (Table 17). Half of those unemployed had some form of cognitive difficulty. Approximately 14,000 of the employed disabled persons had been determined to be below poverty level within the previous twelve months, while just over 11,000, nearly half, of the unemployed were below poverty level. Nearly 45.0 percent of the households in the state, with one or more people having a disability, received food stamps (Table 18).
Table 17. Disabled in the Labor Force
Disability Employed Unemployed in Labor Force Not
Total with disability 114,928 24,477 283,144
Hearing Difficulty 37,185 3,364 36,278
Vision difficulty 25,109 5,052 44,060
Cognitive difficulty 29,134 13,020 134,187
Ambulatory difficulty 44,315 7,576 183,488
Self-care difficulty 9,816 1,656 63,148
Independent living difficulty 16,211 6,069 130,137 Source: American Community Survey 2014
Table 18. Households & Families Receiving Food Stamps
Households Receiving Food Stamps 291,541
Households with one or more people 60 years and over 25.50%
Households with children under 18 years 53.70%
Households below poverty level 59.10%
Households with one or more people with a disability 44.90% Household Median income (dollars) past 12 months 15,749
Families Receiving Food Stamps 210,434
Families with no workers in past 12 months 28.00%
Families with 1 worker in past 12 months 48.20%
Families with 2 or more workers in past 12 months 23.80% Source: American Community Survey 2014
In 2014, Alabama ranked 21st in the country in veteran population. (VA National Center for Veterans Analysis and Statistics) The state is home to five military bases: Maxwell-Gunter AFB, Montgomery; Anniston Army Depot, Bynum; Fort Rucker, Dale; Redstone Arsenal; and, Aviation Training Center Coast Guard, Mobile. In addition, Alabama is home to the fifth largest Army National Guard in the nation, with a total force of approximately 13,000. According to the 2014 American Community Survey (ACS, 2014), the veteran population in the state in 2014 was approximately 344,304 (Table 19). The largest percentage of veterans lives in the areas where military bases are located. WDR 7, which includes the Montgomery metro area, includes a large percentage of veterans. A very large percentage of veterans live in southeast Alabama in WDR 10, where Fort Rucker is located.
Veterans in the state display a strong desire to become members of the workforce, which is displayed in the labor force participation rate of 72.0 percent. Over 63.0 percent of the veteran population in the state has at least some education beyond high school, with 25.0 percent holding a bachelor’s degree or higher. While the unemployment rate in 2014 averaged around 6.8 percent, the rate for veterans was 5.6 percent (ACS 2014). Still, there are many who need additional assistance due to disabilities incurred while serving, and other circumstances. Nearly 30,000 veterans were considered below poverty level in 2014 (ACS 2014). In addition, The Department of Veterans Affairs (VA) National Center for Veterans Analysis and Statistics estimated that 88,048 veterans in the state were receiving disability compensation.
Table 19. Veteran Population
Subject Veterans
Civilian population 18 years and over 344,304
MEDIAN INCOME IN THE PAST 12 MONTHS
Civilian population 18 years and over with income 35,573
EDUCATIONAL ATTAINMENT
Civilian population 25 years and over 339,797
Less than high school graduate 7.30%
High school graduate (includes equivalency) 29.00%
Some college or associate's degree 38.20%
Bachelor's degree or higher 25.50%
EMPLOYMENT STATUS Veterans
Civilian population 18 to 64 years 189,579
Labor force participation rate 72.00%
Civilian labor force 18 to 64 years 136,509
Unemployment rate (CPS rate) 5.60%
POVERTY STATUS IN THE PAST 12 MONTHS
Below poverty in the past 12 months 8.60%
DISABILITY STATUS
With any disability 32.40%
Source: American Community Survey 2014
An additional source of skilled labor exists in a pool of workers who are considered underemployed. Workers in occupations that underutilize their experience, training, and skills are underemployed. These workers often respond to job opportunities that they believe are better for reasons that include; lack of job opportunities, low wages in available jobs, and living too far from jobs. Workforce partners in Alabama fund an annual underemployment survey. This survey is in its sixth year of existence. The 2014 survey reported approximately 8,896 responses across the state. In 2014, the underemployment rate in Alabama was 25.2 percent. Half of the counties in the state had an underemployment rate higher than the state. The workforce development regions with the lowest rates were WDR 5 and WDR 10, with 22.2 percent for both. WDR 8 had the highest, 30.6 percent, with WDR 7 close behind at 28.7 percent. Both of those regions include universities that produce large numbers of college graduates annually. Most workers are satisfied with their jobs, but not satisfied with their earnings. If offered jobs paying up to 15.0 percent higher wages, 29.0 percent, about 590,000 workers, will leave their current jobs; 6.0 percent, 140,925, would leave for only a 5.0 percent increase. Respondents are asked if they have looked for a better job within the past three months. For all employed respondents in the state in 2014, 21.7 percent responded that they had, which was up from 19.3 percent the previous year. Of only those considered underemployed in the state, 35.7 percent had sought another job, up from 34.9 percent the previous year. The latest survey reported WDR 2 and WDR 3 with the highest percentages of respondents that have pursued a better job within the last three months. In WDR 2, 26.5