Lessons learned from the acquisition and the processing of the
CROP C-ALPS/b, CROP 03, CROP 04, CROP 18 NVR
and expanding spread seismic data.
Esperienze ricavate dall acquisizione ed elaborazione linee sismiche
CROP C-ALPS/b, CROP03, CROP 04, CROP 18 e dai dati
expan-ding spread .
STUCCHI E. (1), ZANZI L. (2), MAZZOTTI A. (1)
ABSTRACT- Over the last decade, our group has acquired valuable experience in the design and processing of deep seismic experiments. Some members of the group participated in the design of the seismic profiles of the CROP Project and pro-posed the acquisition of the special Expanding Spread experi-ments to integrate with NVR profiles. The group was also involved in the partial reprocessing (static correction revision) or total reprocessing of the NVR data, as well as being in charge of the design and processing of the special Expanding Spread experiments. The acquired experience was obtanied in very dif-ferent areas such as the Alps (CROP C-ALPS/b), the Northern Apennines (CROP 03 and CROP 18) and the Southern Apen-nines (CROP 04). The results provide interesting insights on the different seismic sources that were used, i.e. explosive, Vibroseis or both.
The resulting know-how acquired in these experiments is carefully analysed and the comparison of the various experi-ences has provided useful indications on the design of data acquisition and data processing methodologies.
A critical analysis is given of the correlations observed between data quality and the main factors influencing quality such as near-surface geology, topographic variations, and acquisition parameters (spread length, type of source, slalom line binning). The non-conventional processing techniques developed over the last few years (such as procedures for stat-ic correction, automatstat-ic analysis of data quality, pre-stack data weighting, and slalom line design) and their impact on the dif-ferent situations in which they were applied are all discussed. The contribution of the special Expanding Spread experi-ments is also described, along with the indications indications obtained from these experiments on how to maximize the suc-cess rate of future projects.
KEY-WORDS: Reflection seismic, Expanding Spread
seis-mic data, deep crust.
RIASSUNTO- Nell’arco degli ultimi dieci anni si sono accumu-late una serie di significative esperienze in materia di progettazio-ne e di elaborazioprogettazio-ne di esperimenti di sismica profonda. Membri del gruppo hanno infatti partecipato alla progettazione di alcune linee sismiche del Progetto CROP ed hanno proposto e curato l’e-secuzione degli esperimenti speciali Expanding Spread acquisiti a supporto di alcune delle suddette linee. Inoltre, il gruppo si è occu-pato di rielaborazioni parziali (ricalcolo delle correzioni statiche) o totali di alcuni di questi profili nonché della elaborazione dei dati degli esperimenti speciali. L’esperienza acquisita è resa ancor più interessante dal fatto che l’attività svolta ha interessato profili ese-guiti in aree con caratteristiche e problematiche molto diverse come le Alpi (CROP C-ALPS/b), l’Appennino Settentrionale (CROP 03 e CROP 18) e Meridionale (CROP 04). In più, i sud-detti profili offrono la possibilità di interessanti considerazioni in rapporto alle tecniche di energizzazione utilizzate, in alcuni casi l’esplosivo, in altri il Vibroseis, in altri ancora entrambe. Più che un riassunto delle suddette esperienze, recuperabile attraverso la bibliografia elencata, si intende offrire in questo lavoro una sinte-si critica del know-how acquisinte-sito. Dal confronto di queste espe-rienze emergono infatti una serie di interessanti indicazioni che vale la pena di sintetizzare, sia per ciò che riguarda il progetto dei parametri di acquisizione sia per ciò che riguarda le metodologie di elaborazione dei dati. In particolare, in questo lavoro si presen-ta un riesame critico delle correlazioni osservate tra la qualità dei dati e i fattori maggiormente influenti come la geologia superfi-ciale, le variazioni topografiche, i parametri di acquisizione (lun-ghezza degli stendimenti, tipo di energizzazione, andamento sla-lom dei profili). Si riesaminano anche le tecniche di elaborazione non convenzionali messe a punto in questi anni (come le proce-dure per le correzioni statiche, le tecniche di analisi automatica della qualità del dato, le tecniche di pesatura dei dati, le strategie di slalom sort) e se ne valuta il loro contributo nelle diverse situazio-ni affrontate. Infine, si riesamina criticamente il contributo degli esperimenti speciali Expanding Spread e si sintetizzano le indica-zioni emerse su come si devono progettare questi esperimenti per aumentare le speranze di successo.
PAROLECHIAVE: Sismica a riflessione, expanding spread,
crosta profonda.
11 figg.
(1) Dipartimento di Scienze della Terra - Sezione geofisica - Universita’ degli Studi di Milano, Via Cicognara 7, 20127 Milano.
STUCCHI E. - ZANZI L. - MAZZOTTI A.
76
1. - INTRODUCTION
This paper is divided into two main sections. The first section is dedicated to near vertical seismic profiles (NVR) in order to discuss the data quality as a function of the acquisition parameters, and summarize the know-how achieved on the most effective techniques for processing crustal data from our geographic area. The second section deals with the special Expanding Spread experiments, their objectives, results and expertise acquired in the optimum design of data acquisition and processing methodologies of these data.
As this is an overview, we have included only the pictures that are really necessary to illustrate our analyses; further details and data are available in the literature cited in the references.
2. - NVR SEISMICS
2.1. - ACQUISITION PARAMETERS AND DATA QUALITY
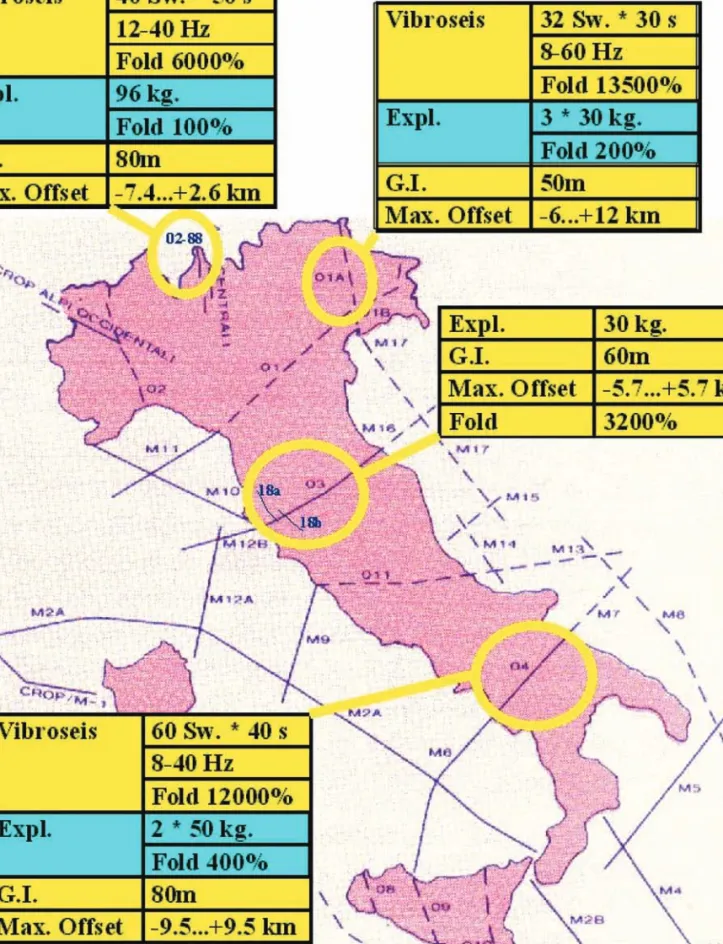
Figure 1 shows the position and main acquisi-tion parameters of the crustal seismic profiles with which the present authors were involved during the design or processing phases.
A comparison of the parameters of the diffe-rent surveys reveals that there were two diffediffe-rent approaches. The first is based on the use of the Vibroseis source with high coverage (never less than 6000% but often quite higher) and very long spreads (the maximum offset was progressively increased over the years, from the 7.4 km of the oldest profile in the Central Alps to the 12 km of the latest profile in the Eastern Alps). The second approach is based on the use of explosives with medium coverage (3200%) and shorter spreads (the maximum offset does not exceed 6 km) (MAZZOTTI,
1991; BERTELLI & MAZZOTTI, 1998). The Vibroseis
surveys were all integrated with dynamite surveys using heavy explosions (roughly 100 kg) and the shot spacing allowed to ensure continuity of the profile at minimum coverage.
A correlation seems to exist between these two approaches and the two different geographical areas: the first approach was adopted for the Alpi-ne profiles whereas the second was preferred for the Apennine profiles. The one exception is the CROP 04 profile, whose case history is very impor-tant. This was the first crustal profile performed in southern Italy and the acquisition parameters are very similar to those used successfully in the earlier Alpine profiles (e.g., on the CROP C-ALPS/b line
in the Central Alps) and, again successfully, in the most recent Alpine surveys (e.g., in the TRANS-ALP profile in the Eastern Alps). Thus, the much lower quality of the CROP 04 data was unexpected and had a significant impact on the design of sub-sequent surveys: after this experience, all the crustal profiles in central and southern Italy (CROP 03, CROP 18, CROP 11) were performed with explo-sives and with shorter spreads producing satisfac-tory results once again. The CROP 04 profile is therefore a particularly important case history, being the only crustal profile performed with vibra-tors in Apennine areas. Only a detailed analysis of these data is able to explain why vibrators produce data with a much lower quality than explosives in the Apennine regions.
A close look at the data in figure 1, leads us to reject insufficient coverage or unappropriate design of the bandwidth, or of the energy of the vibrator sweep as possible causes for the low data quality. In fact the coverage is actually quite high (12000%), twice the coverage of the CROP C-ALPS/b profile in the Central Alps, and almost equal to the covera-ge of the recent TRANSALP profile; the band-width (8-40 Hz) is certainly appropriate for deep targets, and the energy of the source is theoretically higher than was used for the Alpine profiles, as indi-cated by the sweep number for vibration point (60) and by the duration of a single sweep (40 s).
Nevertheless, comparison of the raw data immediately reveals an unequivocal inferiority of the Vibroseis with respect to explosives data (MAZ -ZOTTI et alii, 1996), the Vibroseis data being so
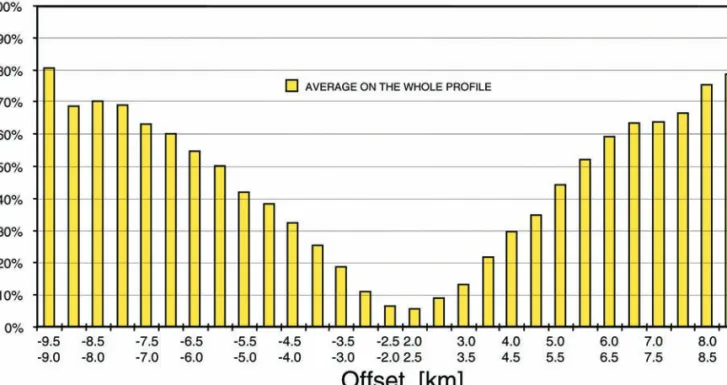
dominated by noise, especially at offsets greater then 3 km, that most of them are practically useless. This is shown in figure 2 where we plot the rate of killed traces versus offset as a result of a detailed analysis of the signal-to-noise ratio. The removal of particularly noisy traces was directed at selecting a data subset of acceptable quality in view of a new attempt to improve the final results with an experi-mental processing procedure. The number of killed traces at offsets longer than 4 km is higher than 30%. A similar behavior does not occur in the Alpi-ne profiles where the quality gap between the Vibroseis and explosive data is never impressive and where the decrease of the signal-to-noise ratio as a function of offset is never so rapid; conversely, in some cases the most interesting targets, i.e., the dee-pest reflections, were observed with higher energy at distant offsets rather than at near offsets (BAR -DELLIet alii, 1993; 1994 a, b). A closer examination
of the quality of the data along the CROP 04 pro-file shows that the degradation of the
signal-to-Fig. 1. – Position and acquisition parameters of the examined profiles. – Mappa di posizione con indicati i profili esaminati ed i relativi parametri di acquisizione.
STUCCHI E. - ZANZI L. - MAZZOTTI A.
78
noise ratio at medium and long offsets is particu-larly noticeable in the Apennine crossing sector whereas the data quality improves in the western sectors of the profile as soon as the spread leaves the mountains. This suggests a correlation between data quality and the access difficulties in the moun-tains and the resulting slaloming of the seismic line. The final CROP 04 line is indeed particularly croo-ked in some Apennine sectors, but it is unlikely that environmental conditions are more severe here than in the mountain areas along the Alpine CROP pro-files; besides, a direct attempt to correlate the qua-lity variations of the data along the profile with the slaloming rate gave a negative response.
Not was any correlation observed between data quality and coupling problems for vibrators and geophones, i.e., from variations in surface lithology at the source or receiver positions.
The most interesting correlation seems to be that between data quality and the structural comple-xity of the sedimentary layers. Figure 3 shows the rapid sequence of rock formations that form the sub-weathering structure; the seismic velocities measured from the first arrivals, during the proce-dure for static computation are also shown.
The sector considered in this figure consists approximately of the first 60% of the profile and includes the whole segment that crosses the Apen-nines. The headwave velocity is characterized by
sudden, sharp variations that are coherent with the rapid sequence of sedimentary formations.
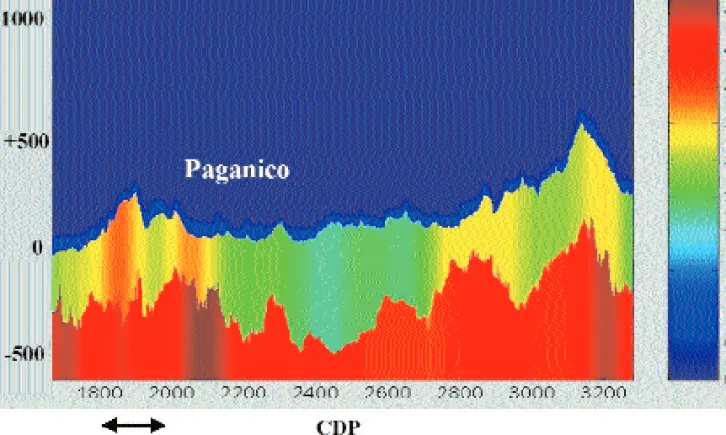
Similar complex structures were also observed in other Apennine areas, e.g. along the CROP 03 profile. Figure 4 shows the near-surface model used to compute the static corrections for a 50 km seg-ment of the profile. Again, we can observe rapid lateral variations of the velocity in the subweathe-ring layers, especially where the topographic varia-tions are higher.
For comparison, we show the near-surface model obtained in the same way for the CROP C-ALPS/b profile in the Central Alps near the Splu-ga Pass (fig. 5). Although the topographic eleva-tion decreases rapidly in this sector, the headwave velocities do not exhibit any remarkable lateral variations.
The hypothesis emerging from these compari-sons is that the Apennine profiles exhibit on avera-ge (although there are some exceptions) a higher structural complexity in the sedimentary layers than the Alpine profiles and that this complexity is some-how responsible for the degradation in data quality. It must be admitted, however, that this correlation between data quality and structural complexity, although extremely interesting, does not provide an exhaustive explanation. Some doubts remain after comparison of the CROP 04 data with other Vibro-seis data collected in near areas for hydrocarbon
Fig. 2 – Percentage of killed traces versus offset (clusters of 500 m). Trace selection was based on a sequence of automatic quality tests in the time and frequency domain.
– Percentuale di tracce eliminate in funzione dell’offset (a classi di 500 m). La selezione delle tracce rumorose è stata effettuata applicando una sequenza di test di qualità automatici, sia nel dominio del tempo che della frequenza.
exploration. Since these are not deep seismic data the comparison is valid only for the first 4-5 seconds, but this is sufficient to observe a signifi-cant better quality for these non-crustal profiles, that is hard to explain in terms of different vibra-tion or spread parameters.
The question whether the electronics of the CROP 04 vibrators was perfectly calibrated or not will probably only be answered performing some direct comparison with new vibrator data recorded in the same critical locations.
2.2. - EXPERIMENTAL REPROCESSING
The task of the authors in data processing ope-rations for some CROP profiles was at times very specific, such as the computation of static correc-tions for the CROP 03 profile, and at times of a more general nature, such us to explore the effects of a complete reprocessing sequence specifically designed or calibrated for deep data on an entire
profile (CROP 04) or on a segment of a profile (CROP C-ALPS/b).
Generally speaking, a conventional processing sequence, derived from the sequences normally applied to seismic data for hydrocarbon explora-tion, can give satisfactory results even when applied to deep seismic data such as the CROP data (BER -TELLIet alii, 1998). However, some processing
ope-rations are more rewarding when performed with special care and with a specific calibration for these particular data.
In the case of static corrections, for exemple, and for experiments in which the main targets are very deep and very long spreads are used to collect the data, these corrections can be successfully estimated with unconventional model parameters. In fact, for very deep targets, we can increase the depth implied in surface consistent statics, i.e., we can compute sta-tic corrections that compensate for the thickness and velocity variations of an entire wafer of sedimentary layers rather than limiting compensation to the wea-thering layer. This extension generally benefits from
Fig. 3 – Near-surface lithology and velocity of the subweathering layers as obtained from refraction seismics along the first 100 km of the CROP 04 profile. Note the rapid lateral variations of velocity and the strong correlation with the lithologic sequence.
– Litologia delle formazioni superficiali e velocità dei livelli consolidati ottenuta dagli arrivi rifratti lungo i primi 100 km del profilo CROP 04. Si notino le rapide variazioni laterali di velocità e la loro forte correlazione con la litologia.
STUCCHI E. - ZANZI L. - MAZZOTTI A.
80
Fig. 4 – Near-surface model used for static computation in a 50 km segment located in the western part of the CROP 03 profile. – Modello degli strati superficiali usato per il calcolo delle correzioni statiche lungo un tratto di 50 km nella porzione occidentale del profilo CROP 03.
Fig. 5 – Near-surface model used for static computation in a 25 km segment of the CROP C-ALPS/b profile in proximity of the Spluga pass. – Modello degli strati superficiali usato per il calcolo delle correzioni statiche lungo un tratto di 25 km del profilo CROP C-ALPS/b in prossimità del Passo dello Spluga.
the availability of very long offsets so that the refrac-tion analysis of these data can reconstruct, with a multilayer model, the upper part of the sedimentary layers down to a depth of several hundreds of meters, as shown in Figures 4 and 5 and extensively documented by the models obtained along the whole CROP 03 profile (ZANZI, 1998a). For very deep
tar-gets it is easy to verify that the upward wavefronts cross these surface layers with a quasi-vertical propa-gation, thus allowing to extend the surface consistent assumption sufficiently to apply the corrections down to an unconventionally deep datum (BARDELLI et alii, 1994a). For our computation of the “deep” statics we made wide use of the Wave number Itera-tive Modelling (WIM) method (ZANZI & ANDENA,
1993; ZANZI, 1996), which can estimate multilayer
models with an option for possible vertical gradients of the layer velocities and is particularly suitable for exploiting the high fold data offered by Vibroseis profiles. The only exception was again the CROP 04 profile where the explosive data, with the addition of only a few Vibroseis data to ensure coverage of the refraction horizons, were preferred to pick the first arrivals because of the high noise affecting the medium and long offset vibrator data. In this case, use of the WIM method was limited to small sectors while most of the profile was solved with an algo-rithm based on the General Reciprocal Method (GRM) method (MAZZOTTIet alii, 1997; 2000), which
is more suitable for low fold data analysis.
Another processing operation that can produ-ce some improvement is also related to the uncon-ventional extension of the spreads and consists of analyzing the response from the main deep reflec-tors as a function of the illumination angle in order to calibrate an optimal offset-time depen-dent weighting function to be applied to the pre-stack data. This operation, performed with an off-set growing function, was used successfully to improve the reconstruction of the deepest reflec-tors in the Spluga Pass area of the CROP C-ALPS/b profile (BARDELLIet alii, 1993; 1994a). The
method was also applied with great benefit to the CROP 04 profile where the optimal time-offset dependent function was calibrated through a totally automatic analysis of the signal-to-noise ratio (MAZZOTTIet alii, 1997; 2000).
The efforts made to improve the CROP 04 sec-tion have also led to the development of other tech-niques, which will be described below, that were specifically designed to overcome the problems posed by these unfavorable data; they therefore represent valuable know-how that could be applied to similar situations in the future.
Because of the poor quality of most of these Vibroseis data, especially the ones recorded at the end of the spreads, and of the large quantity of data produced by such a high fold survey, we developed an automatic technique to perform an accurate analysis of all the data, trace by trace. The parame-ters selected to estimate this quality indicator are the signal-to-noise ratio measured on the first arrival and the Frequency-Time spectrum of each single trace. Any trace affected by an insufficient signal-to-noise ratio or by a Frequency-Time spectrum domi-nated by strong noise components (often characte-rized by a thick bandwidth and by a stationary behavior) is killed so that it will not contribute to the degradation of the final stack section.
The low data quality makes the Normal Move Out (NMO) velocity analysis very demanding. The method used to optimized the detection of the most promising events consists of a soft Frequency Offset (FX) deconvolution applied to common off-set data to enhance events that have at least a feeble lateral coherence.
The Common Depth Point (CDP) gather con-struction is another technique that was carefully analyzed to find the best slaloming design (MAZ -ZOTTIet alii, 1997; 2000). Different binning criteria
of the CROP 04 data revealed that the slalom line has a noticeable impact, especially on the upper events of the stack section; this is not an unex-pected result, considering that the spread is extre-mely long and that the lateral resolution of a sei-smic experiment is inversely proportional to depth. While the slalom lines are often designed by following the Common Depth Point (CMP) space distribution, in an attempt to minimizing the tortuosity of the resulting line, the best results in this case were obtained by designing the slalom line following to the CMP distribution of the short offset data (e.g., the data with offset lower than 3 km). These are the data that contribute most to the construction of the upper part of the stack section whereas the longer offset data gene-rally do not contribute to these events because they are cancelled by the muting operation needed to remove the highly stretched data. Since the CMP distribution on a crooked profile is some-how offset-organized, the slalom line obtained by honoring a cluster of offsets rather than trying to honor all the available offsets may be significantly different and the impact on data quality may be remarkable.
Table 1 lists the non-conventional techniques that were developed and indicates on which profiles they were successfully applied.
STUCCHI E. - ZANZI L. - MAZZOTTI A.
82
It is evident that CROP 04 was the most demanding profile in terms of processing efforts. It is an interesting case history because it illustrates what quality improvement can be achieved with an experimental processing sequence, i.e., from labo-rious processing work that cannot be justified in terms of time and costs by industrial seismic pro-cessing centers involved in hydrocarbon exploration (MAZZOTTIet alii, 1997, 1998).
The final improvement to quality was the result of a long process in wich each step was of equal impor-tance; in other words, these is no a specific processing operation that was able to produce a sudden and dra-matic improvement and that can be considered the keystone of this reprocessing experience.
3. - SPECIAL EXPERIMENTS WITH THE EXPANDING SPREAD TECHNIQUE These experiments were performed to integrate the NVR seismic profiles in very specif areas; the aim is to reach the deep targets with illumination angles wider than those used in NVR seismic. Many advan-tages are to be gained from these data (BARDELLI et alii, 1994c): a) observation of deep targets with post-critical reflections; b) bypass of local near-surface structures that can cause high signal absorption pro-blems, thus hiding the lower structures from NVR seismics; c) the chance to make accurate velocity and dip estimates on deep events by the joint analysis of expanding spread and NVR data.
These experiments are economically convenient only when they are performed in conjunction with the NVR profile, so as to use the NVR spread and only a few additional energetic shots.
3.1. - SUCCESSFUL AND UNSUCCESSFUL EXPERIMENTS
These special experiments were carried out on selected sites along the CROP 03 and CROP 18 profiles.
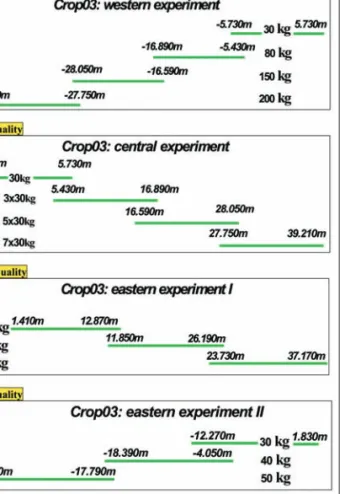
Figures 6 and 7 show the design of each expe-riment and the explosive charge used for each spread position. A subjective evaluation of the qua-lity of each experiment is also reported; the reader can also evaluate this quality on the processed sec-tions presented in ZANZI (1998b) and BARDELLI et alii (1995). Apart from two experiments whose results were particularly poor, all the others can be considered successful. The first of the two disap-pointing is the CROP 03 experiment in the central segment of the profile where the low seismic response, already observed on the NVR data, was further induced by the limits set on the explosive charge (lower than 30 kg) to avoid demage to the historical buildings in the nearby villages. To com-pensate for this limit many shots had to be repeated and stacked but, as discussed below, this procedure is less effective than fixing single shots with a larger quantity of explosive. The second unsatisfactory experiment is located in the eastern segment of the CROP 03 profile; in this case, the poor results are likely due to the small explosive charges (this was the first special experiment in the CROP Project so we had no previous results to use as a reference base for optimizing the design) and to a sub-optimal selection of the shot site. The latter explanation was later confirmed by the positive results obtained in the reciprocal experiment in the same area, using explosives of similar size to the original forward experiment.
Table 1 - Algorithms or procedures that were specifically developed to process deep seismic data. – Algoritmi o procedure sviluppate specificatamente per elaborare dati sismici profondi.
Algorithm: Successfully applied on:
Data analysis: CROP 04
automatic suppression of noisy traces
Static corrections: WIM CROP C-ALPS/b, CROP 03, CROP 04
GRM CROP 04
(explosive data integrated with some Vibroseis data) FX Deconvolution on common offset sections CROP 04
Slalom sort optimization CROP 04
Weighted stack CROP C-ALPS/b (offset dependent weights) CROP 04 (SNR dependent weights)
3.2. - SPECIFIC CONTRIBUTIONS FROM THESE EXPERI -MENTS
Additional informations brought by these expe-riments varies from case to case according to the specific caractheristics of each area and the quality of the data. Where data quality is good, we can expect an improvement in the definition of the sei-smic velocities. The extension of headwave analysis to distances of 30-40 km from the source allows us to reconstruct interval velocities and layer depths down to 2-3 km, provided that the velocities can be assumed to increase with depth (ZANZI, 1998b).
These velocity models can be transformed into an Root Mean Square (RMS) velocity function, which can be compared with the results of the standard NVR velocity analysis to validate or improve these functions for an effective application of NMO cor-rections to the upper events. But the most intere-sting contribution that these experiments make to our knowledge of the seismic velocities is the defi-nition of the velocity of events observed at reflec-tion times higher than 5 s. At such high times the resolution of the standard velocity analysis
perfor-med on NVR CMP data is quite poor although the crustal surveys are performed with unusually long spreads. Low resolution is not a problem for the dynamic corrections but becomes a real problem when we try to transform the time section into a depth section through migration or when the geo-logists try to propose a deep structural interpreta-tion. A joint analysis of NVR and Expanding Spread experiments, on the other hand, offers the opportunity to extract accurate estimates of NMO velocities and reflector dips. A joint approach is needed because the expanding spread data globally form a common shot experiment and thus are affected by velocity-dip ambiguity; in other words, there are many velocity-dip pairs that can be used to obtain good corrections of the move-out of a reflection observed on a common shot gather. In theory, this ambiguity does not exist and the solu-tion is unique, as shown by ZANZI(1998c) for the
analogous problem studied on P-SV converted waves. However, the resolution of a velocity-dip analysis performed on a common shot gather is so poor that in practice the ambiguity does exist. The problem is solved efficiently when the competitive velocity-dip pairs are simultaneously applied to migrate both the expanding spread and the NVR data: only one solution will be able to move the cor-respondent reflectors to the same depth positions for both the NVR and the special data. For exam-ple, with this joint procedure it was possible to assign the velocities of the deepest reflectors in the eastern segment of the CROP 03 profile with a resolution of a few hundreds of meters per second (ZANZI, 1998b).
Apart from their contribution to the construc-tion of the velocity model, these special experi-ments could also help with problems that cannot be
Fig. 6 – Expanding spread special experiments along the CROP 03 profile.
– Esperimenti speciali “Expanding Spread” lungo il profilo CROP 03.
Fig. 7 – Expanding spread special experiments along the CROP 18 profile.
STUCCHI E. - ZANZI L. - MAZZOTTI A.
84
solved by NVR seismics. In the eastern segment of the CROP 03 profile both the NVR seismic section and the expanding spread data show high energy that is apparently reflected by a very deep horizon (the two-way traveltime of this event is between 14 and 15 s). By analyzing the expanding spread data, it was possible to confirm the existence of a very deep reflector by eliminating other possible inter-pretations (multiples, combination of downward refractions and lateral reflections) that could not be excluded on the basis of NVR seismics. Another interesting example is that of the experiments per-formed along the CROP 18 profile. In this case, we see some energetic reflections between 5.5 and 6 s (two-way times) that could be explained by the exi-stence of dip reflectors and/or by the exiexi-stence of deep layers with velocities lower than the upper layers. Another possible interpretation is to assume that these events come from upper reflectors as converted waves (BARDELLI et alii, 1995). The
pro-blem is still open to debate because a joint analysis of NVR and expanding spread data has not yet been performed but again this approach has the potential to provide a unique interpretation.
3.3. - ACQUISITION DESIGN
Very few special experiments have been conduc-ted so far but from a preliminary statistical analysis it is nevertheless possible to draw up some provisional guidelines for the design of future similar experi-ments; these guidelines could be updated as each new case history is added (ZANZIet alii, 1997).
It is obvious that these experiments must be designed as a sequence of explosions of increasing size as the spread distance from the source is exten-ded. What is not as obvious is to define the optimal charge quantity versus offset function. Figure 8 shows an average curve of the signal-to-noise ratio (SNR) as a function of the offset when the explosi-ve charge is kept constant. The figure is based on data taken from the offset range where the experi-ments gave reliable measureexperi-ments, i.e., up to a maxi-mum offset of about 20 km (STUCCHI & ZANZI,
1998). The data actually show that beyond this dis-tance the signal-to-noise ratio tends to stabilize around the 0 dB level, indicating that the signal is no longer distinguishable from the noise. This means that the equipment used for these experiments, con-sisting of explosive charges that are never larger than 200 kg and geophones with a resonance fre-quency of 8 or 10 Hz, are not appropriate for recor-ding data at distances of more than 20 km. This is
quite consistent with the theoretical studies and with the synthetic simulations performed to prepare the design of the experiments (PIRERA & ZANZI, 1993).
Note that the SNR scale in figure 8 is normalized because the absolute scale would depend on the charge quantity of the experiments and on other local factors that can vary from site to site. Instead, the important point in this figure is the SNR-offset decay curve, from which the experiment designer can derive an estimate of how many decibels should be gained, to preserve the signal level, by increasing the explosive quantity any time the spread is moved far away from the source. To transform these dB levels into charge sizes, the designer then has to define the variation in SNR as a function of the quantity of explosive. An experimental estimate of this growth rate is presented in figure 9, where we plot the average curve of the signal-to-noise ratio as a function of the charge size, as derived from a comparison of all the available data. Of course, the measurements were compared at a constant distan-ce from the sourdistan-ce point and were combined after normalization (STUCCHI& ZANZI, 1998). Again, an
absolute scale is not meaningful because it is affec-ted by many local factors and by the offset selecaffec-ted for the comparisons. The main point of the figure is instead the rate of the relative improvements in the SNR as the charge size is increased. By ignoring the anomalous trend observed for very high sizes (200 kg), which is probably unreliable because it is the result of an average operation over a very small number of available data, we obtain quite a high rate, about 20 dB/decade.
This number can be taken as a reference to fina-lize the charge size design as a function of the sour-ce-spread distance. It is also interesting to note that a rate of 20 dB/decade is far higher than the 10 dB/decade that we could expect under the most favorable assumptions (i.e., assuming that the noise of different measurements is statistically indepen-dent) from a sequence of constant-size explosions repeated and stacked in a number proportional to the source-spread distance, as was done for the central segment of the CROP 03 profile (fig. 6). There are two possible explanations for the higher growth rate that makes one single explosion preferable to the stack of many small explosions. The first is that high frequencies are affected by absorption more than low frequencies so that a large charge size is more effec-tive for the well known reason that a big explosion generates lower frequency components than a small explosion. The second explanation could be related to explosion efficiency, i.e., to the percentage of ela-stic energy transmitted to the medium compared
with the total energy produced by the explosion. Figure 9 could be interpreted as an indication that explosion efficiency depends on charge size and, spe-cifically, that this function tends to increase at least up to sizes of 150 kg. In addition to these arguments in favor of large explosions rather than many small explosions, these is the problem of source wavelet repeatability. In order to get the best results by stac-king the data from repeated explosions, the signal produced by any single explosion has to have a simi-lar shape and comparable energy.
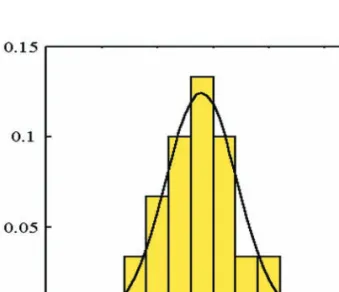
An analysis of the most interesting experiment carried out with the repeated explosion this proce-dure (the central experiment of the CROP03 profi-le) indicates, on the contrary, that the statistical dis-tribution of the transmitted energy presents a remarkable dispersion (fig. 10), despite the fact that all the explosions were of the same size (30 kg) and in the same site, in boreholes that are very close togheter (STUCCHI& ZANZI, 1998). The
experimen-tal distribution, plotted in figure 10 on logarithmic scale and after normalization to the most frequent SNR measurement, is well fitted by a Gaussian function. It is a Gaussian probability density func-tion with a standard deviafunc-tion of 3.2 dB. The con-clusion is that the dispersion of the energy levels produced by the explosions is not negligible; this means that the stacking operation must be applied after an appropriate data pre-processing, e.g., as indicated in the next section. In any case, this con-clusion constitutes an additional argument against this approach.
3.4. - DATA PROCESSING
The processing sequence that was defined for these special data consists partly of conventional operations and partly of new operations designed specifically for these experiments (BARDELLI et alii,
1994b, 1994c, 1995; ZANZI, 1998b). The procedure
is summarized in figure 11 and its most interesting features are discussed below.
During the pre-processing phase it is conve-nient to apply bandpass filters calibrated on the source-spread distance and notch filters locally tuned on the frequencies of the coherent noise that often affects small groups of receiving stations.
As mentioned in the previous section, the pro-cessing operations needed to stack the data produ-ced by many small shots repeated in the same posi-tion must account for a non-negligible dispersion of the transmitted energy. Thus, the optimal stack con-sists of a weighted sum where the weighting
func-tion is calibrated on the SNR level measured on each shot repetition.
The data belonging to different panels, where a panel is the experiment or the stack of experiments recorded at a fixed spread position, must be appro-priately combined to compose the entire common shot experiment. For this reason, the acquisitions are always designed to ensure a short overlap bet-ween two subsequent spread positions, so as to synchronize vertically, i.e., in time, the data belon-ging to different panels and to apply an energy equalization of the panels to produce a well calibra-ted image of the whole common shot.
With static corrections, it is worth adopting the same two-step approach used for NVR seismic data: first, we estimate the static corrections by applying a refraction method directly to the expan-ding spread data or to the NVR data; we then opti-mize the corrections by applying a sort of residual static algorithm. Actually, residual statics are defined on multifold NVR data; for single-fold data, as with the expanding spread experiments, we have to rede-fine the concept and the estimation method. A pro-cedure that proved successful with these data with good results, consists of an algorithm that estimates the residual static corrections as the relative delays between traces that maximize the energy of the stack of adjacent traces within a short moving win-dow (3 or 5 traces long). As in conventional residual static programs, the optimization algorithm is applied around the most important reflecting hori-zons selected beforehand by the user.
The dynamic corrections of these data are, as discussed earlier, based on a joint velocity analysis that simultaneously considers both the expanding spread and the NVR data: in the first 2 s (two-way time) the velocity field is derived from the analysis of the refracted events picked up on the expanding spread data; in the 2-5 s interval the velocities are well defined by the analysis of the reflected events on the NVR data; finally, for two-way times higher than 5 s, the most accurate results come from the move-out analysis of the deep events observed on the expanding spread data followed by the compari-son of NVR and expanding spread migrated sec-tions to solve the velocity-dip ambiguities.
4. - CONCLUSIONS
Comparison of the acquisition parameters of the various NVR seismic profiles in which we were invol-ved reveals two main approaches, one based on the Vibroseis source with high coverage (never less than
STUCCHI E. - ZANZI L. - MAZZOTTI A.
86
6000% but often much higher) and very long spreads (in the order of 20 km), and the other based on the explosive source with medium coverage (3200%) and with shorter spreads (around 10-12 km).
The type of approach used depends greatly on the geographic geological area of the profiles, the first being the preferred approach for the Alpine profiles and the second for the Apennine profiles. The results show that both approaches were suc-cessful in their application areas. The CROP04 pro-file is the only exception, being the first and last cru-stal profile performed in southern Italy with vibrators and using acquisition parameters very similar to the ones applied successfully on the Alpi-ne profiles. The partial failure of this profile has been thoroughly analyzed before attempting a diffi-cult reprocessing operation aimed at bringing the quality of the final stack section up to an acceptable level. The conclusion drawn from this case history is that the Apennine profiles seem on the average, to present a more complex structure of the upper
sedimentary layers than the upper structure of the Alpine profiles; this greater complexity means that very energetic sources such as explosives are prefe-rable to vibrators and suggests a reduction of the spread length. However, this conclusion does not provide answers to all the questions raised by this case history and only a new acquisition experiment in the most difficult segments of the profile will be able to offer an unequivocal solution.
NVR data processing, with a conventional pro-cessing sequence derived from the standard proces-sing methods applied to hydrocarbon exploration seismics, can also produce satisfactory results when applied to the deep seismic data typical of the CROP Project. Nevertheless, we are convinced that some processing operations are particularly delicate and should be specifically optimized to account for the depth of the targets and the unusual extension of the spreads. These include the refraction static corrections and pre-stack data weighting as a func-tion of the time-offset dependent signal-to-noise ratio. In addition to these operations, which are always recommended on crustal data, new techni-ques were developed and tested on the challenging CROP 04 profile. These techniques could be suc-cessfully applied again in similar situations to improve the quality of the final sections. They include a totally automatic procedure for the quality analysis and selection of pre-stack data, a pre-stack
Fig. 8 – Average curve of the signal-to-noise ratio versus offset for a constant explosive charge.
– Curva media del rapporto segnale/rumore rispetto alla distanza sorgente-ricevitore a parità di carica di esplosivo.
Fig. 9 – Average curve of the signal-to-noise ratio versus charge size for a constant source-receiver distance.
– Curva media del rapporto segnale/rumore rispetto alla carica di esplosivo a parità di distanza sorgente-ricevitore.
Fig. 10 – Statistical distribution of the signal-to-noise ratio measured on data from clusters of constant-charge explosions (30 kg) extracted from the experiment in the central segment of the CROP 03 profile. The expe-rimental data are fitted with a Gaussian function with a standard
deviation of 3.2 dB.
– Distribuzione statistica del rapporto segnale/rumore misurato in gruppi di dati con carica costante (30 kg) estratti dall’esperimento nella parte centrale del profilo CROP 03. I dati sperimentali sono modellati con una funzione Gaussiana con una
FX deconvolution applied on clusters of common-offset gathers, and a design of the slalom line based on the CMP distribution of the short and medium offset data. As shown by the CROP 04 case history, a combined application of all these techniques (note that no single technique was surprisingly effective) can make a remarkable improvement to stack section quality compared to the section obtai-nable with a standard industrial procedure.
The acquisition of some crustal profiles was integrated with special experiments based on the expanding spread technique. These are local experi-ments that are cost-effective only when conducted in combination with the NVR survey. Their objec-tive is to investigate the deeper reflectors with much wider illumination angles than are obtained with the NVR surveys. The results demonstrate that these tests can help to define the deep structures by observing the deeper horizons with post-critical reflections that allow an accurate velocity-dip analy-sis. Only a small number of special experiments have been carried out so far, but from a preliminary statistical analysis we have developed some
provi-sional guidelines for the optimal design of future experiments. Specifically, we have derived experi-mental curves that help to design the charge size as a function of the source-spread distance. All the experimental analyses seem to indicate that the approach based on stacking many experiments with small explosions is less effective than the approach based on single big explosions. Processing of these special data requires new techniques that had to be specifically designed. They include time-offset dependent filters, a procedure for synchronization and equalization of the different panels to compo-se the whole common shot experiment, an algo-rithm for pseudo-residual static computation and a method for joint velocity analysis of NVR and expanding spread data.
Acknowledgements
The authors are grateful to the institutions that funded the CROP Project (CNR, AGIP, ENEL) and would like to thank the directors of the profiles analyzed in this work (Prof. PIALLI, Prof. SCANDONEand Prof. LAZZAROTTO) for their valuable cooperation.
Fig. 11 – Processing sequence for the expanding spread data. – Sequenza di elaborazione per i dati “Expanding Spread”.
PROCESSING SEQUENCE
DEMULTIPLEX RESAMPLING (8 ms)
GEOMETRY EDIT NOISE FILTERING Bandpass filters - Notch filters
DECONVOLUTION
Spectral shaping - Predictive deconvolution PANEL EQUALIZATION
PANEL WEIGHTED STACK COMMON SHOT COMPOSITION
REFRACTION STATICS Derived from NVR data
INTEGRATED VELOCITY ANALYSIS NMO CORRECTIONS
MUTING
PSEUDO - RESIDUAL STATICS Modified Max Power Autostatics
A.G.C.
F-X DECONVOLUTION TRACE MIX (3 tr) TIME VARIANT FILTER
STUCCHI E. - ZANZI L. - MAZZOTTI A.
88
REFERENCES
BARDELLIA., BOSSIL. & ZANZIL. (1993) - Rielaborazione
speri-mentale della linea CROP 02. Atti 12° Convegno GNGTS,
CNR-Roma: 57-68.
BARDELLIA., BOSSIL. & ZANZIL. (1994a) - CROP 02 Passo
Spluga: reprocessing using advanced statics. Quaderni di Geodi-namica Alpina e Quaternaria, 2: 1-47.
BARDELLIA., BOSSIL. & ZANZIL. (1994b) - Processing techniques for expanding spread experiments applied to the crustal CROP proj-ect. Expanded abstracts 64th SEG Meeting, October 23-28,
Los Angeles: 707-710.
BARDELLIA., BOSSIL. & ZANZIL. (1994c) - Acquisizione
speri-mentale ed elaborazione integrata di dati near-vertical e wide angle
per il progetto crostale CROP 03. Atti 13° Convegno GNGTS,
CNR-Roma: 741-751.
BARDELLIA., STUCCHIE. & ZANZIL. (1995) - Soluzioni non con-venzionali per l’elaborazione di dati wide-angle a campionamento
spaziale denso. Atti 14° Convegno GNGTS, CNR-Roma:
597-608.
BERTELLIL. & MAZZOTTIA. (1998) - Planning and acquisition of the
NVR CROP 03 seismic profile. Mem. Soc. Geol. It., 52: 9-21.
BERTELLIL., STORERP. & MAZZOTTIA. (1998) - Processing
strate-gies for the NVR CROP 03 seismic profile. Mem. Soc. Geol.
It., 52: 23-31.
MAZZOTTIA. (1991) - Indagine sui parametri e sulle tecniche di
acqui-sizione sismica della linea CROP 03. Studi Geologici Camerti,
vol. speciale 1991/1: 13-17.
MAZZOTTIA., STUCCHIE. & ZANZIL. (1996)- Analisi dei dati
sis-mici CROP 04 e primi risultati di elaborazione. Atti 15°
Con-vegno GNGTS, CNR-Roma: 305-310.
MAZZOTTIA., STUCCHIE., FRADELIZIOG. L., ZANZIL., SCAN -DONEP. & MORGANTEA. (1997) - Rielaborazione dei dati
sis-mici CROP 04 lungo il tratto Agropoli-Venosa. Atti 16°
Con-vegno GNGTS, CNR-Roma,:12.
MAZZOTTI A., FRADELIZIO G., SCANDONE P., STUCCHI E. &
ZANZIL. (1998) - Seismic exploration in complex terrains: an
experience in the Southern Apennines. Extended abstracts 60th
EAGE Meeting, June 8-12, Leipzig.
MAZZOTTIA., STUCCHIE., FRADELIZIOG.L., ZANZIL. & SCAN -DONEP. (2000) - Seismic exploration in complex terrains: a
pro-cessing experience in the Southern Apennines. Geophysics, 65: 1402-1417.
PIRERAF. & ZANZIL. (1993) - The reflectivity method as a tool for
evaluating the seismic response of layered structures. Applied Geophys., 30: 35-41.
STUCCHIE. & ZANZIL. (1998) - ESP Experiments along CROP
profiles (03 and 18): remarks on the optimal source-receivers
config-uration. Mem. Soc. Geol. It., 52: 45-53.
ZANZI L. (1996) - The WIM method for refraction statics.
Geo-physics, 61: 1859-1870.
ZANZIL. (1998a) - Static correction estimation: results and near-surface
models for the CROP 03 profile. Mem. Soc. Geol. It., 52: 33-44. ZANZIL. (1998b ) - Expanding spread experiments: data processing
and contributions. Mem. Soc. Geol. It., 52: 55-66.
ZANZIL. (1998c) - Dip-velocity analysis of converted waves on a
2D-2C land profile. Extended abstracts 60thEAGE Meeting,
June 8-12, Leipzig.
ZANZIL. & ANDENAA. (1993) - Deep statics for crustal surveys with
the WIM method.Expanded abstracts 63rd SEG, September
26-30, WASHINGTON, D.C.: 1149-1152.
ZANZIL., STUCCHIE. & MAZZOTTIA. (1997) - Design of crustal
acquisitions: Vibroseis vs. Explosive and Expanding Spread
exper-iments. Extended abstracts 59thEAGE Meeting, May